


nginx-module-vts模块安装(模块编译进nginx)
# 下载最新的nginx-vts模块
wget https://github.com/vozlt/nginx-module-vts/archive/v0.1.18.tar.gz


[root@localhost src]# pwd
/usr/src
[root@localhost src]# ls
debug  kernels  nginx-1.16.1  nginx-1.16.1.tar.gz  nginx-module-vts-0.1.18  v0.1.18.tar.gz
# nginx-module-vts安装
#重新编译
cd nginx-1.16.1
./configure --prefix=/usr/local/nginx  --add-module=/usr/local/nginx-module-vts/


–add-module=/usr/local/nginx-module-vts 为模块地址

[root@localhost ~]# /usr/local/nginx/sbin/nginx -V
nginx version: nginx/1.16.1
built by gcc 4.8.5 20150623 (Red Hat 4.8.5-44) (GCC)
configure arguments: --prefix=/usr/local/nginx --add-module=/usr/src/nginx-module-vts-0.1.18/
nginx配置
nginx配置server中添加:
location /status {
     vhost_traffic_status_display;
     vhost_traffic_status_display_format html;
    }
如果需要限制访问,可以使用
# vhost配置
cat nginx-vts.conf

server {
    listen  50001;
    server_name localhost;

    location /status {
            #allow 127.0.0.1;   #替换为你的prometheus ip;
            #deny all;
            vhost_traffic_status_display;
            vhost_traffic_status_display_format html;
    }
}
http中添加:
# nginx.conf 配置

cat  nginx.conf

http {
...
      # nginx-vts
        vhost_traffic_status_zone;
        vhost_traffic_status_filter_by_host on;   #开启此功能,会根据不同的server_name进行流量的统计,否则默认会把流量全部计算到第一个上。
        vhost_traffic_status_filter on;
        vhost_traffic_status_filter_by_set_key $status $server_name;
...
}
配置
如果想统计所有的虚拟主机,就在http配置中添加配置,否则就只在想要监控的server中添加配置 配置说明:
添加在nginx.conf中的http段落下。
- 开启基础监控
vhost_traffic_status_zone;
- 开启详细状态码统计
vhost_traffic_status_filter on;
vhost_traffic_status_filter_by_set_key $status $server_name;
- 开启URL统计
vhost_traffic_status_filter on;
vhost_traffic_status_filter_by_set_key $uri uris::$server_name;
配置建议:
1.打开vhost过滤:
vhost_traffic_status_filter_by_host on;
开启此功能,在Nginx配置有多个server_name的情况下,会根据不同的server_name进行流量的统计,否则默认会把流量全部计算到第一个server_name上。
在不想统计流量的server区域禁用vhost_traffic_status,配置示例:
server {
...
vhost_traffic_status off;
...
}
2.假如nginx没有规范配置server_name或者无需进行监控的server上,那么建议在此vhost上禁用统计监控功能。否则会出现“127.0.0.1”,hostname等的域名监控信息。
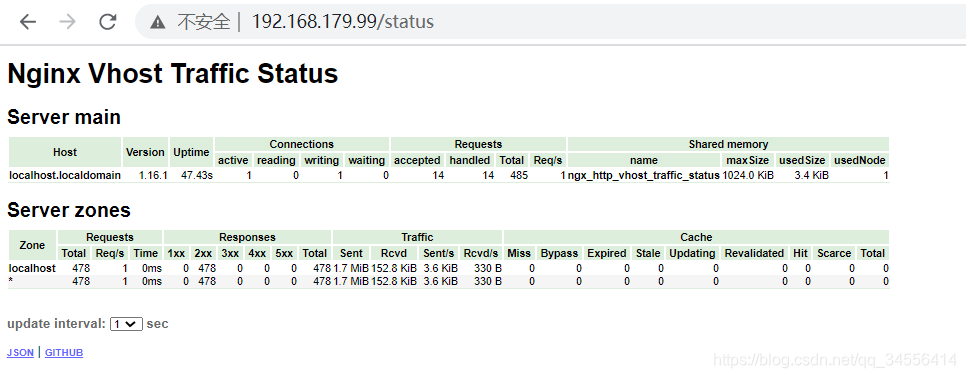
重新加载配置
/usr/local/nginx/sbin/nginx -s reload完成以上步骤可以访问:http://192.168.179.99/status
nginx-exporter安装配置(nginx-vts-exporter数据源)
下载解压
wget  https://github.com/hnlq715/nginx-vts-exporter/releases/download/v0.9.1/nginx-vts-exporter-0.9.1.linux-amd64.tar.gz
tar -zxvf nginx-vts-exporter-0.9.1.linux-amd64.tar.gz
mv nginx-vts-exporter-0.9.1.linux-amd64 /usr/local/nginx-vts-exporter
使用systemctl 管理nginx-vts-exporter进程。
vim /usr/lib/systemd/system/nginx_vts_exporter.service
[Unit]
Description=prometheus_nginx_vts
After=network.target

[Service]
Type=simple
ExecStart=/usr/local/nginx-vts-exporter/nginx-vts-exporter  -nginx.scrape_uri http://192.168.70.133/status/format/json
Restart=on-failure

[Install]
WantedBy=multi-user.target

systemctl daemon-reload
systemctl enable  nginx_vts_exporter
systemctl start  nginx_vts_exporter
systemctl status  nginx_vts_exporter

nginx-vts-exporter 抓取vts数据传向prometheus
prometheus 配置
#添加个节点

  - job_name: 'nginx'
    static_configs:
    - targets: ['192.168.179.99:9913']

[root@localhost prometheus]# ./promtool check config prometheus.yml
Checking prometheus.yml
  SUCCESS: 1 rule files found

Checking rules/node.yml
  SUCCESS: 1 rules found
**重启prometheus **
[root@localhost prometheus]# ps -ef | grep prome
root      52211      1  0 06:20 ?        00:01:37 /usr/local/prometheus/prometheus --config.file=/usr/local/prometheus/prometheus.yml

[root@localhost prometheus]# kill -HUP 52211

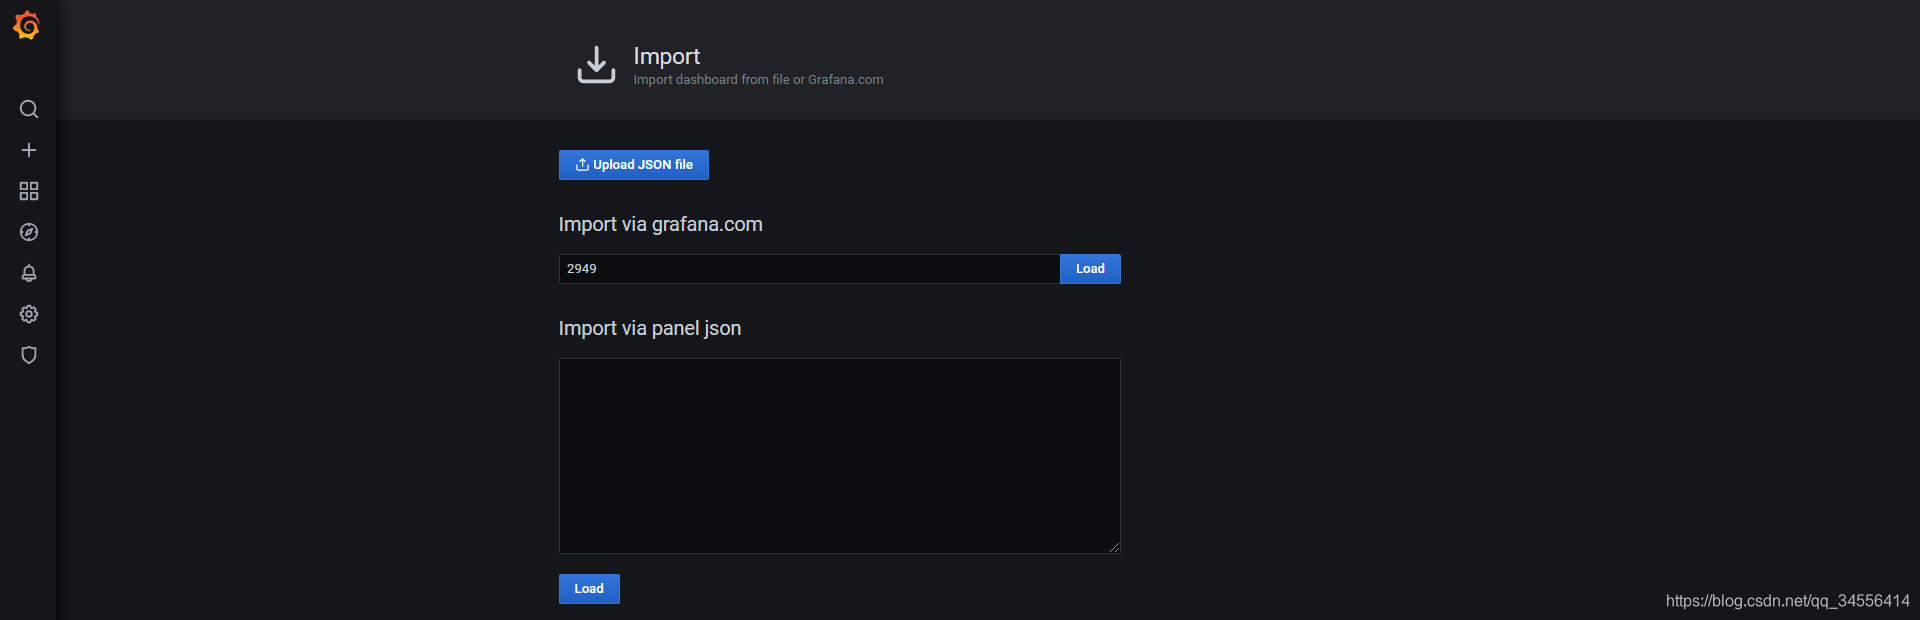
grafana展示
导入模板2949


nginx监控指标说明
指标 说明
nginx_server_requests 统计nginx各个host 各个请求的总数,精确到状态码
nginx_upstream_requests 统计各个upstream 请求总数,精确到状态码
nginx_server_connections 统计nginx几种连接状态type的连接数
nginx_server_cache 统计nginx缓存计算器,精确到每一种状态和转发type
nginx_server_bytes 统计nginx进出的字节计数可以精确到每个host,in进,out出
nginx_upstream_bytes 统计nginx各个 upstream 分组的字节总数,细分到进出
nginx_upstream_responseMsec 统计各个upstream 平均响应时长,精确到每个节点


 599
599


 被折叠的 条评论
为什么被折叠?
被折叠的 条评论
为什么被折叠?
 到【灌水乐园】发言


