


cAdvisor 对 Node 节点上的资源及容器进行实时监控和性能数据采集,包括 CPU 、内存、网络吞吐量及文件系统等。
Cadvisor exporter | Grafana Labs
容器监控的内存相关指标:
| 分类 | 指标名称 | 类型 | 含义 |
|---|---|---|---|
| CPU | container_cpu_load_average_10s | gauge | 过去 10 秒容器 CPU 的平均负载 |
| container_cpu_usage_seconds_total | counter | 容器 CPU 累计使用量 (单位:秒) | |
| container_cpu_system_seconds_total | counter | System CPU 累计占用时间(单位:秒) | |
| container_cpu_user_seconds_total | counter | User CPU 累计占用时间(单位:秒) | |
| 内存 | container_memory_max_usage_bytes | gauge | 容器的最大内存使用量(单位:字节) |
| container_memory_usage_bytes | gauge | 容器当前的内存使用量(单位:字节),包括缓存等可释放的内存 | |
| container_memory_working_set_bytes | gauge | 容器当前的内存使用量(单位:字节) | |
| container_spec_memory_limit_bytes | gauge | 容器的内存使用量限制 | |
| machine_memory_bytes | gauge | 当前主机的内存总量 | |
| 网络 | container_network_receive_bytes_total | counter | 容器网络累积接收数据总量(单位:字节) |
| container_network_receive_packets_total | counter | 容器网络累积接收数据总量(单位:包) | |
| container_network_transmit_bytes_total | counter | 容器网络累积发送数据总量(单位:字节) | |
| container_network_transmit_packets_total | counter | 容器网络累积发送数据总量(单位:包) | |
| container_network_receive_errors_total | counter | 容器网络累计接收错误总量 | |
| container_network_transmit_errors_total | counter | 容器网络累计发送错误总量 |
CPU 指标:
- container_cpu_load_average_10s:过去 10 秒容器 CPU 的平均负载 。
- container_cpu_usage_seconds_total:容器在每个 CPU 内核上的累积占用时间(单位:秒)。
- container_cpu_system_seconds_total:系统 CPU 累积占用时间(单位:秒)。
- container_cpu_user_seconds_total:用户 CPU 累积占用时间(单位:秒)。
- container_cpu_cfs_throttled_seconds_total 当容器超出其CPU限制时,Linux运行时将“限制”该容器并在container_cpu_cfs_throttled_seconds_total指标中记录其被限制的时间
内存指标:
- container_memory_max_usage_bytes:容器的最大内存使用量(单位:字节)。
- container_memory_usage_bytes:容器当前的内存使用量(单位:字节)。
- container_spec_memory_limit_bytes:容器的内存使用量限制。
- container_memory_working_set_bytes-当前工作集(以字节为单位)。简称 wss,k8s使用wss作为oom kill的依据
文件系统指标:
- container_fs_usage_bytes:容器中文件系统的使用量(单位:字节)。
- container_fs_limit_bytes:容器可以使用的文件系统总量(单位:字节)。
- container_fs_reads_bytes_total:容器累积读取数据的总量(单位:字节)。
- container_fs_writes_bytes_total:容器累积写入数据的总量(单位:字节)。
网络指标:
- container_network_receive_bytes_total:容器网络累积接收数据总量(单位:字节)。
- container_network_transmit_bytes_total:容器网络累积传输数据总量(单位:字节)。

容器组监控
内存
| 容器组内存用量 | Byte |
sum(container_memory_working_set_bytes{cluster="$clusterId",namespace="$namespace",pod=~"$pod",container!=""})by (pod)| 容器组内存使用率(占 limit) | % |
sum(container_memory_working_set_bytes{cluster="$clusterId",namespace="$namespace",pod=~"$pod",container!=""})by(pod)*100
/sum(kube_pod_container_resource_limits{cluster="$clusterId",namespace="$namespace",pod=~"$pod",container!="",resource="memory",unit="byte"})by(pod)| 容器组内存使用率(占 request) | % |
sum(container_memory_working_set_bytes{cluster="$clusterId",namespace="$namespace",pod=~"$pod",container!=""})by(pod)*100
/sum(kube_pod_container_resource_requests{cluster="$clusterId",namespace="$namespace",pod=~"$pod",container!="",resource="memory",unit="byte"})by(pod)
容器组缓存
sum(container_memory_cache{instance=~"$host",pod=~"$pod",name=~".+"}) by (namespace,pod)cpu
| 容器组 CPU 用量 | Core |
sum(rate(container_cpu_usage_seconds_total{cluster="$clusterId",namespace="$namespace",pod=~"$pod",container!=""}[1m]))by(pod)| 容器组 CPU 使用率(占 request) | % |
(sum(rate(container_cpu_usage_seconds_total{cluster="$clusterId",namespace="$namespace",pod=~"$pod",container!=""}[1m]))by(pod)/
(sum by(pod)(kube_pod_container_resource_requests{cluster="$clusterId",namespace="$namespace",resource="cpu",pod=~"$pod",container!=""}))*100| 容器组 CPU 使用率(占 limit) | % |
(sum(rate(container_cpu_usage_seconds_total{cluster="$clusterId",namespace="$namespace",pod=~"$pod",container!=""}[1m]))by(pod)/
sum(avg(kube_pod_container_resource_limits{cluster="$clusterId",namespace="$namespace",pod=~"$pod",resource="cpu",container!=""}))by(pod))*100
-------------------------------------------------------------------------------------------------------------------
当能够正常采集到cAdvisor的样本数据后,可以通过以下表达式计算容器的CPU使用率:
(1)sum(irate(container_cpu_usage_seconds_total{image!=""}[1m])) without (cpu)
容器CPU使用率
(2)container_memory_usage_bytes{image!=""}
查询容器内存使用量(单位:字节):
(3)sum(rate(container_network_receive_bytes_total{image!=""}[1m])) without (interface)
查询容器网络接收量(速率)(单位:字节/秒):
(4)sum(rate(container_network_transmit_bytes_total{image!=""}[1m])) without (interface)
容器网络传输量字节/秒
查询容器网络接收量速率(单位:字节/秒):
sum(rate(container_network_receive_bytes_total{image!=""}[1m])) without (interface)
容器网络接收量 字节/秒
查询容器网络传输量速率(单位:字节/秒):

容器网络传输量 字节/秒
(5)sum(rate(container_fs_reads_bytes_total{image!=""}[1m])) without (device)
容器文件系统读取速率字节/秒
(6)sum(rate(container_fs_writes_bytes_total{image!=""}[1m])) without (device)
容器文件系统写入速率字节/秒
查询容器文件系统读取速率(单位:字节/秒):
sum(rate(container_fs_reads_bytes_total{image!=""}[1m])) without (device)
容器文件系统读取速率 字节/秒
查询容器文件系统写入速率(单位:字节/秒):
sum(rate(container_fs_writes_bytes_total{image!=""}[1m])) without (device)
容器文件系统写入速率 字节/秒
cadvisor 常用容器监控指标
网络流量
sum(rate(container_network_receive_bytes_total{name=~".+"}[1m])) by (name)
##容器网络接收的字节数(1分钟内),根据名称查询 name=~".+"
sum(rate(container_network_transmit_bytes_total{name=~".+"}[1m])) by (name)
##容器网络传输的字节数(1分钟内),根据名称查询 name=~".+"
容器 CPU相关
sum(rate(container_cpu_system_seconds_total[1m]))
###所用容器system cpu的累计使用时间(1min钟内)
sum(irate(container_cpu_system_seconds_total{image!=""}[1m])) without (cpu)
###每个容器system cpu的使用时间(1min钟内)
sum(rate(container_cpu_usage_seconds_total{name=~".+"}[1m])) by (name) * 100
#每个容器的cpu使用率
sum(sum(rate(container_cpu_usage_seconds_total{name=~".+"}[1m])) by (name) * 100)
#总容器的cpu使用率
参数解释
使用Prometheus配置kubernetes环境中Container的CPU使用率时,会经常遇到CPU使用超出100%,下面就来解释一下
-
container_spec_cpu_period
当对容器进行CPU限制时,CFS调度的时间窗口,又称容器CPU的时钟周期通常是100,000微秒
-
container_spec_cpu_quota container_spec_cpu_quota/container_spec_cpu_period(100000)= pod cpu limit
是指容器的使用CPU时间周期总量,如果quota设置的是700,000,就代表该容器可用的CPU时间是7*100,000微秒,通常对应kubernetes的resource.cpu.limits的值
-
container_spec_cpu_share
是指container使用分配主机CPU相对值,比如share设置的是500m,代表窗口启动时向主机节点申请0.5个CPU,也就是50,000微秒,通常对应kubernetes的resource.cpu.requests的值
-
container_cpu_usage_seconds_total
统计容器的CPU在一秒内消耗使用率,应注意的是该container所有的CORE
-
container_cpu_system_seconds_total
统计容器内核态在一秒时间内消耗的CPU
-
container_cpu_user_seconds_total
统计容器用户态在一秒时间内消耗的CPU参考官方地址
https://docs.signalfx.com/en/latest/integrations/agent/monitors/cadvisor.html
https://github.com/google/cadvisor/blob/master/docs/storage/prometheus.md
具体公式
-
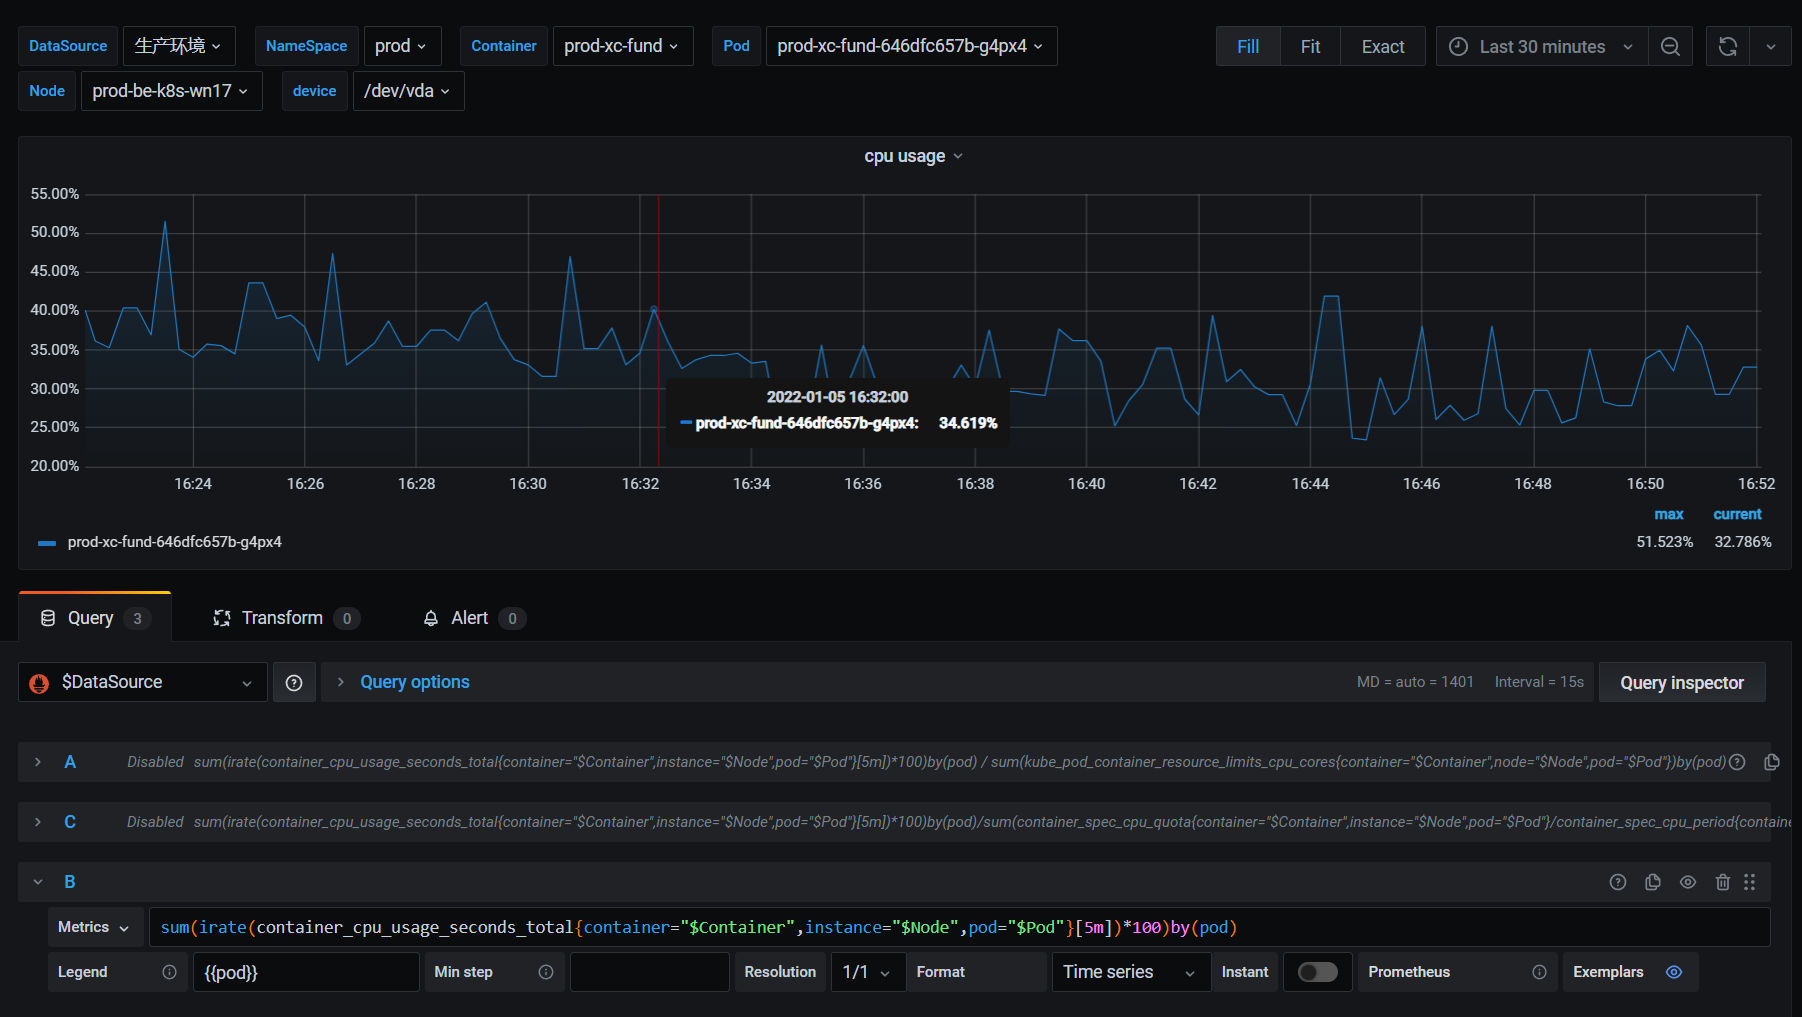
默认如果直接使用container_cpu_usage_seconds_total的话,如下
sum(irate(container_cpu_usage_seconds_total{container="$Container",instance="$Node",pod="$Pod"}[5m])*100)by(pod)
默认统计的数据是该容器所有的CORE的平均使用率
-
如果要精确计算每个容器的CPU使用率,使用%呈现的形式,如下:
复杂写法:
sum(irate(container_cpu_usage_seconds_total{container="$Container",instance="$Node",pod="$Pod"}[5m])*100)by(pod)

/

sum(container_spec_cpu_quota{container="$Container",instance="$Node",pod="$Pod"}
/container_spec_cpu_period{container="$Container",instance="$Node",pod="$Pod"})by(pod)


更加简洁写法:
sum(irate(container_cpu_usage_seconds_total{container="$Container",instance="$Node",pod="$Pod"}[5m])*100)by(pod)

/

sum(container_spec_cpu_quota{container="$Container",instance="$Node",pod="$Pod"}
/100000
其中container_spec_cpu_quota/container_spec_cpu_period,就代表该容器有多少个CORE

- 参考官方git issue
https://github.com/google/cadvisor/issues/2026#issuecomment-415819667


 6万+
6万+

 被折叠的 条评论
为什么被折叠?
被折叠的 条评论
为什么被折叠?
 到【灌水乐园】发言


