


通过pprof可以查看go程序内存占用情况
在程序中添加一行代码即可启动服务:
import _ "net/http/pprof"

func main() {

  http.ListenAndServe("0.0.0.0:6060", nil) // 启动服务
}
先启动程序:
go run .\main.go
使用方法
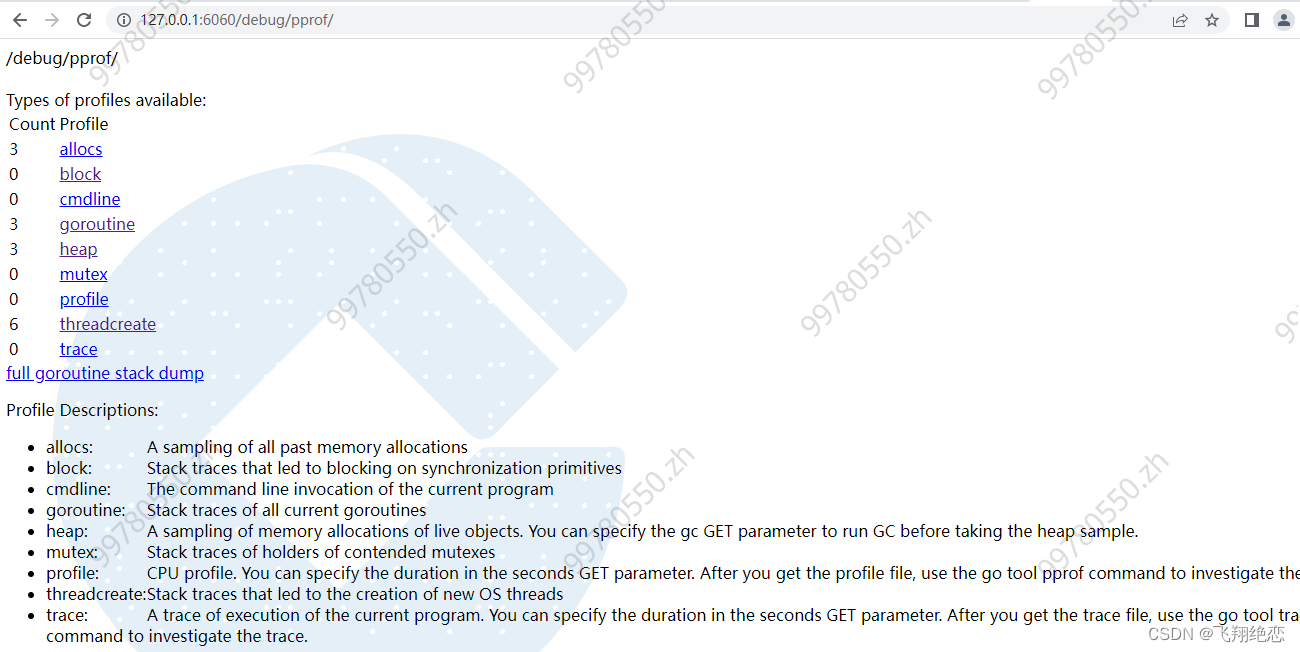
第一种:使用浏览器访问:http://127.0.0.1:6060/debug/pprof/
第二种:go tool pprof
1)查看堆内存使用
在控制台输入:
PS E:\go\src\test> go tool pprof http://127.0.0.1:6060/debug/pprof/heap
Fetching profile over HTTP from http://127.0.0.1:6060/debug/pprof/heap
Saved profile in C:\Users\Administrator\pprof\pprof.alloc_objects.alloc_space.inuse_objects.inuse_space.010.pb.gz
Type: inuse_space
Time: Nov 9, 2022 at 10:42am (CST)
Entering interactive mode (type "help" for commands, "o" for options)
(pprof) top
Showing nodes accounting for 512.17kB, 100% of 512.17kB total
      flat  flat%   sum%        cum   cum
最低0.47元/天 解锁文章


 561
561


 被折叠的 条评论
为什么被折叠?
被折叠的 条评论
为什么被折叠?
 到【灌水乐园】发言


