


1:geoserver 下载wps插件

将下载后的 geoserver-2.15.1-vectortiles-plugin.zip 解压到 GeoServer 2.15.1\webapps\geoserver\WEB-INF\lib 目录下。
2:编辑sld文件
   <?xml version="1.0" encoding="ISO-8859-1"?>
   <StyledLayerDescriptor version="1.0.0"
       xsi:schemaLocation="http://www.opengis.net/sld StyledLayerDescriptor.xsd"
       xmlns="http://www.opengis.net/sld"
       xmlns:ogc="http://www.opengis.net/ogc"
       xmlns:xlink="http://www.w3.org/1999/xlink"
       xmlns:xsi="http://www.w3.org/2001/XMLSchema-instance">
     <NamedLayer>
       <Name>Heatmap</Name>
       <UserStyle>
         <Title>Heatmap</Title>
         <Abstract>A heatmap surface showing population density</Abstract>
         <FeatureTypeStyle>
           <Transformation>
             <ogc:Function name="vec:Heatmap">
               <ogc:Function name="parameter">
                 <ogc:Literal>data</ogc:Literal>
               </ogc:Function>
               <ogc:Function name="parameter">
                 <ogc:Literal>weightAttr</ogc:Literal>
                 <ogc:Literal>AREA</ogc:Literal>
               </ogc:Function>
               <ogc:Function name="parameter">
                 <ogc:Literal>radiusPixels</ogc:Literal>
                 <ogc:Function name="env">
                   <ogc:Literal>radius</ogc:Literal>
                   <ogc:Literal>100</ogc:Literal>
                 </ogc:Function>
               </ogc:Function>
               <ogc:Function name="parameter">
                 <ogc:Literal>pixelsPerCell</ogc:Literal>
                 <ogc:Literal>10</ogc:Literal>
               </ogc:Function>
               <ogc:Function name="parameter">
                 <ogc:Literal>outputBBOX</ogc:Literal>
                 <ogc:Function name="env">
                   <ogc:Literal>wms_bbox</ogc:Literal>
                 </ogc:Function>
               </ogc:Function>
               <ogc:Function name="parameter">
                 <ogc:Literal>outputWidth</ogc:Literal>
                 <ogc:Function name="env">
                   <ogc:Literal>wms_width</ogc:Literal>
                 </ogc:Function>
               </ogc:Function>
               <ogc:Function name="parameter">
                 <ogc:Literal>outputHeight</ogc:Literal>
                 <ogc:Function name="env">
                   <ogc:Literal>wms_height</ogc:Literal>
                 </ogc:Function>
               </ogc:Function>
             </ogc:Function>
           </Transformation>
          <Rule>
            <RasterSymbolizer>
            <!-- specify geometry attribute to pass validation -->
              <Geometry>
                <ogc:PropertyName>the_geom</ogc:PropertyName></Geometry>
              <Opacity>0.6</Opacity>
              <ColorMap type="ramp" >
                <ColorMapEntry color="#FFFFFF" quantity="0" label="nodata"
                  opacity="0"/>
                <ColorMapEntry color="#FFFFFF" quantity="0.02" label="nodata"
                  opacity="0"/>
                <ColorMapEntry color="#4444FF" quantity=".1" label="nodata"/>
                <ColorMapEntry color="#FF0000" quantity=".5" label="values" />
                <ColorMapEntry color="#FFFF00" quantity="1.0" label="values" />
              </ColorMap>
            </RasterSymbolizer>
           </Rule>
         </FeatureTypeStyle>
       </UserStyle>
     </NamedLayer>
    </StyledLayerDescriptor>
weightAttr为权重字段,需将AREA修改为自己数据中对应的权重字段名称。
3:geoserver添加style
geoserver中点击 styles -> add a new style
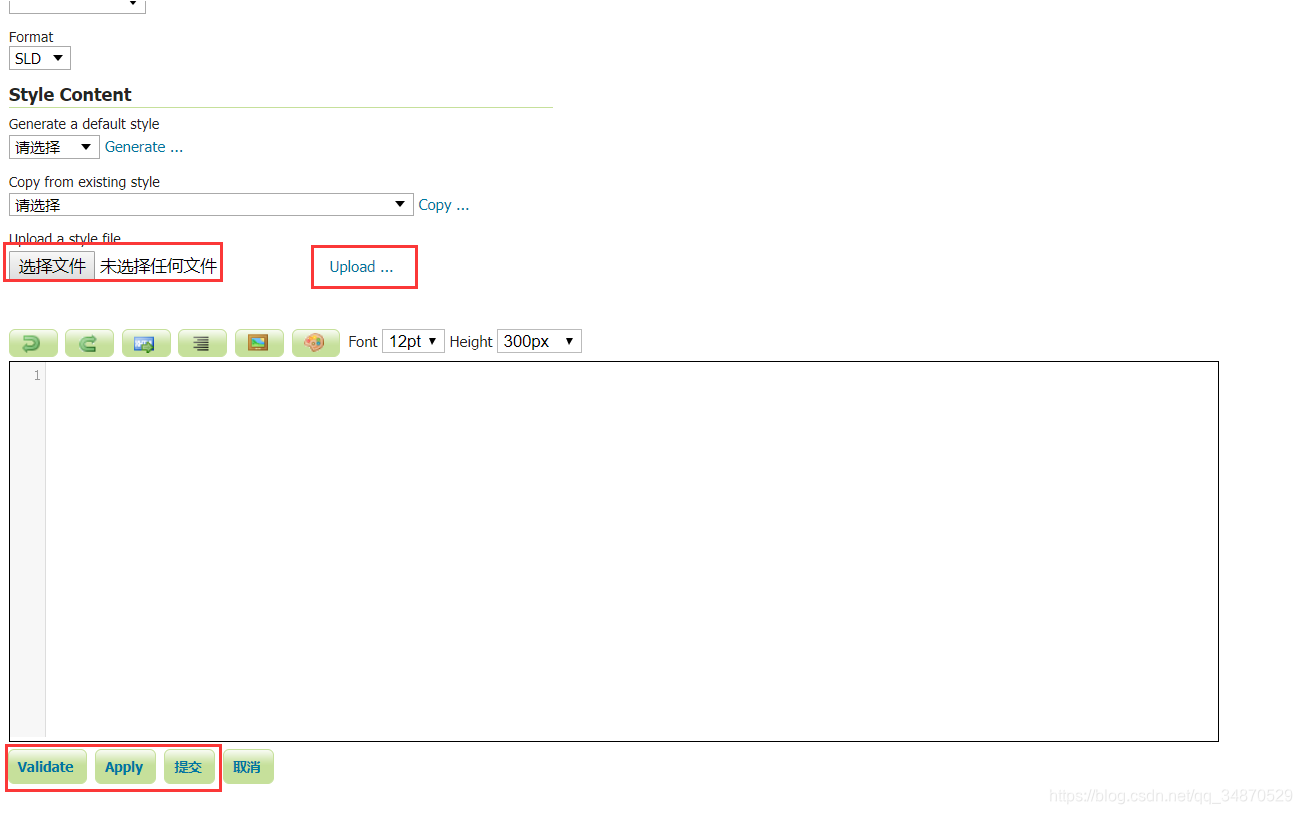
点击选择文件选择刚才编辑的sld文件,点击Upload,然后点击Validate,若没有报错点击apply-提交则style添加成功。
4:geoserver发布热力图wms
数据:
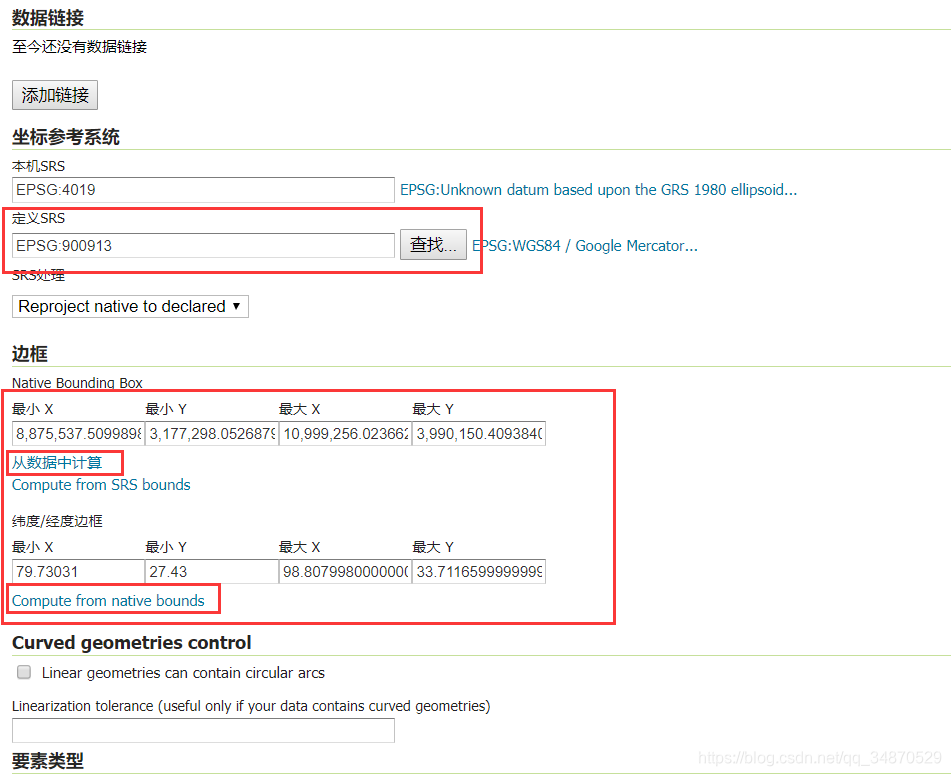
发布:
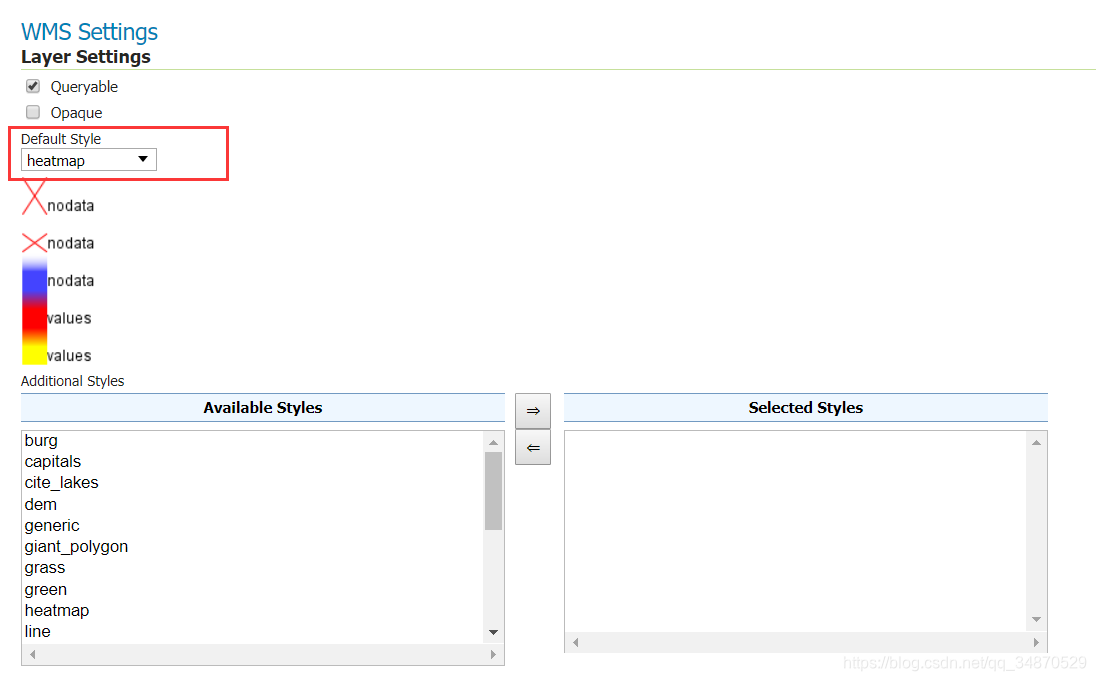
default style中选择前边添加的style,保存后图层发布完毕!
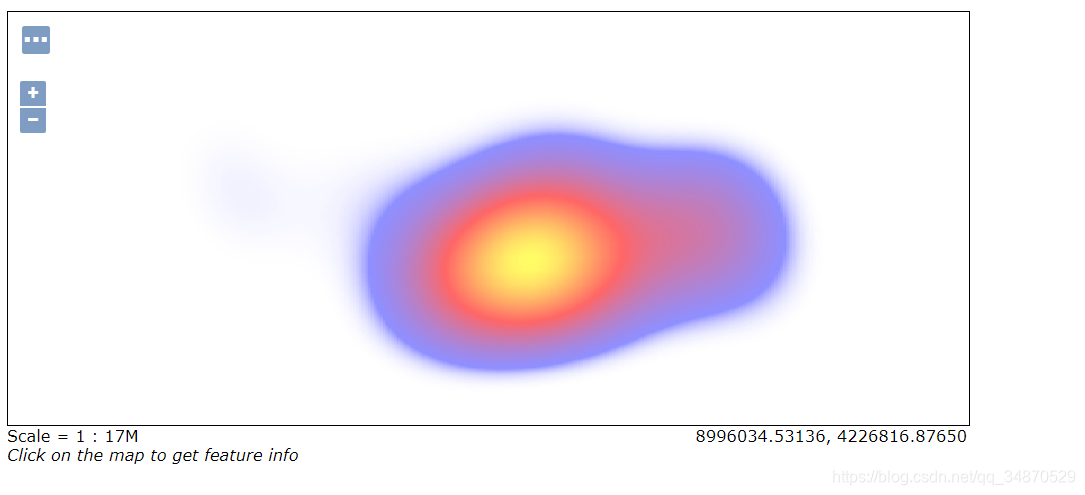
5:查看发布后的热力图
点击 layer Preview,选择刚才发布的图层
6:openlayers 添加上边发布的热力图
1: index.html
<!DOCTYPE html>
<html lang="en">

<head>
    <title>Image ArcGIS MapServer</title>
    <!-- The line below is only needed for old environments like Internet Explorer and Android 4.x -->
    <script
        src="https://cdn.polyfill.io/v2/polyfill.min.js?features=fetch,requestAnimationFrame,Element.prototype.classList,URL">
    </script>
    <style>
        .map {
            width: 100%;
            height: 400px;
        }
    </style>
</head>

<body>
    <div id="map" class="map"></div>
    <script src="index.js"></script>
</body>

</html>
2: index.js
import 'ol/ol.css';
import Map from 'ol/Map';
import View from 'ol/View';
import ImageLayer from 'ol/layer/Image';
import TileLayer from 'ol/layer/Tile';
import ImageWMS from 'ol/source/ImageWMS';
import OSM from 'ol/source/OSM';

var wmsSource = new ImageWMS({
  url: 'http://172.29.143.3:8080/geoserver/heatmap/wms',
  params: {
    'LAYERS':'heatmap:HOSPITAL',
  },
  serverType: 'geoserver',
  crossOrigin: 'anonymous'
});

var wmsLayer = new ImageLayer({
  source: wmsSource
});


var view = new View({
  center: [0, 0],
  zoom: 1
});

var map = new Map({
  layers: [
    new TileLayer({
      preload: 4,
      source: new OSM()
    })
  ],
  target: 'map',
  view: view
});

// 添加geoserver发布的热力图
map.addLayer(wmsLayer);
3: package.json
命令执行:
cnpm install
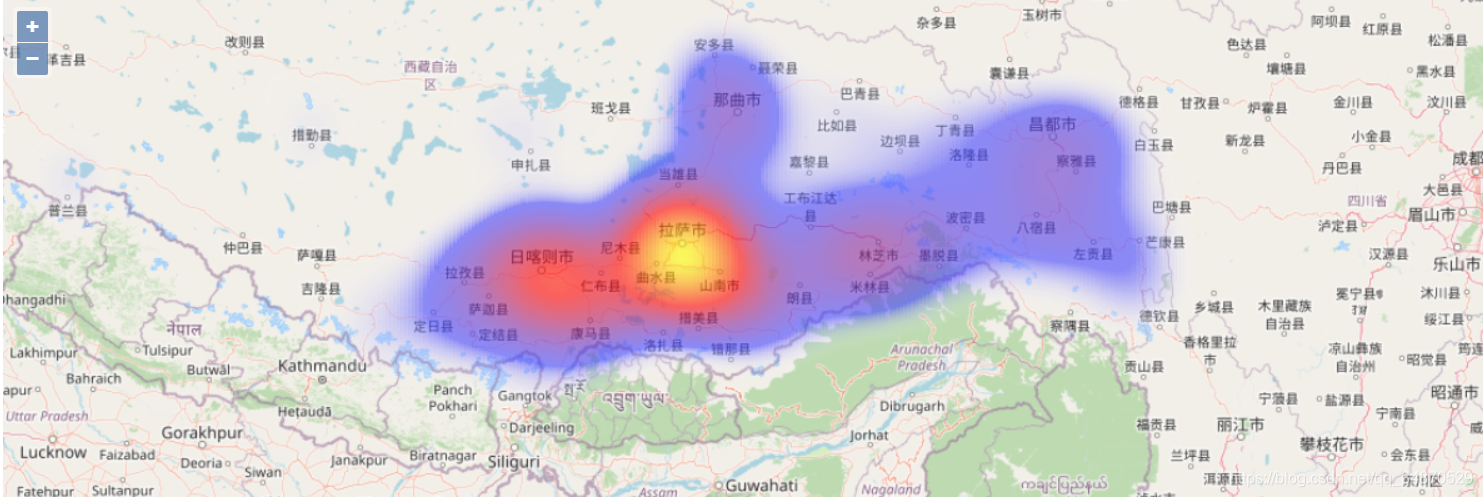
npm run dev7:效果展示


 347
347

 被折叠的 条评论
为什么被折叠?
被折叠的 条评论
为什么被折叠?
 到【灌水乐园】发言


