import matplotlib.pyplot as plt
import numpy as np
# Create a figure and an axis
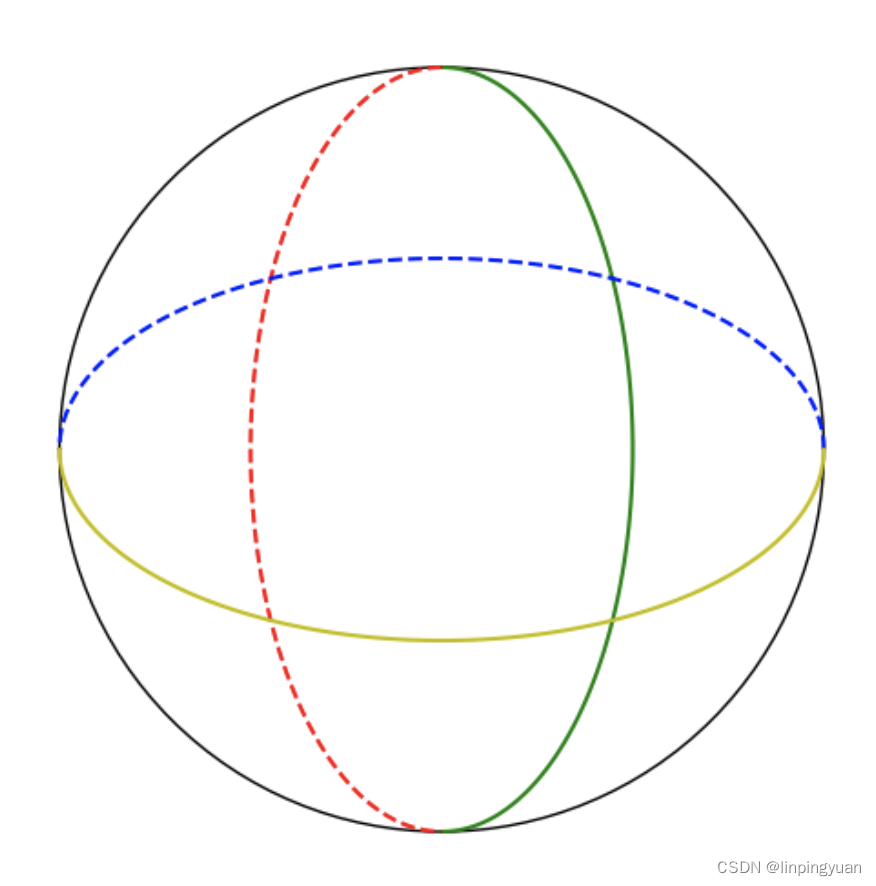
fig, ax = plt.subplots(figsize=(6,6))# Draw the circle (sphere)
circle = plt.Circle((0,0),1, fill=False, color='black')
ax.add_artist(circle)# Draw longitude lines# First longitude line
theta1 = np.linspace(0, np.pi,100)
x2 =0.5* np.sin(theta1)
y2 = np.cos(theta1)
ax.plot(x2, y2,'g')# Second longitude line
x3 =-0.5* np.sin(theta1)
y3 = np.cos(theta1)
ax.plot(x3, y3,'r--')## Draw altitude lines# First latitude line
theta2 = np.linspace(0, np.pi,100)
x4 = np.cos(theta1)
y4 =0.5* np.sin(theta1)
ax.plot(x4, y4,'b--')# Second latitude line
x5 = np.cos(theta1)
y5 =-0.5* np.sin(theta1)
ax.plot(x5, y5,'y')# Set the aspect of the plot to be equal
ax.set_aspect('equal')# Remove the axes
ax.axis('off')
svg_filename ="./sphere_with_axes_and_outside_circle.svg"
fig.savefig(svg_filename,format='svg')# Show the plot
plt.show()


 1522
1522

 被折叠的 条评论
为什么被折叠?
被折叠的 条评论
为什么被折叠?
 到【灌水乐园】发言


