


from skimage import io
import numpy as np
import matplotlib.pyplot as plt
from skimage import measure, color
if __name__ == '__main__':
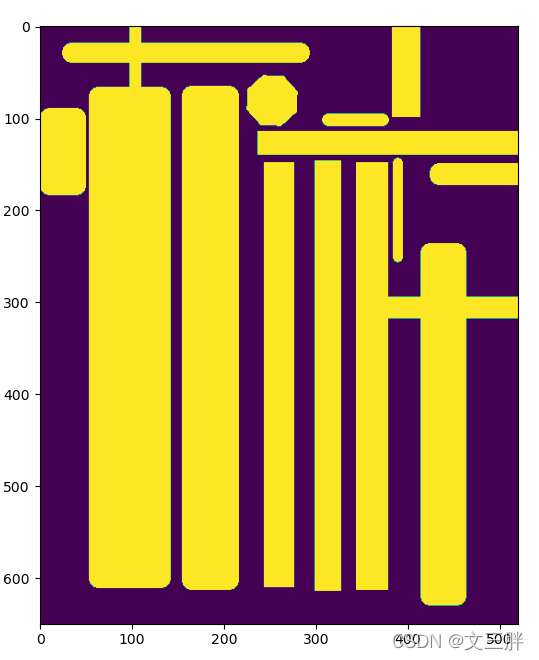
gt = io.imread('85484.png')
gt = 1* (gt > 0)
plt.figure(figsize=(10, 10))
plt.imshow(gt)
plt.show()
# 【1】计算细胞和背景的像素频率
c_weights = np.zeros(2)
c_weights[0] = 1.0 / ((gt == 0).sum())
c_weights[1] = 1.0 / ((gt == 1).sum())
# 【2】归一化
c_weights /= c_weights.max()
# 【3】得到 class_weight map(cw_map)
cw_map = np.where(gt == 0, c_weights[0], c_weights[1])
plt.figure(figsize=(10, 10))
plt.imshow(cw_map)
plt.show()
# 【4】连通域分析,并彩色化
cells = measure.label(gt, connectivity=2)
cells_color = color.label2rgb(cells, bg_label=0, bg_color=(255, 255, 255))
plt.figure(figsize=(10, 10))
plt.imshow(cells_color)
# plt.imshow(cells)
plt.show()
import cv2
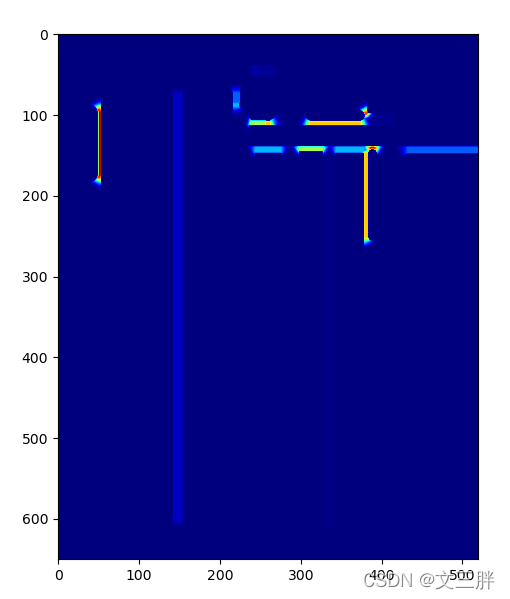
# 【5】计算得到 distance weight map (dw_map)
w0 = 10
sigma = 5
dw_map = np.zeros_like(gt)
maps = np.zeros((gt.shape[0], gt.shape[1], cells.max()))
if cells.max() >= 2:
for i in range(1, cells.max() + 1):
maps[:, :, i - 1] = cv2.distanceTransform(1 - (cells == i).astype(np.uint8), cv2.DIST_L2, 3)
maps = np.sort(maps, axis=2)
d1 = maps[:, :, 0]
d2 = maps[:, :, 1]
dis = ((d1 + d2) ** 2) / (2 * sigma * sigma)
dw_map = w0 * np.exp(-dis) * (cells == 0)
# dw_map=dw_map+cells
plt.figure(figsize=(10, 10))
plt.imshow(dw_map, cmap='jet')


 2991
2991


 被折叠的 条评论
为什么被折叠?
被折叠的 条评论
为什么被折叠?
 到【灌水乐园】发言


