


#%matplotlib notebook
import matplotlib.pyplot as plt #载入绘图库
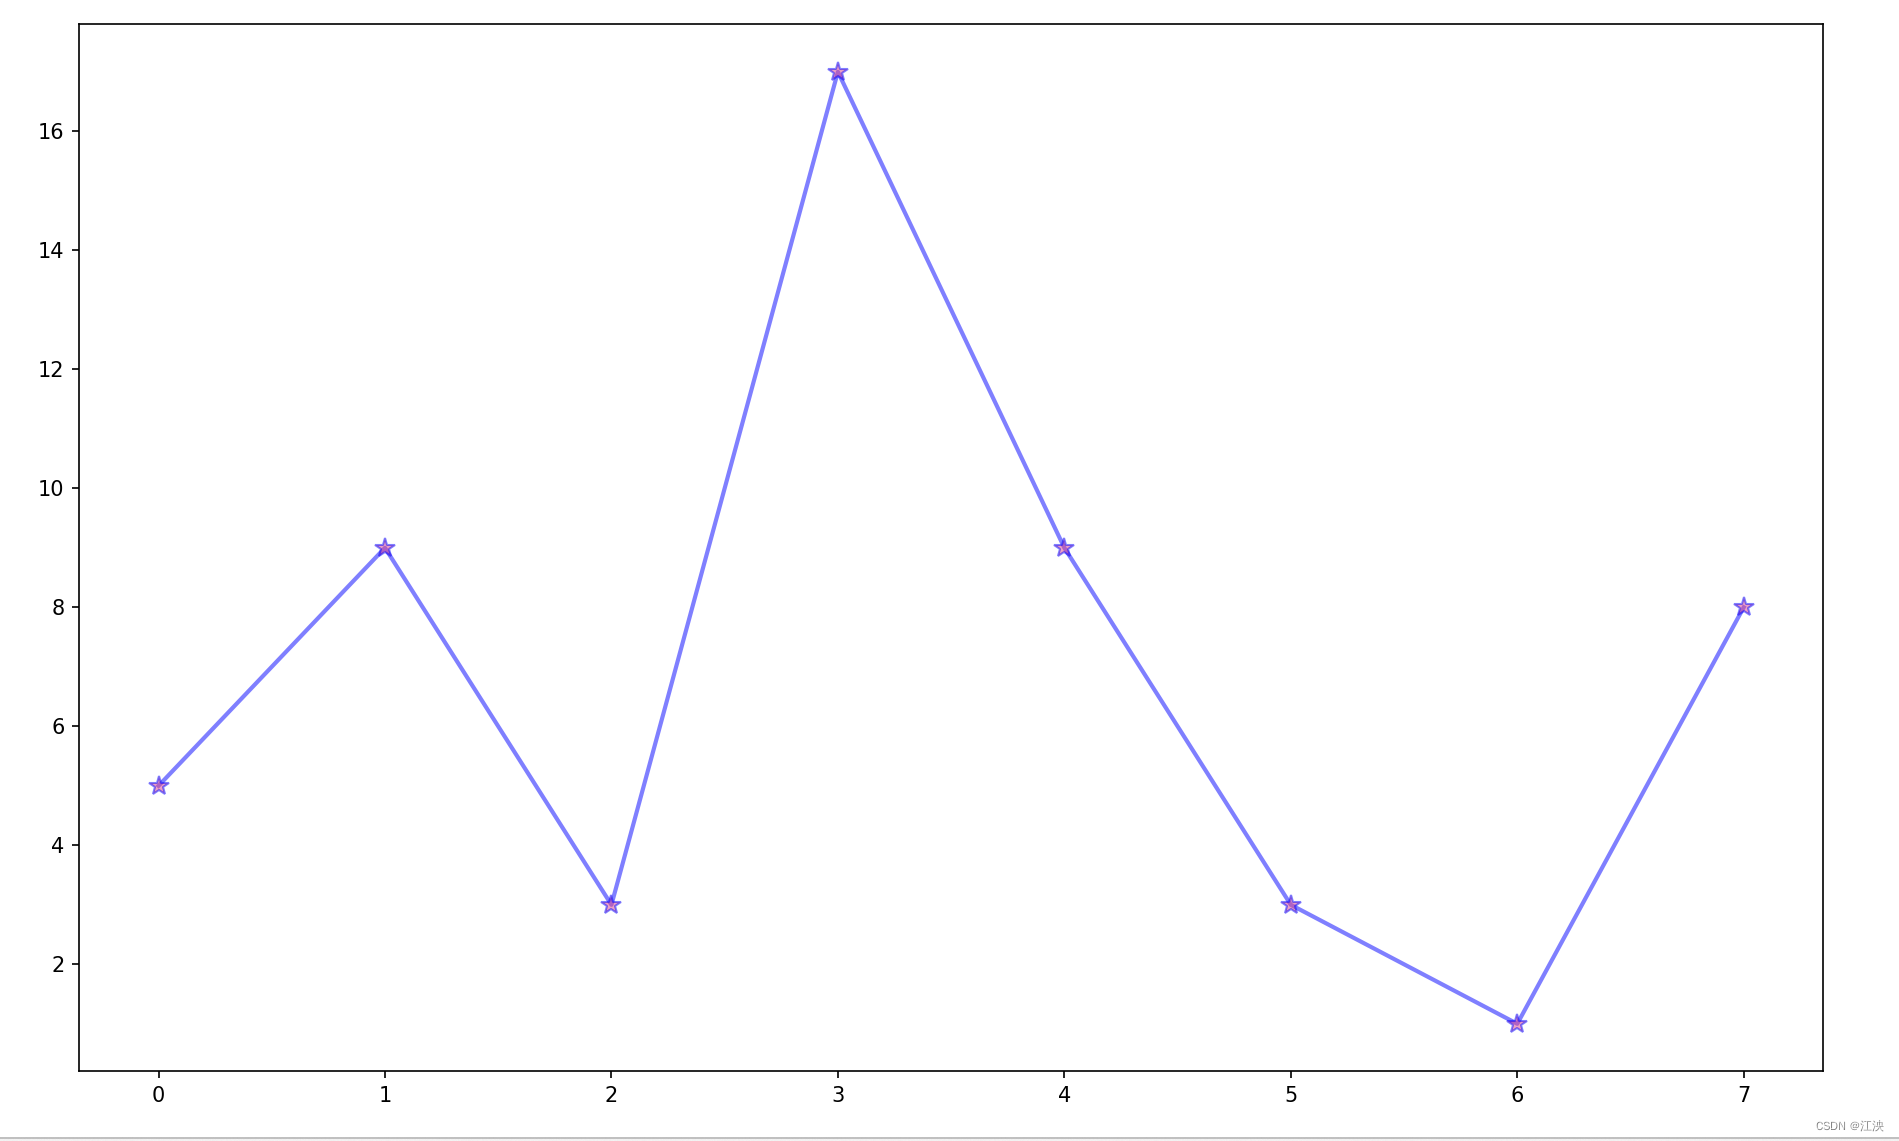
a=[5,9,3,17,9,3,1,8]
b=[9,3,8,16,3,8,9,1]
c=[9,3,15,9,1,3,9,1]
plt.figure(figsize=(15,10))
plt.plot(
a,
#线条样式
color = 'blue',
linestyle = '-',
linewidth=2,
#标记样式
marker='*',
markerfacecolor='#df448b',
markersize=10,
alpha =0.5 #透明度
)
plt.show()
我们可以继续深入改进一下,例如变换一下形式同时增加一条的数据
import matplotlib.pyplot as plt

plt.rcParams["font.family"] = "KaiTi"
x = ["A", "B", "C", "D", "E", "F", "G"]
highest = [12, 15, 18, 14, 16, 14, 10]
lowest = [6, 4, 8, 12, 10, 9, 7]
plt.ylim(0, 25)
plt.plot(x, highest, "rs--")
plt.plot(x, lowest, "rd--")
for a, b in zip(x, highest):
    plt.text(a, b+1, b, ha='center', va='bottom')
    # 数据显示的横坐标、显示的位置高度、显示的数据值的大小
for a, b in zip(x, lowest):
    plt.text(a, b-2, b, ha='center', va='bottom')
plt.legend()
plt.show()
运行结果如图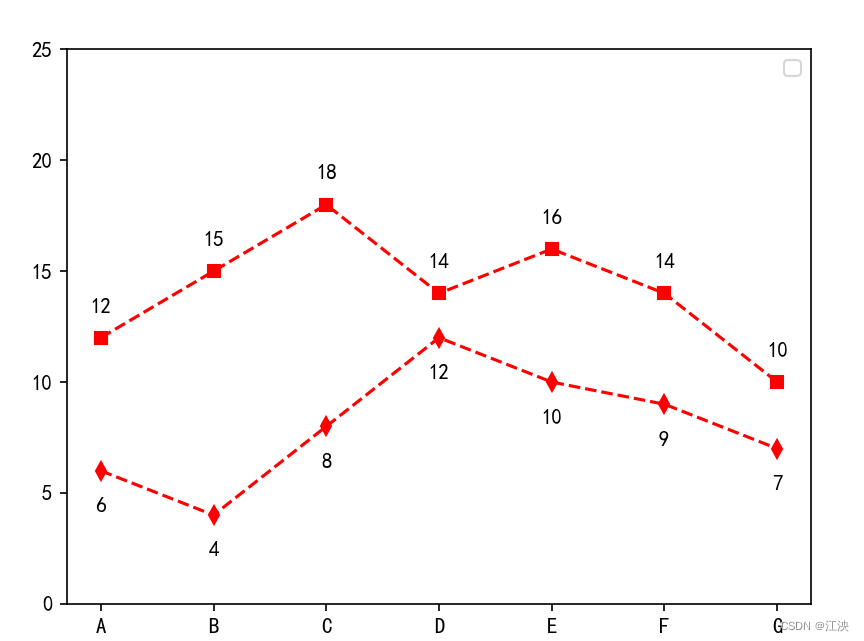


 4109
4109

 被折叠的 条评论
为什么被折叠?
被折叠的 条评论
为什么被折叠?
 到【灌水乐园】发言


