


XDebug使用总结:
Xdebug是一个开源的PHP程序调试工具,可以使用它来调试、跟踪及分析程序运行状态。
1.首先下载相应的php_xdebug.dll,下载地址:
http://www.xdebug.org/download.php2.将相应的扩展放在php/ext目录中:
3.编辑php.ini文件,加入下面信息:
[Xdebug]
zend_extension=E:\web\php\ext\php_xdebug-2.4.1-5.5-vc11-x86_64.dll   (Win)
xdebug.profiler_enable=on
xdebug.remote_enable = On
xdebug.remote_handler = dbgp
xdebug.remote_host= localhost
xdebug.remote_port = 9000
xdebug.idekey = PHPSTORM
xdebug.trace_output_dir="../Projects/xdebug"
xdebug.profiler_output_dir="../Projects/xdebug"
安装成功如下:
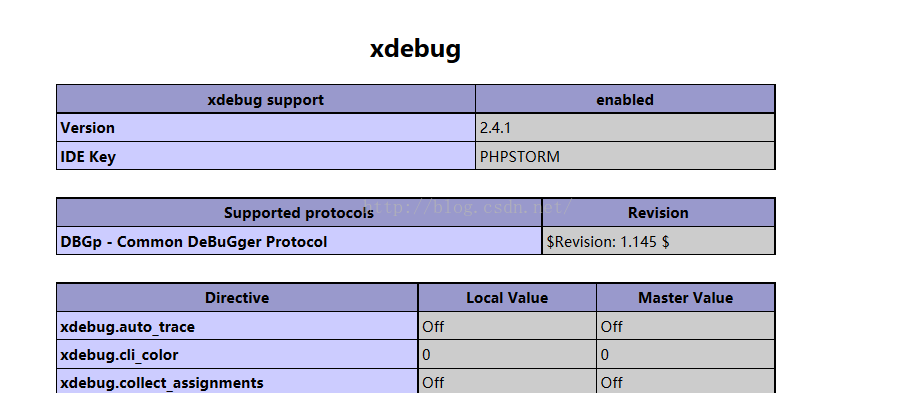
参数参考设置:
xdebug.default_enable=on
;显示默认的错误信息
xdebug.auto_trace=on
;自动打开“监测函数调用过程”的功模。该功能可以在你指定的目录中将函数调用的监测信息以文件的形式输出。此配置项的默认值为off。
xdebug.collect_params=on
;打开收集“函数参数”的功能。将函数调用的参数值列入函数过程调用的监测信息中。此配置项的默认值为off。
xdebug.collect_return=on
;打开收集“函数返回值”的功能。将函数的返回值列入函数过程调用的监测信息中。此配置项的默认值为off。
xdebug.max_nesting_level=100
xdebug.profiler_enable=on
;打开效能监测器。
xdebug.remote_enable=on
;是否调试
xdebug.remote_host=localhost
xdebug.remote_port=9000
;调试端口
xdebug.remote_handler=dbgp
;选择协议
xdebug.trace_output_dir="d:\Temp"
;设定函数调用监测信息的输出文件的路径。
xdebug.profiler_output_dir="d:\Temp"
;设定效能监测信息输出文件的路径。
下面说演示PHPstorm设置xdebug:
1)首先打开设置搜索xdebug:
确认Debug port 的值与php.ini中的xdebug.remote_port的值相等:
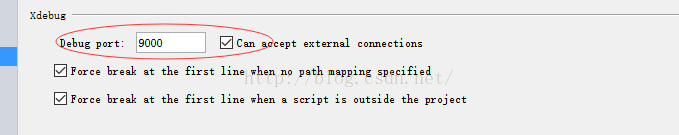
2)设置debug:
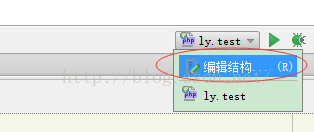
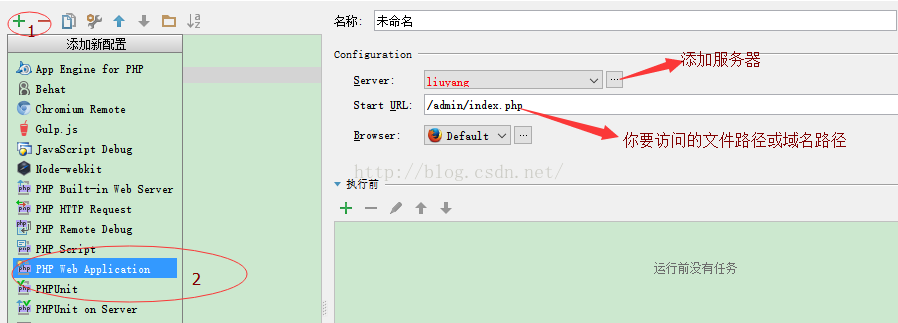
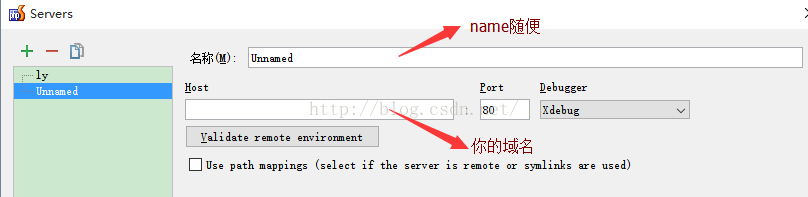
最后应用确认,使用案例:
在一个文件中写代码,包含一个不存在的文件如下,在设置断点:
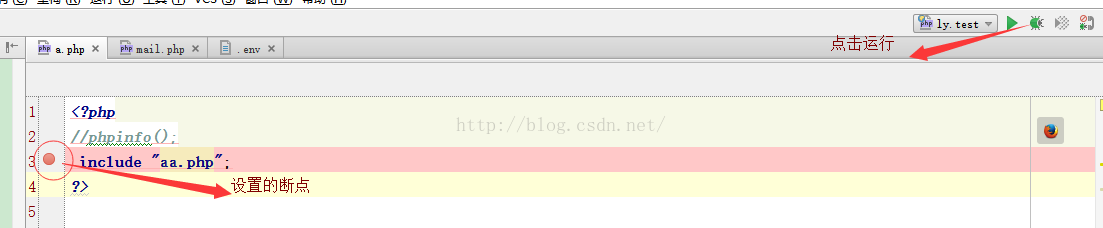
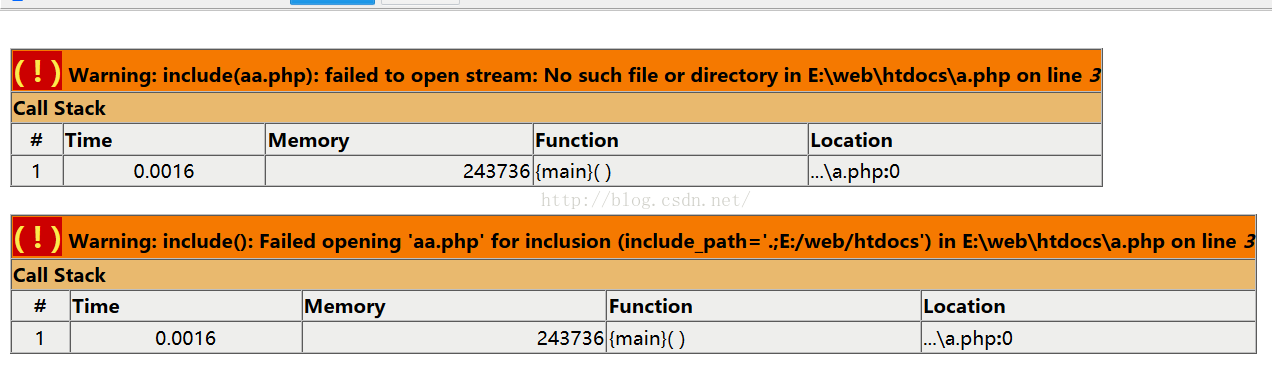
运行后的结果如下:


 159
159


 被折叠的 条评论
为什么被折叠?
被折叠的 条评论
为什么被折叠?
 到【灌水乐园】发言


