


在做分类任务的时候,经常需要查看分类模型的混淆矩阵,记录一下绘制混淆矩阵常用的一些设置
一般混淆矩阵绘制的代码是如下
matrix = np.random.randn(5, 5)
fig = plt.figure()
sns_plot = sns.heatmap(matrix2, annot=True)
plt.show()
效果如下图所示

想要更大的图片可以在plt.figure()中添加设置
matrix2 = np.random.randn(5, 5)
fig = plt.figure(figsize=(8, 8), dpi=100)
sns_plot = sns.heatmap(matrix2, annot=True)

plt.show()
对于位数太长的数组索引,heatmap可能会折叠为科学计数法
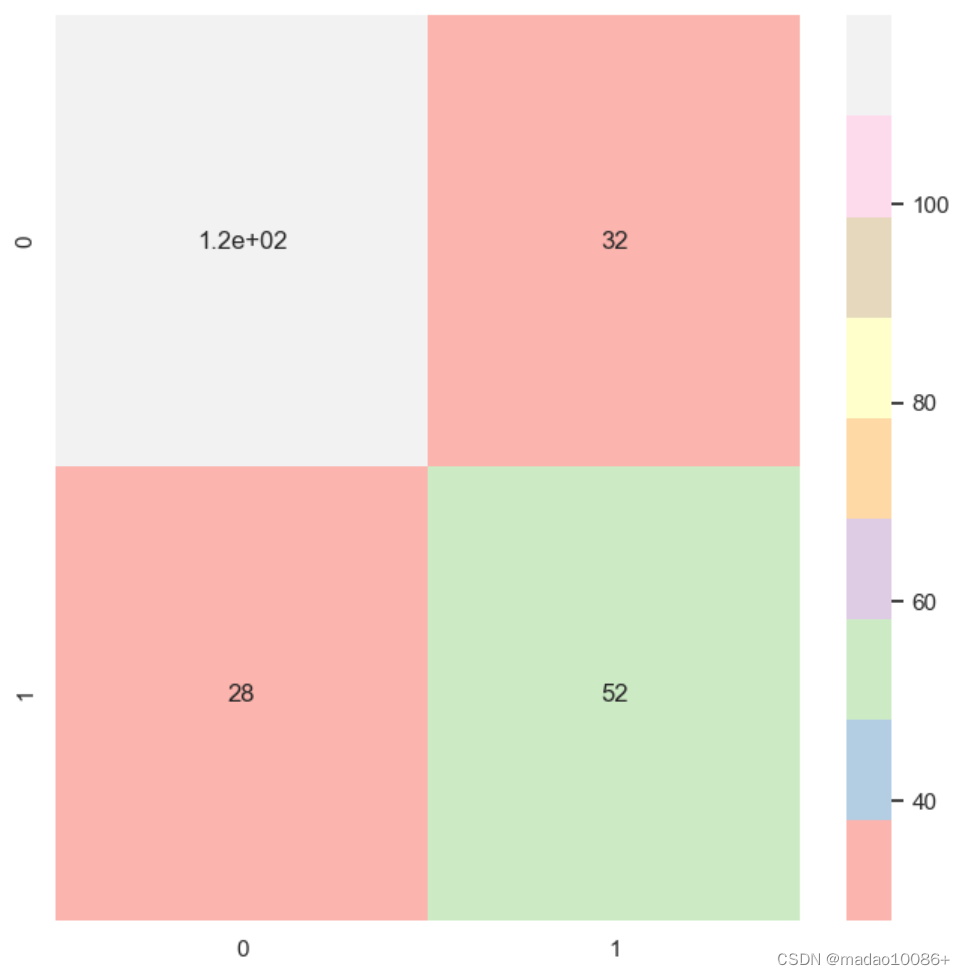
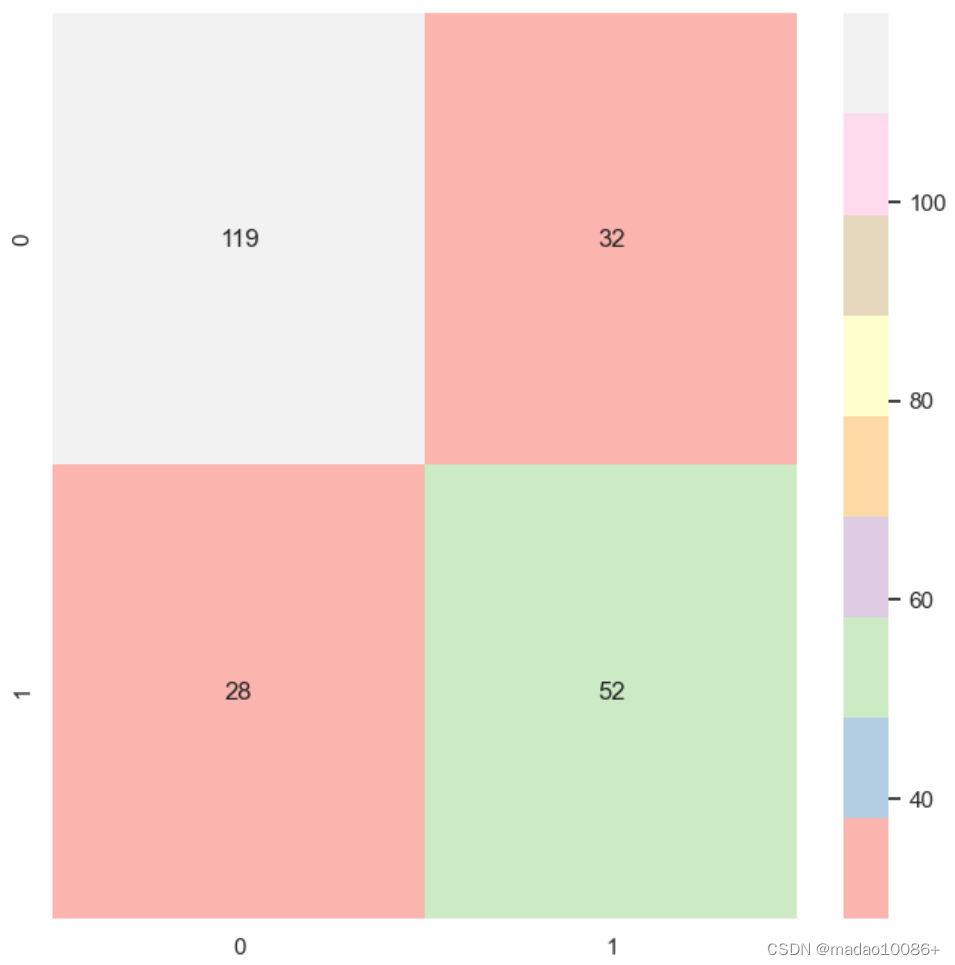
在heatmap中添加一个属性fmt可以去除科学计数显示的方式
sns_plot = sns.heatmap(matrix, annot=True, fmt='.20g', cmap='Pastel1')
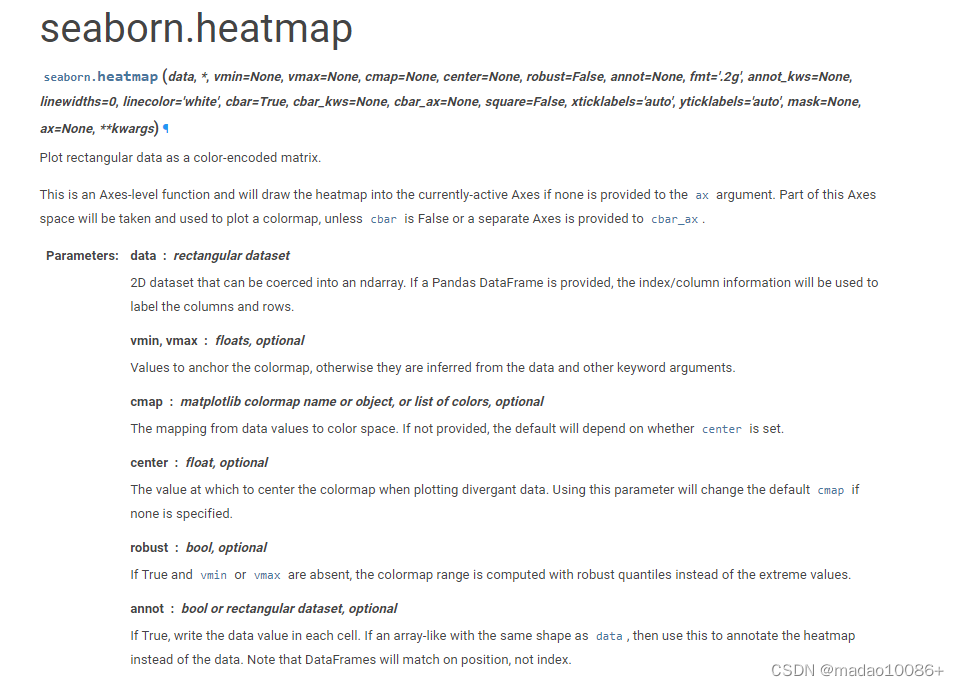
关于绘制热力图混淆矩阵的其他详细设置可以参考seaborn.heatmap


 184
184


 被折叠的 条评论
为什么被折叠?
被折叠的 条评论
为什么被折叠?
 到【灌水乐园】发言


