


Matlab画图代码
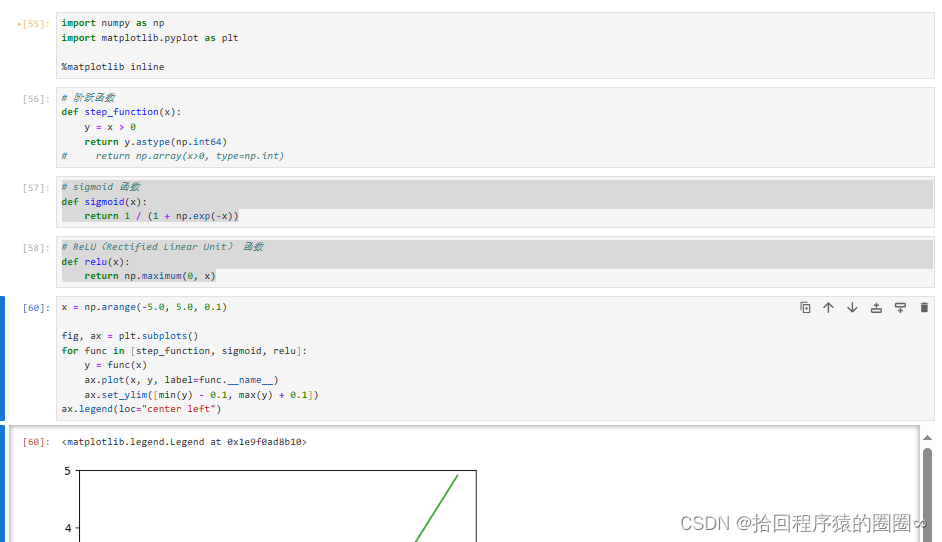
import numpy as np
import matplotlib.pyplot as plt
%matplotlib inline# 阶跃函数
def step_function(x):
y = x > 0
return y.astype(np.int64)
# sigmoid 函数
def sigmoid(x):
return 1 / (1 + np.exp(-x))# ReLU(Rectified Linear Unit) 函数
def relu(x):
return np.maximum(0, x)x = np.arange(-5.0, 5.0, 0.1)
fig, ax = plt.subplots()
for func in [step_function, sigmoid, relu]:
y = func(x)
ax.plot(x, y, label=func.__name__)
ax.set_ylim([min(y) - 0.1, max(y) + 0.1])
ax.legend(loc="center left")
代码运行


 1万+
1万+

 被折叠的 条评论
为什么被折叠?
被折叠的 条评论
为什么被折叠?
 到【灌水乐园】发言


