


Table API实现实时报表(Real Time Reporting with the Table API)
Apache Flink offers a Table API as a unified, relational API for batch and stream processing, i.e., queries are executed with the same semantics on unbounded, real-time streams or bounded, batch data sets and produce the same results. The Table API in Flink is commonly used to ease the definition of data analytics, data pipelining, and ETL applications.
Flink提供了Table API,作为批处理和流处理的统一关系型API,查询将会以同样的语义在无界实时流或有界批处理数据集上运行,并产生同样的结果。Flink Table API 可以非常简单的用于数据分析、数据管道和ETL应用。
你将构建什么(What Will You Be Building)
In this tutorial, you will learn how to build a real-time dashboard to track financial transactions by account. The pipeline will read data from Kafka and write the results to MySQL visualized via Grafana.
在该页面,你将学习如何创建一个实时仪表盘来跟踪金融交易金额。数据从Kafka读取,并最终将结果写入Mysql,并由Grafana展示。
前置条件(Prerequisites)
This walkthrough assumes that you have some familiarity with Java or Scala, but you should be able to follow along even if you come from a different programming language. It also assumes that you are familiar with basic relational concepts such as SELECT and GROUP BY clauses
这个Demo项目需要你对Java或Scala有一定的了解,但是即使你使用的是其他语言,你也可以按照下文进行操作完成。同时,希望你对基础的关系型概念有所了解,如select、group by等。
如何进行(How To Follow Along)
If you want to follow along, you will require a computer with:
Java 8 or 11
Maven
Docker
进行后续操作,要求你的计算机具备如下环境:
- Java8 或11
- maven
- docker
The required configuration files are available in the flink-playgrounds repository. Once downloaded, open the project flink-playground/table-walkthrough in your IDE and navigate to the file SpendReport.
必要的配置文件必须在flink-palygrounds仓库中,并且可被访问。完成下载后,在IDE中打开flink-palyground/walkthrough项目,然后找到文件SpendReport。
EnvironmentSettings settings = EnvironmentSettings.inStreamingMode();
TableEnvironment tEnv = TableEnvironment.create(settings);

tEnv.executeSql("CREATE TABLE transactions (\n" +
    "    account_id  BIGINT,\n" +
    "    amount      BIGINT,\n" +
    "    transaction_time TIMESTAMP(3),\n" +
    "    WATERMARK FOR transaction_time AS transaction_time - INTERVAL '5' SECOND\n" +
    ") WITH (\n" +
    "    'connector' = 'kafka',\n" +
    "    'topic'     = 'transactions',\n" +
    "    'properties.bootstrap.servers' = 'kafka:9092',\n" +
    "    'format'    = 'csv'\n" +
    ")");

tEnv.executeSql("CREATE TABLE spend_report (\n" +
    "    account_id BIGINT,\n" +
    "    log_ts     TIMESTAMP(3),\n" +
    "    amount     BIGINT\n," +
    "    PRIMARY KEY (account_id, log_ts) NOT ENFORCED" +
    ") WITH (\n" +
    "   'connector'  = 'jdbc',\n" +
    "   'url'        = 'jdbc:mysql://mysql:3306/sql-demo',\n" +
    "   'table-name' = 'spend_report',\n" +
    "   'driver'     = 'com.mysql.jdbc.Driver',\n" +
    "   'username'   = 'sql-demo',\n" +
    "   'password'   = 'demo-sql'\n" +
    ")");

Table transactions = tEnv.from("transactions");
report(transactions).executeInsert("spend_report");
拆解代码(Breaking Down The Code)
运行环境(The Execution Environment)
The first two lines set up your TableEnvironment. The table environment is how you can set properties for your Job, specify whether you are writing a batch or a streaming application, and create your sources. This walkthrough creates a standard table environment that uses the streaming execution.
前两行设置了表运行环境,在运行环境中你可以配置你的任务参数,如指定任务类型是批处理还是流处理应用,并创建你的数据源。这个Demo创建了一个标准的表运行环境,使用的是流处理引擎。
EnvironmentSettings settings = EnvironmentSettings.inStreamingMode();
TableEnvironment tEnv = TableEnvironment.create(settings);
注册表(Registering Tables)
Next, tables are registered in the current catalog that you can use to connect to external systems for reading and writing both batch and streaming data. A table source provides access to data stored in external systems, such as a database, a key-value store, a message queue, or a file system. A table sink emits a table to an external storage system. Depending on the type of source and sink, they support different formats such as CSV, JSON, Avro, or Parquet.
下一步,表将被注册到当前目录,你可以用于连接其他系统来读取和写入批处理或流处理数据。表数据源可以访问其他系统的数据,如数据库、key-value存储、消息队列或文件系统等。表目标将表传到外部存储系统。依靠不同的源和目标,可以支持csv、json、avro、parquet等格式。
tEnv.executeSql("CREATE TABLE transactions (\n" +
     "    account_id  BIGINT,\n" +
     "    amount      BIGINT,\n" +
     "    transaction_time TIMESTAMP(3),\n" +
     "    WATERMARK FOR transaction_time AS transaction_time - INTERVAL '5' SECOND\n" +
     ") WITH (\n" +
     "    'connector' = 'kafka',\n" +
     "    'topic'     = 'transactions',\n" +
     "    'properties.bootstrap.servers' = 'kafka:9092',\n" +
     "    'format'    = 'csv'\n" +
     ")");

tEnv.executeSql("CREATE TABLE spend_report (\n" +
    "    account_id BIGINT,\n" +
    "    log_ts     TIMESTAMP(3),\n" +
    "    amount     BIGINT\n," +
    "    PRIMARY KEY (account_id, log_ts) NOT ENFORCED" +
    ") WITH (\n" +
    "    'connector'  = 'jdbc',\n" +
    "    'url'        = 'jdbc:mysql://mysql:3306/sql-demo',\n" +
    "    'table-name' = 'spend_report',\n" +
    "    'driver'     = 'com.mysql.jdbc.Driver',\n" +
    "    'username'   = 'sql-demo',\n" +
    "    'password'   = 'demo-sql'\n" +
    ")");
Two tables are registered; a transaction input table, and a spend report output table. The transactions (transactions) table lets us read credit card transactions, which contain account ID’s (account_id), timestamps (transaction_time), and US$ amounts (amount). The table is a logical view over a Kafka topic called transactions containing CSV data.
两张表注册好,一张交易输入表,一张报表输出表。transaction表可以获取信用卡交易数据,包含了账户id、交易时间、金额。这张表是一个kafka transaction主题的逻辑视图,包含了csv数据。
The second table, spend_report, stores the final results of the aggregation. Its underlying storage is a table in a MySql database.
第二张表,spend_report,存储了聚合的最终结果,它的底层存储是MySQL数据库中的一张表。
查询(The Query )
With the environment configured and tables registered, you are ready to build your first application. From the TableEnvironment you can read from an input table to read its rows and then write those results into an output table using executeInsert. The report function is where you will implement your business logic. It is currently unimplemented.
完成环境配置和表注册后,你已经完成了所有准备工作。从表运行环境中你可以读取输入表的每一行数据,并使用executeInsert将结果写入输出表。report函数用于实现你的商业逻辑,目前还未完成。
Table transactions = tEnv.from("transactions");
report(transactions).executeInsert("spend_report");
测试(Testing)
The project contains a secondary testing class SpendReportTest that validates the logic of the report. It creates a table environment in batch mode.
工厂中包含了一个测试类SpendReportTest,可以验证报告的逻辑。它创建了一个批处理的表环境。
EnvironmentSettings settings = EnvironmentSettings.inBatchMode();
TableEnvironment tEnv = TableEnvironment.create(settings);
One of Flink’s unique properties is that it provides consistent semantics across batch and streaming. This means you can develop and test applications in batch mode on static datasets, and deploy to production as streaming applications.
Flink的特点之一就是它提供了批处理和流处理的统一语义。这意味着你可以在批处理环境下使用静态数据集开发和测试程序,并将其以流处理的应用部署在生产中。
尝试一下(Attempt One)
Now with the skeleton of a Job set-up, you are ready to add some business logic. The goal is to build a report that shows the total spend for each account across each hour of the day. This means the timestamp column needs be be rounded down from millisecond to hour granularity.
完成了任务的骨架后,你可以准备添加一些商业逻辑。目标是构建一个展示每个账户当天各个小时的总消费报表。这意味着时间列需要限定在毫秒到小时的范围。
Flink supports developing relational applications in pure SQL or using the Table API. The Table API is a fluent DSL inspired by SQL, that can be written in Python, Java, or Scala and supports strong IDE integration. Just like a SQL query, Table programs can select the required fields and group by your keys. These features, along with built-in functions like floor and sum, you can write this report.
Flink支持使用SQL或Table API开发关系型程序。Table API是一个流畅的DSL,受到SQL的启发,它可以用Python、Java或Scala编写,并支持强大的IDE。像SQL查询一样,Table程序可以选择查询必要的字段并按key进行分组。这些功能,如floor、sum等内置功能,可以协助你完成报表。
public static Table report(Table transactions) {
    return transactions.select(
            $("account_id"),
            $("transaction_time").floor(TimeIntervalUnit.HOUR).as("log_ts"),
            $("amount"))
        .groupBy($("account_id"), $("log_ts"))
        .select(
            $("account_id"),
            $("log_ts"),
            $("amount").sum().as("amount"));
}
用户自定义函数(User Defined Functions)
Flink contains a limited number of built-in functions, and sometimes you need to extend it with a user-defined function. If floor wasn’t predefined, you could implement it yourself.
Flink内置函数是有限的,有时候你需要额外的用户自定义函数,假如floor没有被预先定义,你可以自己实现它。
import java.time.LocalDateTime;
import java.time.temporal.ChronoUnit;

import org.apache.flink.table.annotation.DataTypeHint;
import org.apache.flink.table.functions.ScalarFunction;

public class MyFloor extends ScalarFunction {

    public @DataTypeHint("TIMESTAMP(3)") LocalDateTime eval(
        @DataTypeHint("TIMESTAMP(3)") LocalDateTime timestamp) {

        return timestamp.truncatedTo(ChronoUnit.HOURS);
    }
}
And then quickly integrate it in your application.
然后在你的程序中快速使用它。
public static Table report(Table transactions) {
    return transactions.select(
            $("account_id"),
            call(MyFloor.class, $("transaction_time")).as("log_ts"),
            $("amount"))
        .groupBy($("account_id"), $("log_ts"))
        .select(
            $("account_id"),
            $("log_ts"),
            $("amount").sum().as("amount"));
}
This query consumes all records from the transactions table, calculates the report, and outputs the results in an efficient, scalable manner. Running the test with this implementation will pass.
这个查询使用了transaction表中的所有记录来计算报表,并输出结果。
运行test将会正常处理。
添加窗口(Adding Windows)
Grouping data based on time is a typical operation in data processing, especially when working with infinite streams. A grouping based on time is called a window and Flink offers flexible windowing semantics. The most basic type of window is called a Tumble window, which has a fixed size and whose buckets do not overlap.
public static Table report(Table transactions) {
    return transactions
        .window(Tumble.over(lit(1).hour()).on($("transaction_time")).as("log_ts"))
        .groupBy($("account_id"), $("log_ts"))
        .select(
            $("account_id"),
            $("log_ts").start().as("log_ts"),
            $("amount").sum().as("amount"));
}
This defines your application as using one hour tumbling windows based on the timestamp column. So a row with timestamp 2019-06-01 01:23:47 is put in the 2019-06-01 01:00:00 window.
使用基于时间列的一小时的滚动窗口来定义程序。因此时间列是2019-06-01 01:23:47的数据将被放入2019-06-01 01:00:00窗口。
Aggregations based on time are unique because time, as opposed to other attributes, generally moves forward in a continuous streaming application. Unlike floor and your UDF, window functions are intrinsics, which allows the runtime to apply additional optimizations. In a batch context, windows offer a convenient API for grouping records by a timestamp attribute.
基于时间的聚合是唯一的,因为时间不同与其他属性,通常在持续的流式处理应用中向前移动。与floor和你的UDF不同,Window函数是内部函数,它运行在运行时进行额外的优化。在批处理上下文中,Windows提供了一个方便的API用于按时间属性对数据进行分组。
Running the test with this implementation will also pass.
运行测试程序将会获得成功。
使用流处理(Once More, With Streaming!)
And that’s it, a fully functional, stateful, distributed streaming application! The query continuously consumes the stream of transactions from Kafka, computes the hourly spendings, and emits results as soon as they are ready. Since the input is unbounded, the query keeps running until it is manually stopped. And because the Job uses time window-based aggregations, Flink can perform specific optimizations such as state clean up when the framework knows that no more records will arrive for a particular window.
这是一个完整的函数式、状态化、分布式的流处理程序。这个查询持续性的消费kafka的transactions主题数据,计算小时花费并将结果尽快输出。一旦输入是无界流,查询将持续进行直到它被手动停止。由于这个任务使用了窗口聚合,flink可以使用指定的优化,如状态清除,当框架知道不会再有数据到达指定的窗口时。
The table playground is fully dockerized and runnable locally as streaming application. The environment contains a Kafka topic, a continuous data generator, MySql, and Grafana.
表运行环境是完全docker化的,并作为流处理程序运行在本地。运行环境中包括kafka主题,持续性的大护士节生产,MySQL和Grafana。
From within the table-walkthrough folder start the docker-compose script.
在table-walkthrough文件夹中执行docker-compose脚本。
docker-compose build
docker-compose up -d
You can see information on the running job via the Flink console.
你可以在Flink控制台看到运行中的任务信息。
[外链图片转存失败,源站可能有防盗链机制,建议将图片保存下来直接上传(img-DtP400BM-1641720415195)(https://nightlies.apache.org/flink/flink-docs-release-1.14/fig/spend-report-console.png)]
Explore the results from inside MySQL.
查看MySQL中的结果。
select count(*) from spend_report;
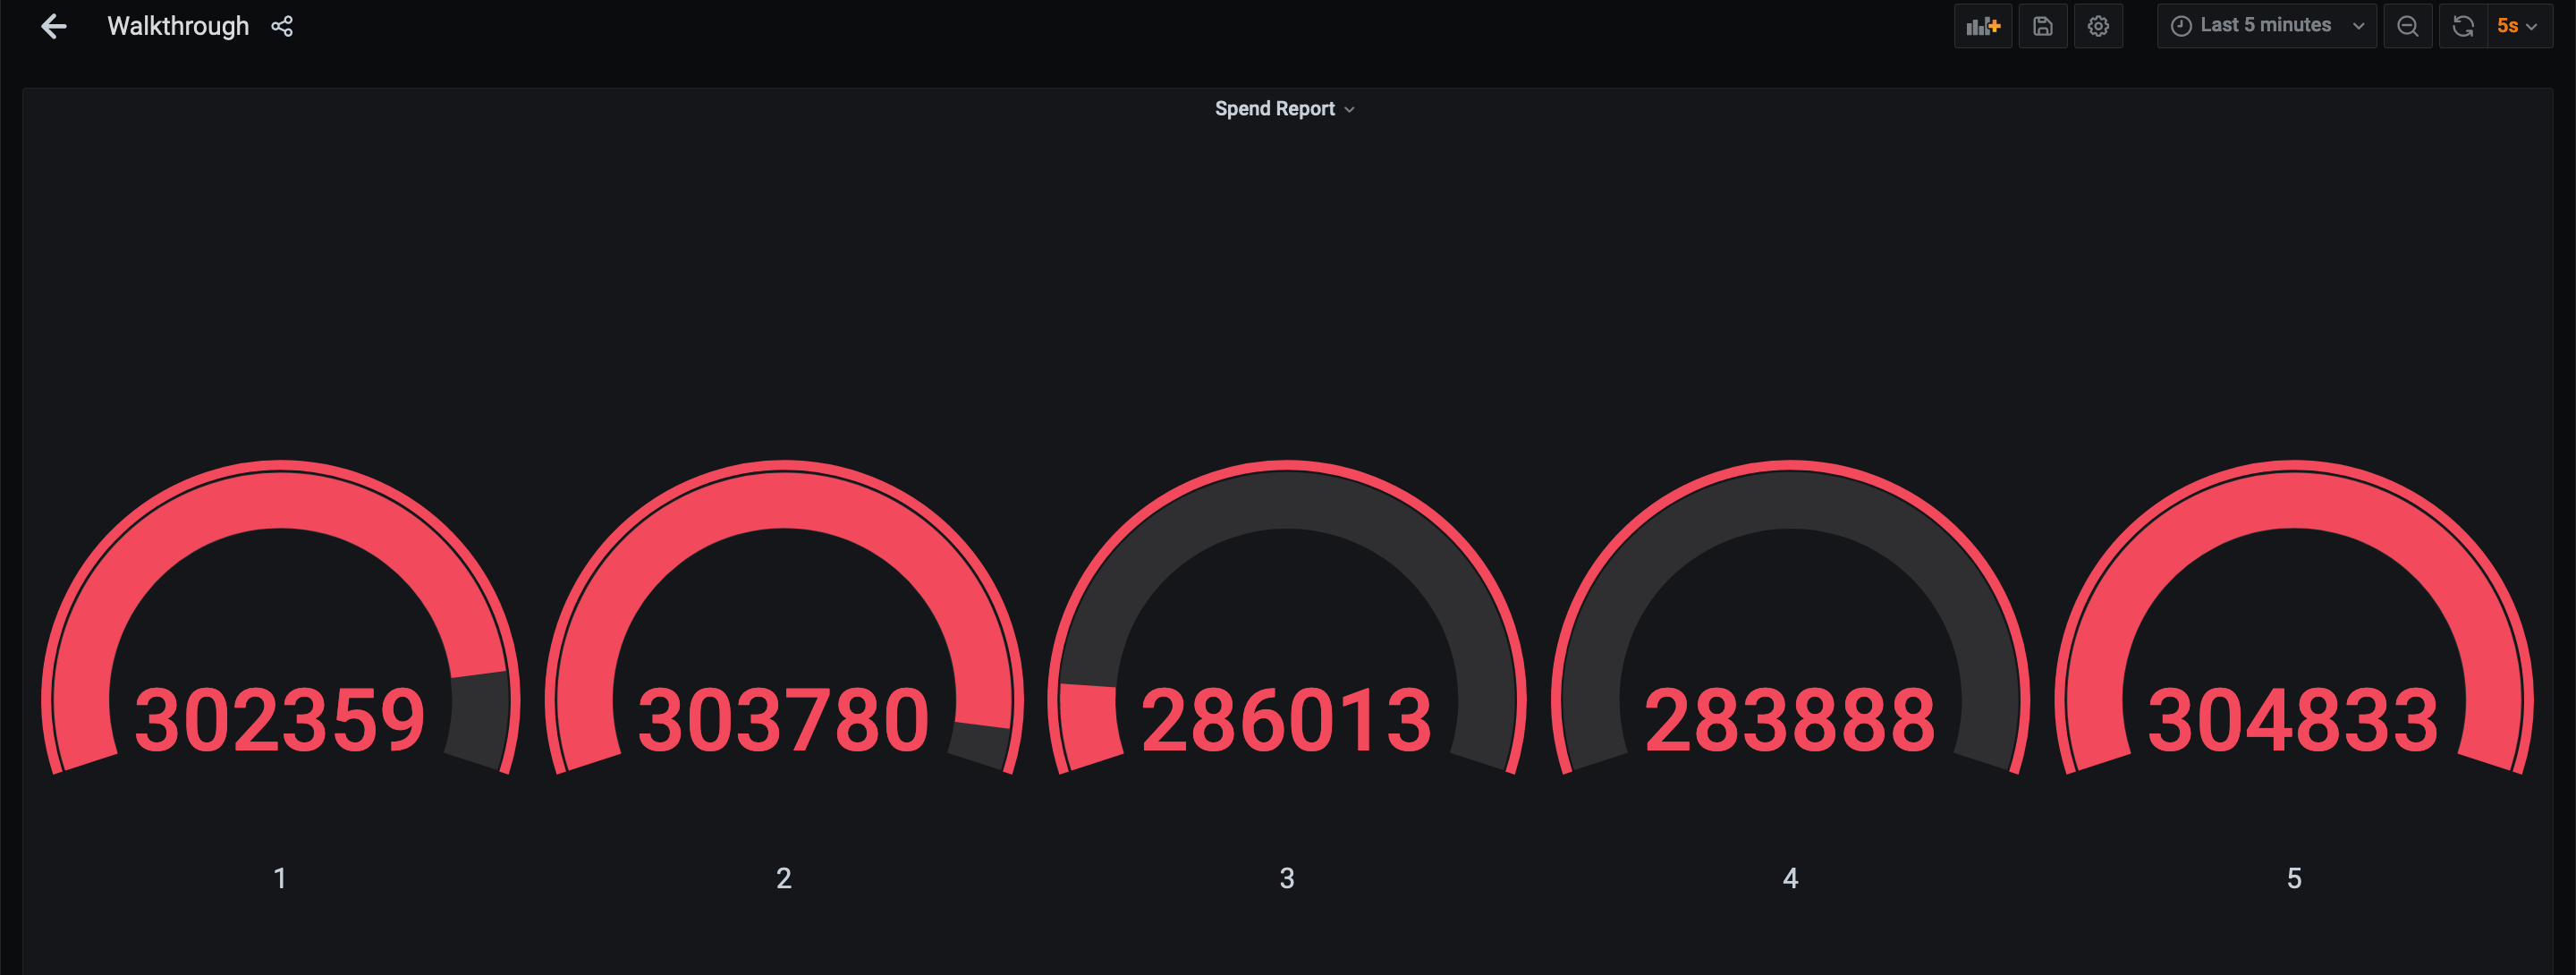
Finally, go to Grafana to see the fully visualized result!
最后到Grafana中查看可视化结果。


 386
386


 被折叠的 条评论
为什么被折叠?
被折叠的 条评论
为什么被折叠?
 到【灌水乐园】发言


