


相信很多用过Antv G6或者echarts关系图等的大佬都知道,关于图形的layout布局都是已经内置好的,只需要修改layout就行了,但是,,,,,在Antv X6这块就行不通了。。。。。。。。。。。
在文档中翻到了layout的使用,需要进行安装,所以感觉用起来就没有别的那么方便了。
下面我简单介绍一下安装及使用的过程吧:
(1)X6中layout的安装与引用
1.1在项目中使用NPM包引入
npm install @antv/layout --save
在需要layout的X6的组件或JS文件中导入:
import { GridLayout } from '@antv/layout' // umd模式下, const { GridLayout } = window.layout
导入后
{ GridLayout
}会报错,别急,跟
Graph一样,
下面代码中需要创建
GridLayout
对象,才不会报错
1.2 如果是直接通过 script 标签引入,可以使用下面两个 CDN 中的任何一个:
(2)demo示例
代码布局:
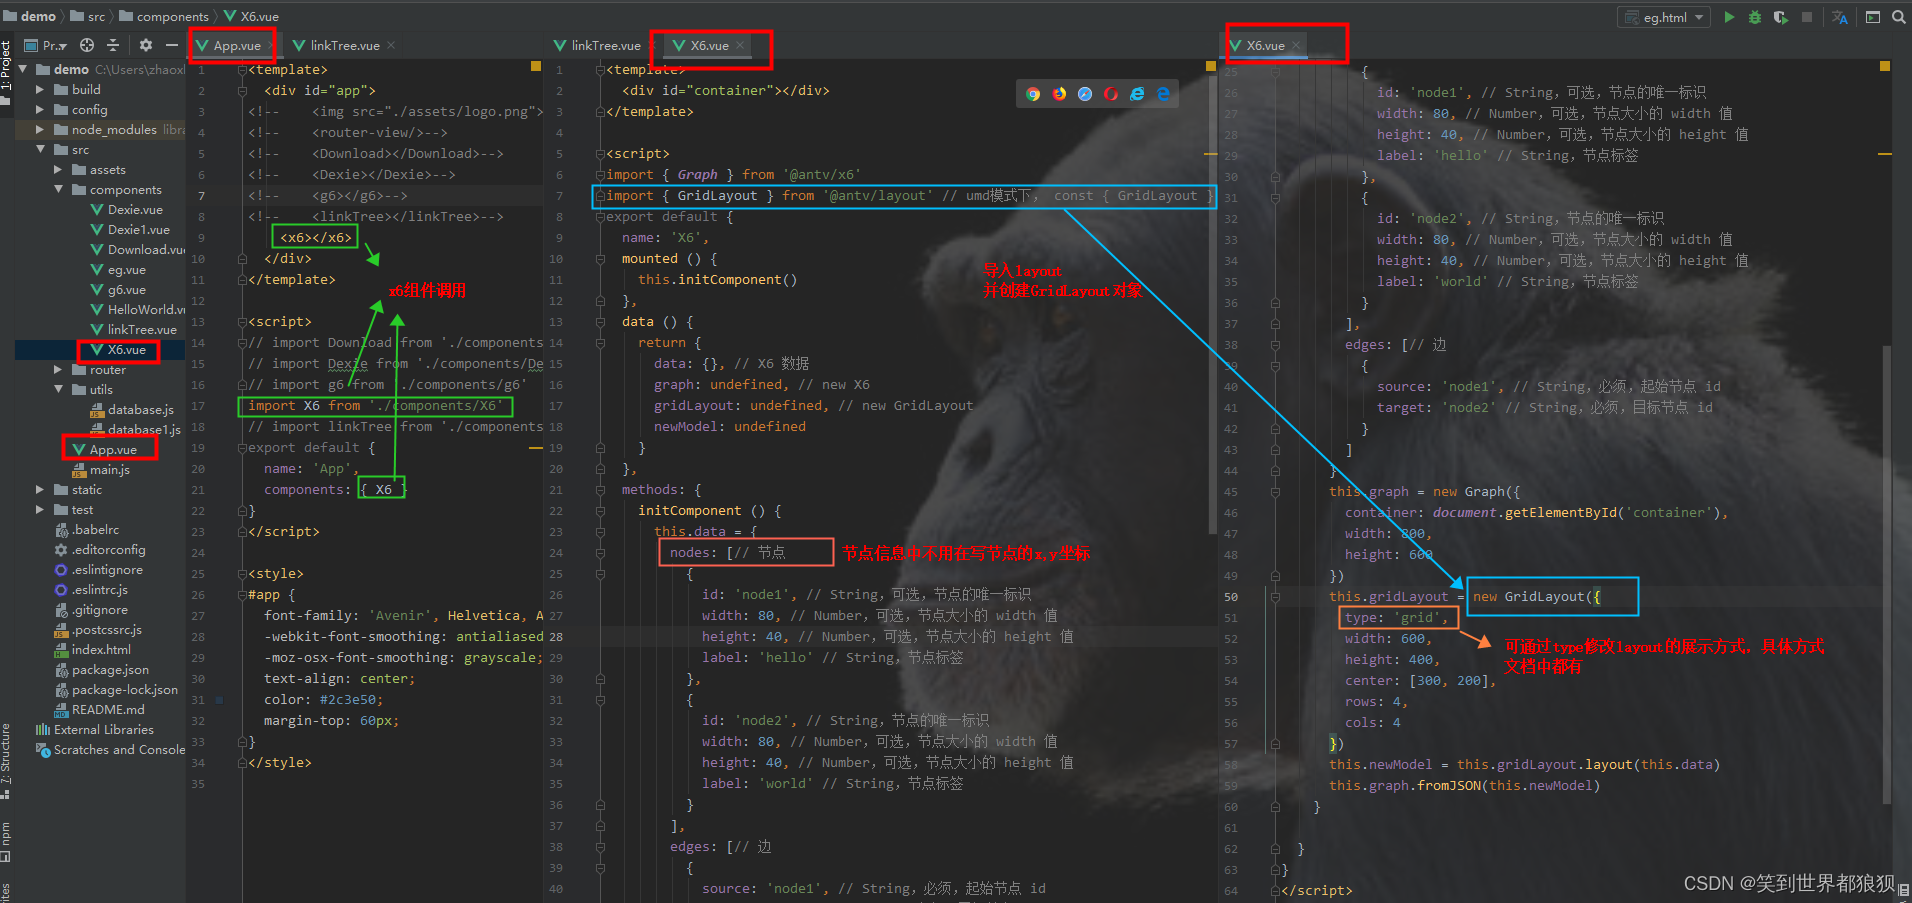
主要代码:
this.gridLayout = new GridLayout({
  type: 'grid',
  width: 600,
  height: 400,
  center: [300, 200],
  rows: 4,
  cols: 4
})
this.newModel = this.gridLayout.layout(this.data)
this.graph.fromJSON(this.newModel)
完整代码:
<template>
  <div id="container"></div>
</template>


<script>
import { Graph } from '@antv/x6'
import { GridLayout } from '@antv/layout' // umd模式下, const { GridLayout } = window.layout
export default {
  name: 'X6',
  mounted () {
    this.initComponent()
  },
  data () {
    return {
      data: {}, // X6 数据
      graph: undefined, // new X6
      gridLayout: undefined, // new GridLayout
      newModel: undefined
    }
  },
  methods: {
    initComponent () {
      this.data = {
        nodes: [// 节点
          {
            id: 'node1', // String,可选,节点的唯一标识
            width: 80, // Number,可选,节点大小的 width 值
            height: 40, // Number,可选,节点大小的 height 值
            label: 'hello' // String,节点标签
          },
          {
            id: 'node2', // String,节点的唯一标识
            width: 80, // Number,可选,节点大小的 width 值
            height: 40, // Number,可选,节点大小的 height 值
            label: 'world' // String,节点标签
          }
        ],
        edges: [// 边
          {
            source: 'node1', // String,必须,起始节点 id
            target: 'node2' // String,必须,目标节点 id
          }
        ]
      }
      this.graph = new Graph({
        container: document.getElementById('container'),
        width: 800,
        height: 600
      })
      this.gridLayout = new GridLayout({
        type: 'grid',
        width: 600,
        height: 400,
        center: [300, 200],
        rows: 4,
        cols: 4
      })
      this.newModel = this.gridLayout.layout(this.data)
      this.graph.fromJSON(this.newModel)
    }


  }
}
</script>


<style scoped>


</style>
效果如下:


 1353
1353

 被折叠的 条评论
为什么被折叠?
被折叠的 条评论
为什么被折叠?
 到【灌水乐园】发言


