


将excel中的信号导入matlab中进行fft分析:
准备一组excel数据: 
新建.m脚本文件,导入文件:
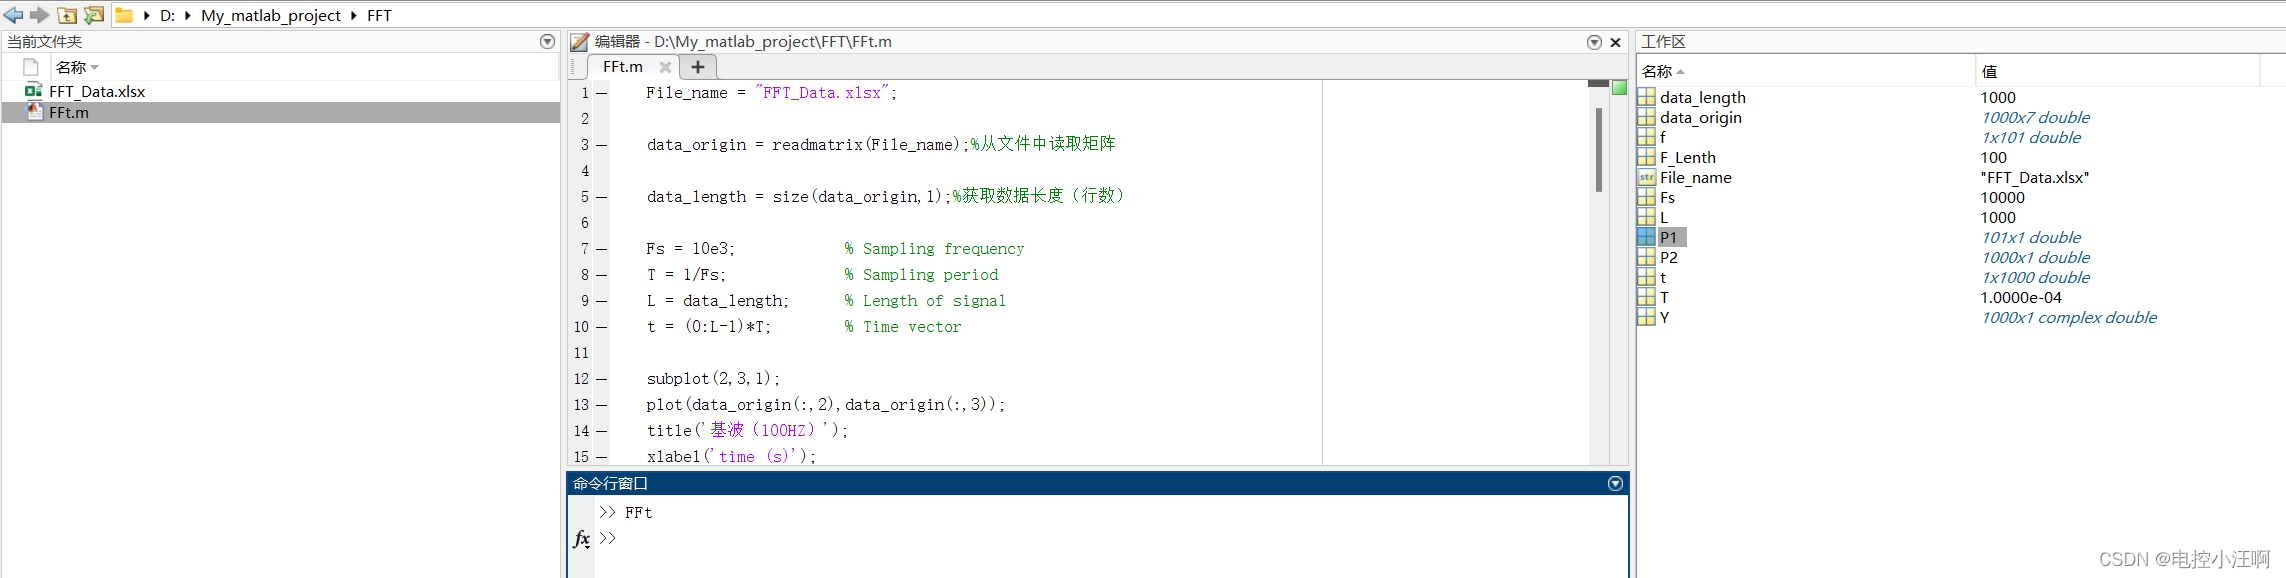
脚本文件:
File_name = "FFT_Data.xlsx";
data_origin = readmatrix(File_name);%从文件中读取矩阵
data_length = size(data_origin,1);%获取数据长度(行数)
Fs = 10e3; % Sampling frequency
T = 1/Fs; % Sampling period
L = data_length; % Length of signal
t = (0:L-1)*T; % Time vector
subplot(2,3,1);
plot(data_origin(:,2),data_origin(:,3));
title('基波(100HZ)');
xlabel('time (s)');
subplot(2,3,2);
plot(data_origin(:,2),data_origin(:,4));
title('二倍基波频率(200HZ)');
xlabel('time (s)');
subplot(2,3,3);
plot(data_origin(:,2),data_origin(:,5));
title('三倍基波频率(300HZ)');
xlabel('time (s)');
subplot(2,3,4);
plot(data_origin(:,2),data_origin(:,6));
title('随机噪声信号');
xlabel('time (s)');
subplot(2,3,5);
%第七列信号为前面四个信号之和
plot(data_origin(:,2),data_origin(:,7));
title('最终信号');
xlabel('time (s)');
%对第七列信号进行FFT分析
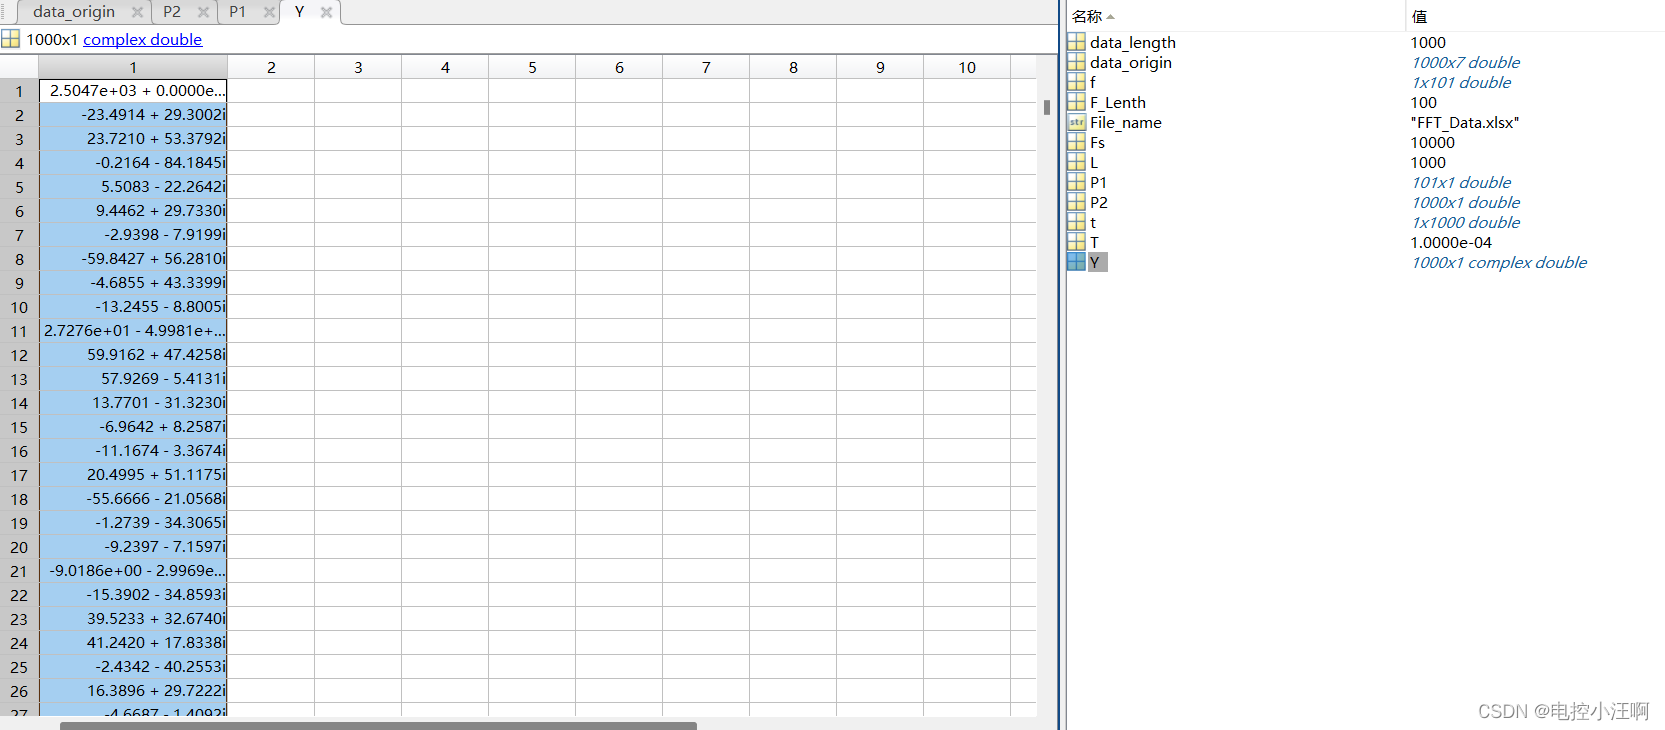
Y = fft(data_origin(:,7));
F_Lenth = L/10;%设置L/10,则频谱横坐标为0 - Fs/10
%计算双侧频谱 P2。然后基于 P2 和偶数信号长度 L 计算单侧频谱 P1
P2 = abs(Y/L);
P1 = P2(1:F_Lenth+1);
P1(2:end-1) = 2*P1(2:end-1);
%定义频域 f
f = Fs*(0:F_Lenth)/L;
subplot(2,3,6);
%绘制单侧幅值频谱 P1
plot(f,P1);
title('Single-Sided Amplitude Spectrum of X(t)');
xlabel('f (Hz)');
ylabel('|P1(f)|');
% clc;
% clear;中间变量:

 最终波形:
最终波形:
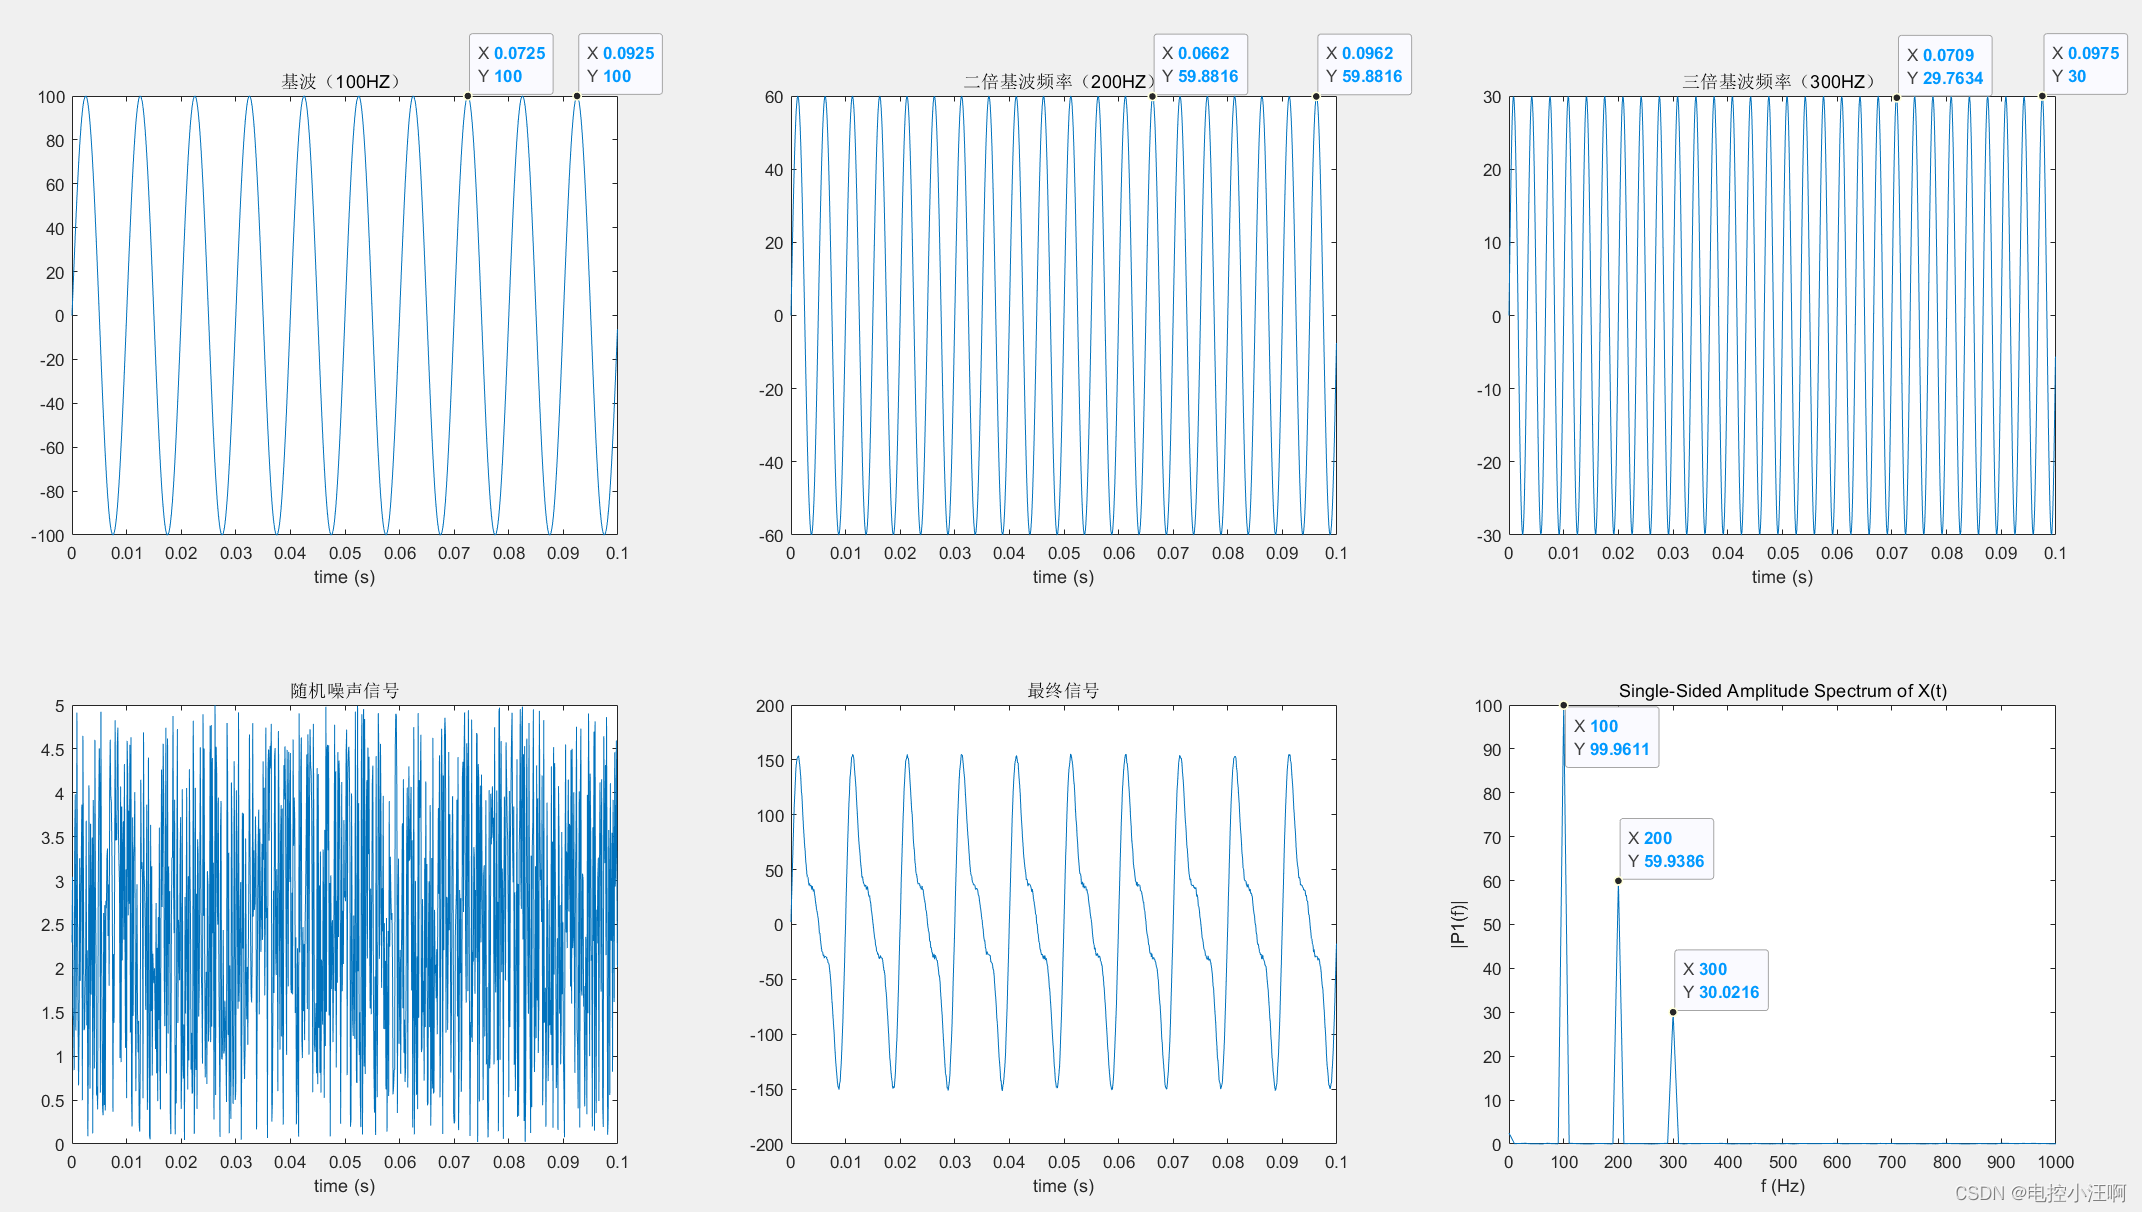
结论:
1.FFT波形的频率和幅值与原信号相吻合;
2.采样频率越高,FFT结果越精准。


 664
664


 被折叠的 条评论
为什么被折叠?
被折叠的 条评论
为什么被折叠?
 到【灌水乐园】发言


