主要函数为 bubblechart()
该函数是在 R2020b 中推出的,因此作图需要 MATLAB R2020b 或更新的版本
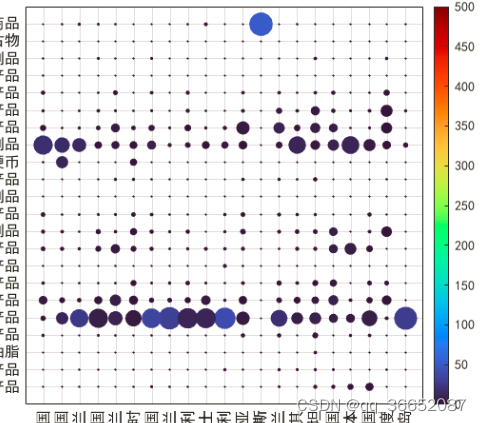
首先贴一下效果图,这副图中,气泡大小表示份额,气泡颜色表示总量
然后贴一下代码
%%首先读取 datae2007 和 datae2007_,即两组r×c的数组,前者表示份额,后者表示总量
datae2007 = xlsread(filepath,"e2007");
datae2007_ = xlsread(filepath1,"e2007");
% 生成矩阵坐标数据
[r,c] = size(datae2001);
x = 1:c;
y = 1:r;
[xx,yy] = meshgrid(x,y);
%yy = flipud(yy);
ax2 = nexttile;
bubblechart(xx(:),yy(:),datae2007(:),datae2007_(:),'MarkerFaceAlpha',1);
hTitle = title('2007');
hXLabel = xlabel('横坐标标题');
hYLabel = ylabel('纵坐标标题');
% 调节气泡大小
bubblesize([1 18])
% 坐标轴美化
axis equal
set(gca, 'Box', 'on', ...
'XGrid', 'on', 'YGrid', 'on', ...
'TickDir', 'in', 'TickLength', [0 0], ...
'XMinorTick', 'off', 'YMinorTick', 'off', ...
'XColor', [.1 .1 .1], 'YColor', [.1 .1 .1],...
'XTick', 0:1:c+1,...
'XLim', [0 c+1],...
'YTick', 0:1:r+1,...
'YLim', [0 r+1], ...
'XTickLabel',txt(1,:)'',...
'YTickLabel',[])
% 添加图例
blgd = bubblelegend('Style','vertical',...
'BubbleSizeOrder','descending',...
'box','off',...
'Location','northeastoutside',...
'NumBubbles',3,... ...
'FontName', 'Helvetica',...
'FontSize', 10);
%colorbar('Position',[0.72,0.11,0.03,0.5])%'Position',[0.79,0.11,0.03,0.5]
%设置气泡大小
bubblelim([0 1]);
axis square
cb = colorbar;
set(cb.Label,'String','颜色条所表征内容的单位', ...
'Rotation',270, ...
'FontSize',12, ...
'VerticalAlignment','bottom');
cb.Location = "eastoutside";
%设置共享色阶
set(gca,'CLim',[0,500]);
set(gca,'FontSize', 12,'Fontname','黑体')
%设置颜色条为turbo
colormap(ax2,turbo);
以上。