


subplots(nrows=1, ncols=1, *, sharex=False, sharey=False, squeeze=True, subplot_kw=None, gridspec_kw=None)
所有参数如下:
nrows,ncols:
|参数类型:int, default: 1(default:1 默认为1)
|功能:nrows行数,ncols列数
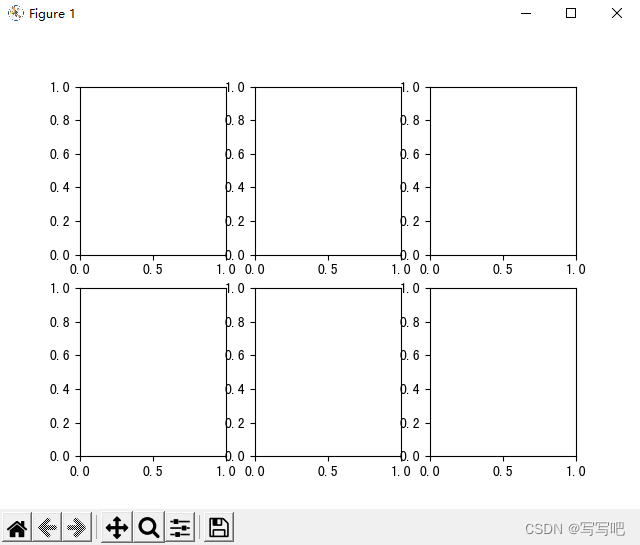
|例:fig, axes = plt.subplots(nrows=2, ncols=3)
画布即为2行3列
sharex,sharey:
|参数类型:bool or {‘none’, ‘all’, ‘row’, ‘col’}, default: False
|功能:控制子图之间x轴(sharex)或y轴(sharey)是否共享
||True or ‘all’: 所有子图共享x轴或y轴
||False or ‘none’: 每一个子图的x轴或y轴都是独立的
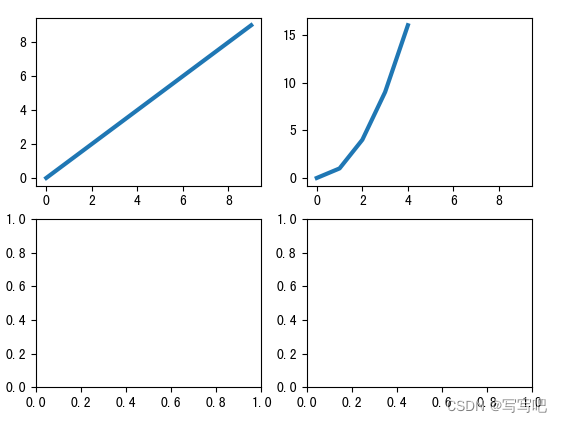
||‘row’: 每行子图的x轴或y轴都是共享的.
||‘col’: 每列子图的x轴或y轴都是共享的.
|例:
import matplotlib.pyplot as plt
squares = [i for i in range(10)]
squares2 = [i for i in range(5)]
squares3 = [i * i for i in range(5)]
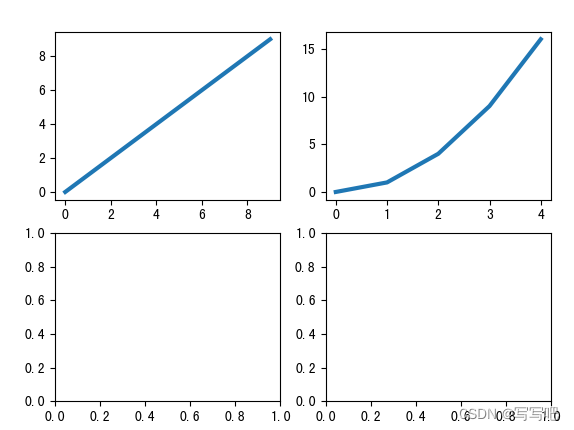
fig, axes = plt.subplots(nrows=2, ncols=2, sharex='row')
axes[0, 0].plot(squares, squares, linewidth=3)
axes[0, 1].plot(squares2, squares3, linewidth=3)
squeeze:
|参数类型:bool, default: True
|功能:
||True:如果只创建了一个子图像,返回的坐标轴对象是一个标量
如果创建的是1xN单行或者MX1单列的子图像,返回坐标系对象是一个一维numpy数组
如果创建的是 NXM(N>1,M>1) 多行多列的子图像,返回坐标系对象是一个2维数组
||Flase:没有进行降维压缩,无论图像如何排列返回的坐标系对象总是2维数组的。
|例:
subplot_kw:
|参数类型:dict, optional
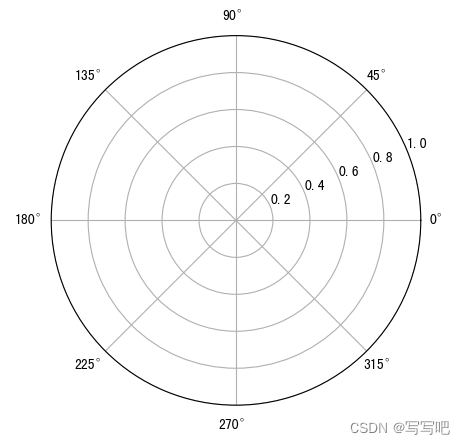
|功能:创建极坐标系
|例:fig, axs = plt.subplots(subplot_kw=dict(polar=True))
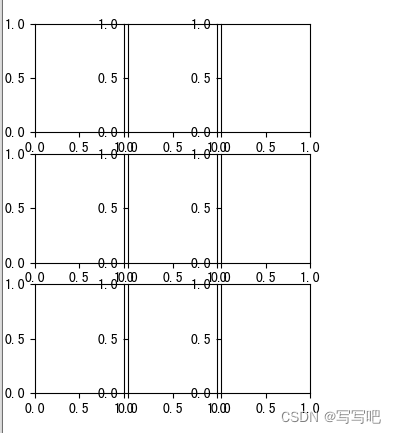
gridspec_kw:
|参数类型:dict, optional
|功能:自定义图形布局
|例:fig, axs = plt.subplots(3,3,gridspec_kw={'left': 0.05, 'right': 0.48, 'wspace': 0.05})
返回值:


 23万+
23万+


 被折叠的 条评论
为什么被折叠?
被折叠的 条评论
为什么被折叠?
 到【灌水乐园】发言


