


目录
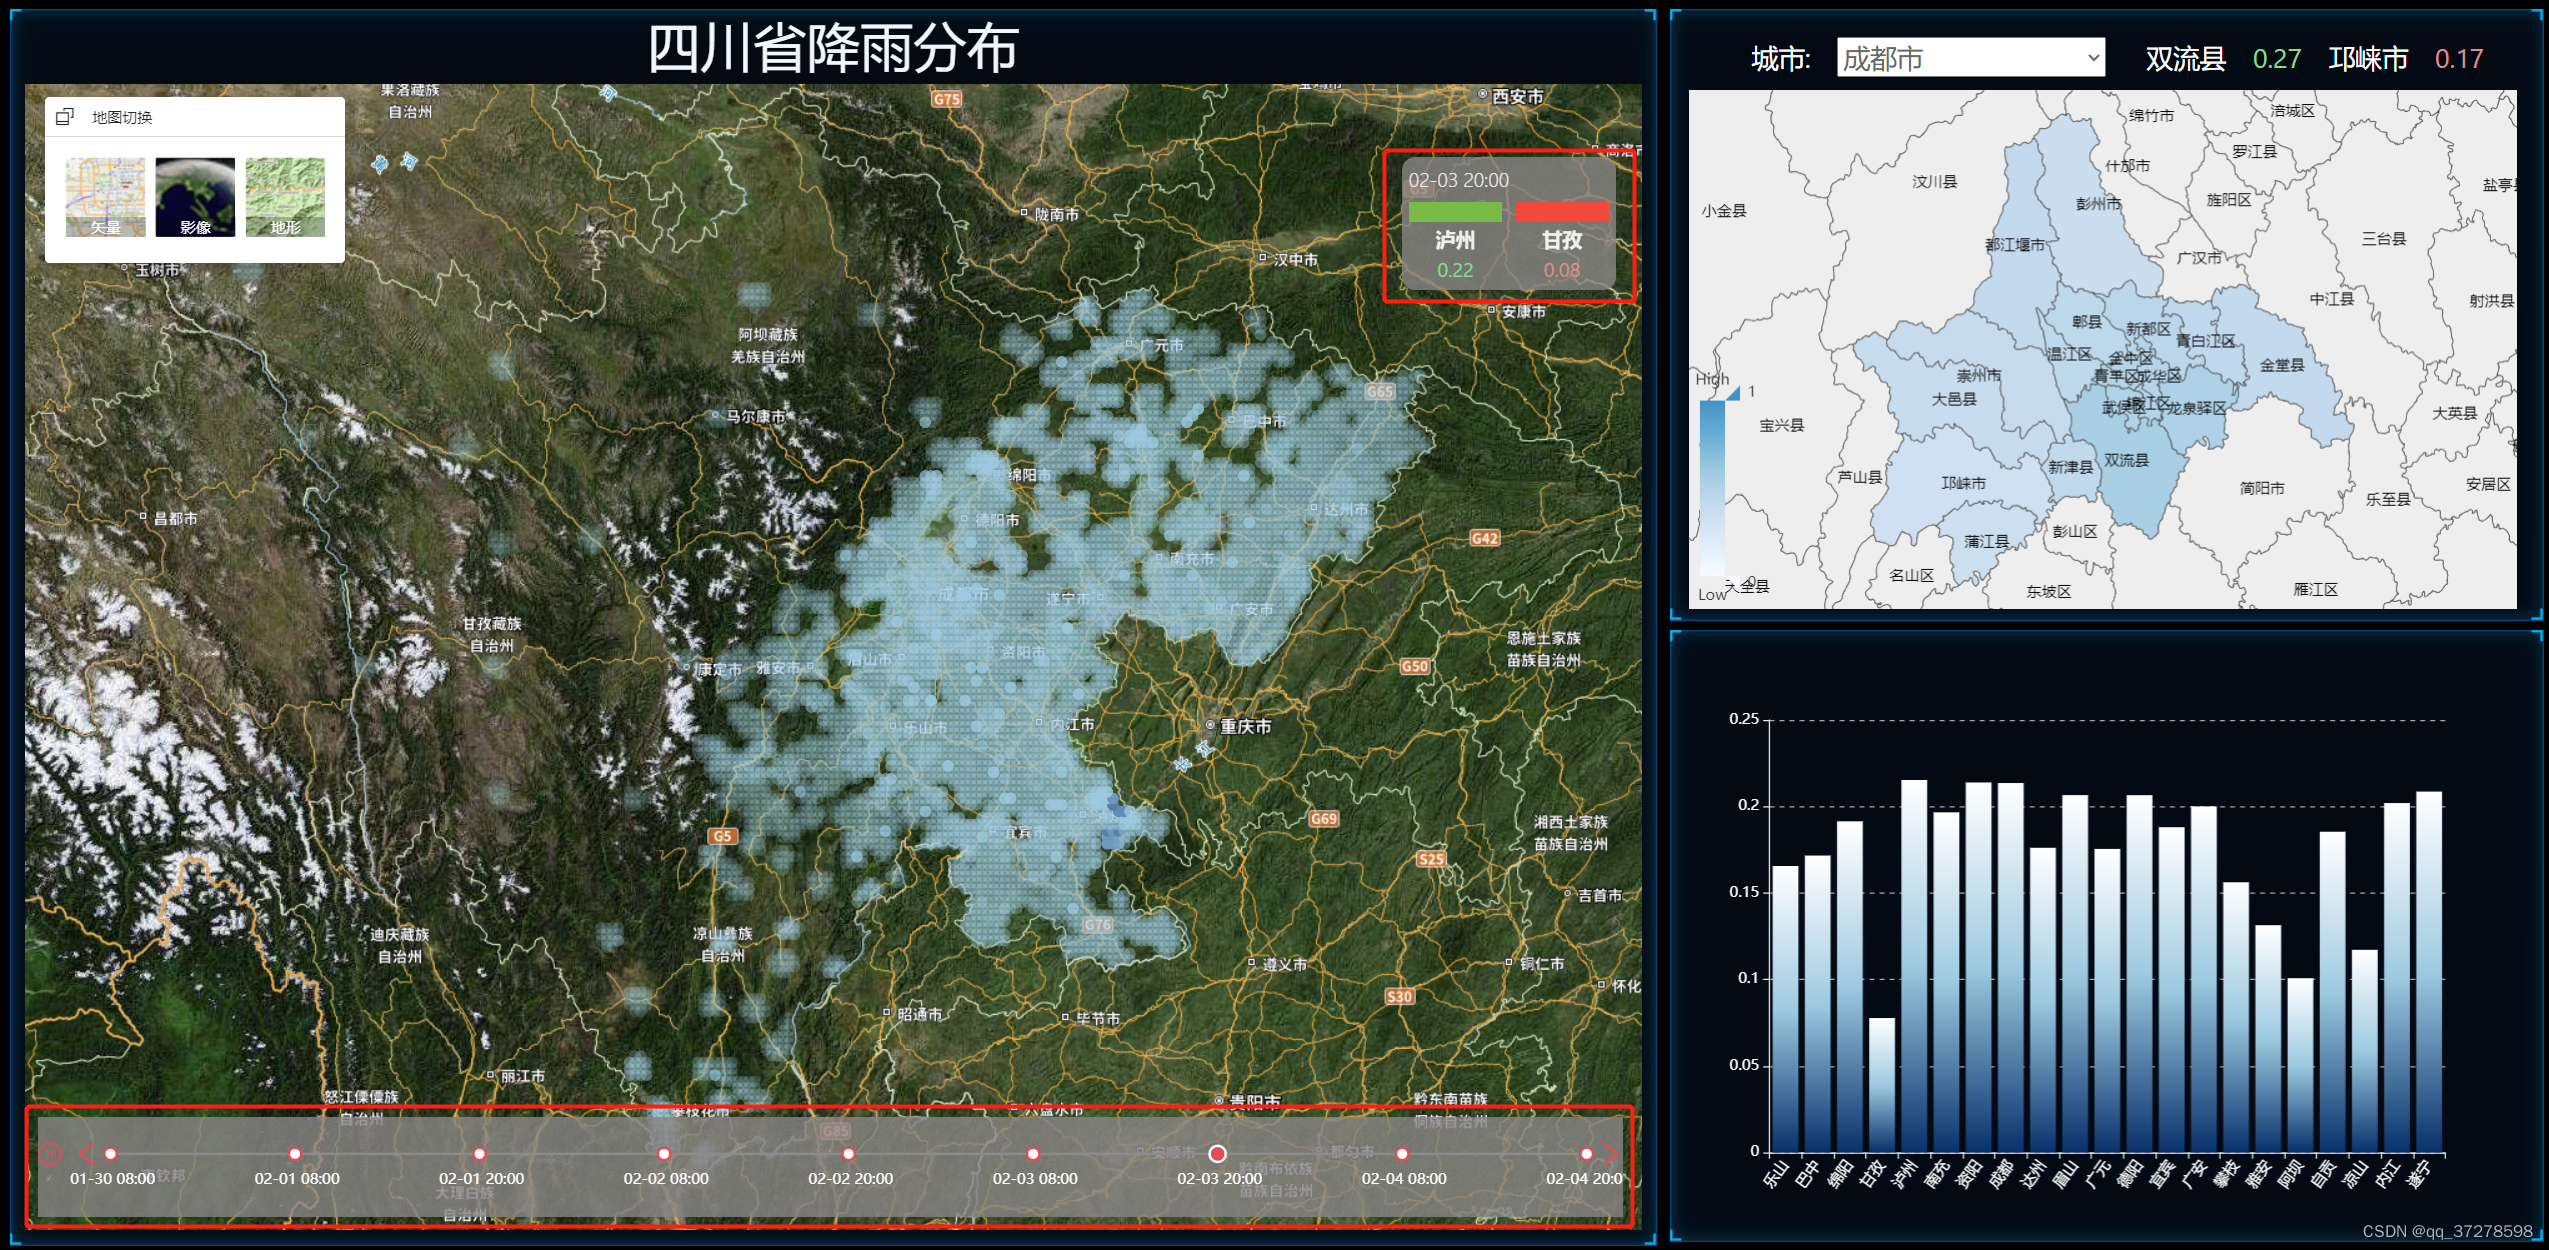
本节主要完成时间轴和市州降雨统计两个控件。
时间轴控件用于切换降雨数据,实现大屏内部降雨数据动态展示,而市州降雨统计组件则是根据读取的降雨数据,显示当天对应雨量最大最小值出现的市州。
一、降雨数据
在开始之前,需要先将降雨数据读取。在实际的开发应用中,数据应由后端人员从数据库或其他途径读取之后,通过接口返回给前端人员。由于本项目只是个人学习使用,数据量较小,故直接前端读取使用。
本项目使用的数据可在github中直接下载https://github.com/mosuiqin/weather/tree/main/src/data
其中,d开头的数据为完整的降雨数据,例如:d013008.json;city开头的数据为市州降雨量统计数据,例如:city013008.json;qx开头的数据为市州各区县降雨量统计数据,例如:qx013008.json。
二、时间轴控件
时间轴控件分为三种形式,分别为点,段,条
时间轴(点):时间轴(点) | Vue-iClient-MapboxGL
<SmTimeLine :data="data" style="width:100%" @timelinechanged="changed" @timelineplaychanged="playChanged"></SmTimeLine>
时间轴(段):时间轴(段) | Vue-iClient-MapboxGL
<SmTimeRange :data="data" style="width:100%" @datazoom="changed"></SmTimeRange> 时间轴(条):时间轴(条) | Vue-iClient-MapboxGL
<SmTimeSlider :data="data" style="width:100%" @timeplayerchanged="changed" @timeplayerplaychanged="playChanged"></SmTimeSlider> 
本文采用时间轴(点)的方式来显示时间轴。
<sm-time-line
      v-bind="timeLineProps" //时间轴样式设置
      :data="data"  //时间轴节点数组
      style="width: 100%" //控件宽度
      @timelinechanged="changed"//时间轴中的时间点改变后的事件
      @timelineplaychanged="changed" //时间轴中播放状态的切换事件
      background="rgba(138, 134, 134, 0.8)"//背景色
    ></sm-time-line>
1、时间轴样式设置
 timeLineProps: {
        autoPlay: true, //动态播放
        playInterval: 3000,  //节点间隔
        lineStyle: {
          color: '#8C8C8C',
          width: 2,
          type: 'solid',
        },          //轴线样式设置
        label: {
          color: 'white',
        },
      },
2、获取时间轴节点数组
采用vuex来存储时间轴节点,在store文件夹中新建index.js文件,用于存储项目数据。本项目将时间点变化存储在timeInfo中。
Vuex是一个用于Vue.js应用程序的状态管理模式和库。它可以帮助我们在Vue组件之间共享和管理应用程序的状态。
Vuex的核心概念包括:
①State(状态):应用程序的状态存储在一个单一的状态树中,即`state`。可以通过在组件中使用`this.$store.state`来访问状态。
②Mutations(变更):状态的变更通过提交一个`mutation`来进行。`mutation`是一个包含`type`和`payload`的对象,用于描述状态的变更操作。通过定义`mutations`,我们可以明确地追踪和记录状态的变化。
③Actions(动作):`actions`用于处理异步操作和复杂的逻辑。它们可以包含多个`mutation`的提交,并可以通过`commit`方法来触发`mutation`。在组件中,可以通过`this.$store.dispatch`来触发`actions`。
④Getters(获取器):`getters`用于从状态中派生出新的数据,类似于计算属性。它们可以接收状态作为第一个参数,并可以在组件中通过`this.$store.getters`来访问。
⑤Modules(模块):当应用程序变得复杂时,可以将`state`、`mutations`、`actions`和`getters`划分为模块。每个模块都有自己的`state`、`mutations`、`actions`和`getters`,并可以嵌套在其他模块中。
使用Vuex可以帮助我们更好地组织和管理应用程序的状态,并使不同组件之间的状态共享更加简单和可维护。它特别适用于大型应用程序或需要在多个组件之间共享状态的场景。
                                                                    index.js
import Vue from 'vue';
import Vuex from 'vuex';


Vue.use(Vuex);

const store = new Vuex.Store({
    state: {
        timeInfo: [],
        currentTime: {
            dataset: "d013008",
            time: " 01-30 08:00"
        },
    },
    mutations: {
        getTimeInfo(state) {
            const dataInfo = ['d013008', 'd020108', 'd020120', 'd020208', 'd020220', 'd020308', 'd020320', 'd020408', 'd020420']

            if (state.timeInfo.length === 0) {
                for (let i = 0; i < dataInfo.length; i++) {
                    const time = ` ${dataInfo[i].slice(1,3)}-${dataInfo[i].slice(3,5)} ${dataInfo[i].slice(5,7)}:00`
                    const timeDate = {
                        dataset: dataInfo[i],
                        time: time
                    }
                    state.timeInfo.push(timeDate)
                }
            }

        },

    },
});

export default store;
3、时间点改变后的事件changed
将对应的时间点传递给store,便于其他组件灵活读取
changed(e) {
      // 获取当前日期
      const currentTime = this.timeInfo[e.currentIndex]
      this.$store.commit('changeCurrentTime', currentTime)
      // 加载雨量图
      changeRainPointMap(this.map, currentTime.dataset)
    },
4、加载雨量图
changeRainPointMap的作用为判断当前地图中是否有雨量数据加载,若有则移除。需注意移除数据,要先removeLayer,再removeSource。
如果不需要移除数据,但又不希望在地图中显示,可设置图层的可见性,使其不可见,例如map.setLayoutProperty(layerId, 'visibility', 'none');
                                                      changeRainPointMap.js
import {
  loadRainData
} from './rainPontMap'
export const changeRainPointMap = (map, dataset) => {
  const layer = map.getStyle().layers
  let flag = 0
  let mapId
  for (let item of layer) {
    if (item.id.slice(0, 1) === 'd') {
      flag = 1
      mapId = item.id
    }
  }
  if (flag === 1) {
    map.removeLayer(mapId)
    map.removeSource(mapId)

  }
  loadRainData(map, dataset)
}
loadRainData的作用为读取对应时间的降雨数据,并将其添加到地图中
                                                            rainPointMap.js
export const loadRainData = (map,dataset) => {
    import(`../data/${dataset}.json`).then((res) => {
        const geojson = res.default
        map.addLayer({
            id: dataset,
            type: 'circle',
            source: {
                type: 'geojson',
                data: geojson,
            },
            paint: {
                'circle-color': {
                    property: dataset,
                    type: 'exponential',
                    stops: [
                        [0, 'rgba(0,0,0,0)'],
                        [0.5, '#9ecae1'],
                        [1, '#08306b'],
                    ],//设置色带
                },
                // 'circle-opacity':0.2
            },
        })
    })

}
5、时间轴控件的完整代码
                                                            mapTimeLine.vue
<template>
  <div class="smTime">
    <sm-time-line
      v-bind="timeLineProps"
      :data="data"
      style="width: 100%"
      @timelinechanged="changed"
      @timelineplaychanged="changed"
      background="rgba(138, 134, 134, 0.8)"
    ></sm-time-line>
  </div>
</template>

<script>
import { changeRainPointMap } from '../components/changeRainPointMap'
export default {
  name: 'mapTimeLine',
  props: ['timeInfo', 'map'],
  data() {
    return {
      timeLineProps: {
        // 动态播放
        autoPlay: true,
        playInterval: 3000,
        lineStyle: {
          color: '#8C8C8C',
          width: 2,
          type: 'solid',
        },
        label: {
          color: 'white',
        },
      },
    }
  },
  computed: {
    data() {
      return this.timeInfo.map((item) => item.time)
    },
  },
  methods: {
    changed(e) {
      // 获取当前日期
      const currentTime = this.timeInfo[e.currentIndex]
      this.$store.commit('changeCurrentTime', currentTime)
      // 加载雨量图
      changeRainPointMap(this.map, currentTime.dataset)
    },
  },
  mounted() {},
}
</script>

<style scoped>
.smTime {
  position: absolute;
  bottom: 0.1rem;
  left: 0.1rem;
  width: 98%;
}
</style>
二、市州降雨统计组件
市州降雨统计组件由三部分组成,对应时间,雨量最大值,雨量最小值,而这三个值由时间轴切换的时间点来动态控制,所以需要先从store中获取最新的时间值timeInfo,再根据timeInfo读取对应的市州降雨量统计数据
完整代码:
<template>
  <div class="mapContent">
    <div class="mapContent_time">{{ timeInfo.time }}</div>
    <div class="mapContent_maxmin">
      <div class="mapContent_max">
        <img src="../image/green.png" class="mapContent_max_img" />
        <div class="mapContent_max_city">{{ maxCity.slice(0, 2) }}</div>
        <div class="mapContent_max_value">{{ maxvalue.toFixed(2) }}</div>
      </div>

      <div class="mapContent_min">
        <img src="../image/red.png" class="mapContent_min_img" />
        <div class="mapContent_min_city">{{ minCity.slice(0, 2) }}</div>
        <div class="mapContent_min_value">{{ minvalue.toFixed(2) }}</div>
      </div>
    </div>
  </div>
</template>

<script>
export default {
  name: 'mapContent',
  data() {
    return {
      maxCity: '成都市',
      maxvalue: 0.17,
      minCity: '甘孜藏族自治州',
      minvalue: 0,
    }
  },
  computed: {
    timeInfo() {
      return this.$store.state.currentTime
    },
  },
  watch: {
//监听时间变化,若发生变化,则调用函数,读取新的统计数据
    'timeInfo.dataset'() {
      this.getData()
    },
  },
  methods: {
//读取市州降雨统计数据
    getData() {
      const dataset = this.timeInfo.dataset
      import(`../data/city${dataset.slice(1, 7)}.json`).then((res) => {
        const avgData = res.default.map((item)=>item.avg)

        //查询雨量最大值
        this.maxvalue = Math.max(...avgData)
        //查询雨量最大值对应的索引
        let maxindex = avgData.findIndex((item) => {
          return this.maxvalue == item
        })
        //查询雨量最大值对应的市州
        this.maxCity = res.default[maxindex].city

        //查询雨量最小值
        this.minvalue = Math.min(...avgData)
        //查询雨量最小值对应的索引
        let minindex = avgData.findIndex((item) => {
          return this.minvalue == item
        })
        //查询雨量最小值对应的市州
        this.minCity = res.default[minindex].city
      })
    },
  },
  mounted() {},
}
</script>

<style scoped>
.mapContent {
  position: absolute;
  top: 1rem;
  right: 0.2rem;
  background-color: rgba(138, 134, 134, 0.8);
  border-radius: 0.1rem;
  color: rgb(243, 240, 240);
  text-align: center;
  font-size: 0.15rem;
  padding: 0.05rem;
}
.mapContent_time {
  font-size: 0.15rem;
  text-align: left;
  font-weight: lighter;
}
.mapContent_maxmin {
  display: flex;
}
.mapContent_max {
  margin-right: 0.1rem;
}
.mapContent_max_img,
.mapContent_min_img {
  height: 0.15rem;
  width: .7rem;
}
.mapContent_max_city,
.mapContent_min_city {
  font-weight: bold;
}
.mapContent_max_value {
  color: rgb(134, 221, 134);
}
.mapContent_min_value {
  color: rgb(224, 142, 142);
}
</style>
完整项目代码可在github上获取:GitHub - mosuiqin/weather: 利用supermap iclient for mapboxgl 完成简单的气象可视化


 1315
1315


 被折叠的 条评论
为什么被折叠?
被折叠的 条评论
为什么被折叠?
 到【灌水乐园】发言


