


目录
本节将完成两部分内容,页面整体布局和天地图加载。
一、页面布局
1、新建homeView.vue
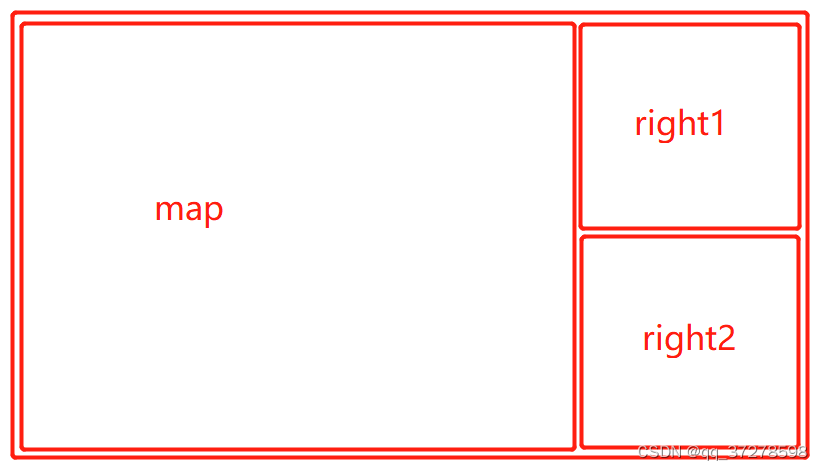
对于webgis开发来说,页面布局是整个项目的基础,能够更为完善的展示后续的功能。整个页面分为三个部分,左侧地图展示部分,右侧小地图展示和柱状图。
在views下面新建homeView.vue,命名最好使用驼峰命名,写入下列代码,得到webgis的界面
                                                               homeView.vue
<template>
  <div class="wrapper">
    <div class="right">
    </div>
    <div class="left">
      <div class="left1"></div>
      <div class="left2"></div>
    </div>
  </div>
</template>

<script>

</script>

<style scoped>
.wrapper {
  height: 98%;
  width: 99%;
  margin: 0.5%;
  display: flex;
  flex-direction: row;
}
.right {
  flex: 1;
}
.left {
  width: 34.5%;
  margin-left: 0.5%;
}
</style>
2、添加边框
这里有两种方式给div添加边框
a.使用超图提供的边框组件来进行添加,共有13种边框样式可共选取,本项目选取的是边框样式1
<sm-border type="border1"></sm-border>具体参数设置可参考:边框 | Vue-iClient-MapboxGL
b.添加边框图片,使用css的边框样式直接加载
.right {
  border-width: 0.12rem;
  border-image: url('../image/border.png') 12 fill / 1 / 0 stretch;
  border-style: solid;
}
注:
- `url('../image/border.png')`:这是指定边框图片的路径;
- `12`:表示边框图片的上、右、下、左四个边框都会被切割为 `12` 个像素。
- `fill`:表示边框图片会填充整个边框区域,而不会被拉伸或平铺。
- `/ 1`:表示边框图片的宽度为 `1` 个单位,具体单位可以是像素、百分比等。
- `/ 0`:表示边框图片的外延为 `0` 个单位,具体单位可以是像素、百分比等。外延值用于控制边框图片与元素内容之间的间距。
- `stretch`:表示边框图片会被拉伸以填充整个边框区域,而不会被平铺。
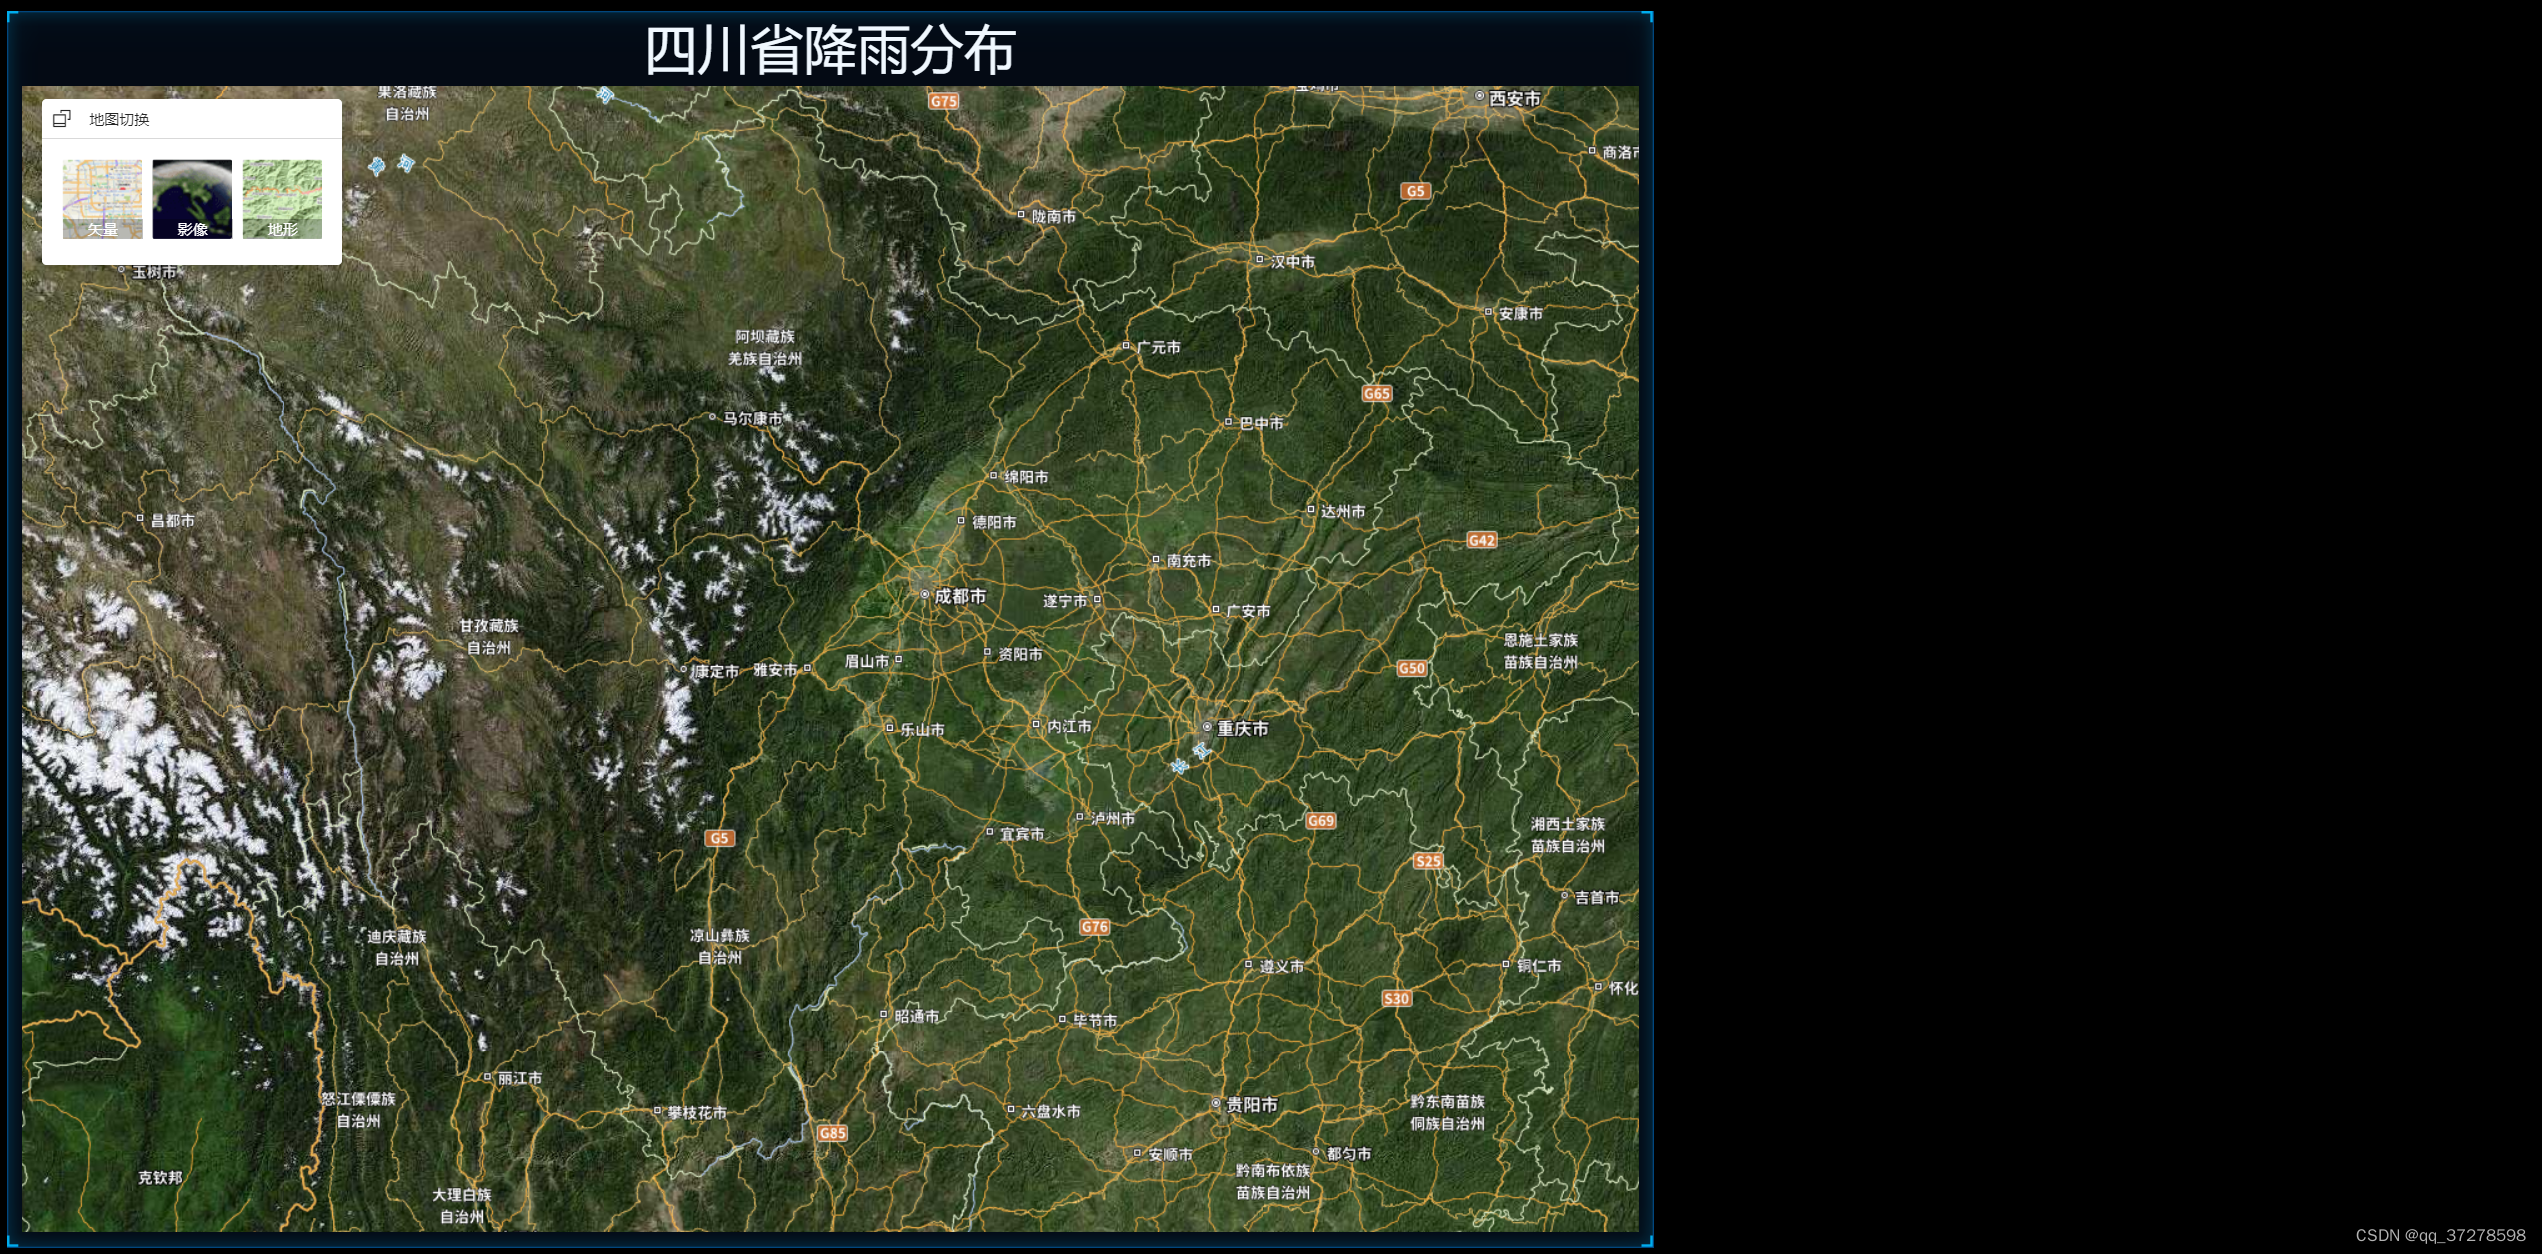
二、天地图加载
1、新建mapView.vue组件
a.添加标题,并对其设置样式
                                                                mapView.vue
<template>
  <div class="mapWrapper">
    <div class="title">四川省降雨分布</div>
  </div>
</template>


<style scoped>
.title {
  height: 5%;
  font-size: 0.4rem;
  color: aliceblue;
  line-height: 0.3rem;
  text-align: center;
}
</style>
b.加载天地图,有两种方式可以进行添加
①使用超图的<sm-web-map>组件,注意需使用load方法获取到map属性,便于后续对地图进行其他操作
                                                                mapView.vue
<template>
  <div class="mapWrapper">
    <div class="title">四川省降雨分布</div>
    <sm-web-map :map-options="mapoptions" @load="load">
    </sm-web-map>
  </div>
</template>

<script>
export default {
  name: 'mapView',
  data() {
    return {
      mapoptions: {
        center: [103.24318, 30.08141],//中心点
        zoom: 6,//地图初始加载缩放级别
        style: {
          version: 8,
          sources: {
            baseLayer: {
              type: 'raster',//数据类型
              tiles: [
                'https://t0.tianditu.gov.cn/img_w/wmts?tk=1d109683f4d84198e37a38c442d68311&service=WMTS&request=GetTile&version=1.0.0&style=default&tilematrixSet=w&format=tiles&width=256&height=256&layer=img&tilematrix={z}&tilerow={y}&tilecol={x}',
              ],
              tileSize: 256,
            },
            labelLayer: {
              type: 'raster',
              tiles: [
                'https://t0.tianditu.gov.cn/cia_w/wmts?tk=1d109683f4d84198e37a38c442d68311&service=WMTS&request=GetTile&version=1.0.0&style=default&tilematrixSet=w&format=tiles&width=256&height=256&layer=cia&tilematrix={z}&tilerow={y}&tilecol={x}',
              ],
              tileSize: 256,
            },
          },
          layers: [
            {
              id: 'baseLayer',
              type: 'raster',
              source: 'baseLayer',
              minzoom: 0,//最小缩放级别
              maxzoom: 18,//最大缩放级别
            },
            {
              id: 'labelLayer',
              type: 'raster',
              source: 'labelLayer',
              minzoom: 0,
              maxzoom: 18,
            },
          ],
        },
        renderWorldCopies: false,
      },
      map: null,
    },
    methods: {
        load(e) {
          this.map = e.map
        },
    }
}
</script>

<style scoped>
.sm-component-web-map {
  height: 95%;
}
</style>
具体参数可参考:地图组件 | Vue-iClient-MapboxGL
②使用mapboxgl直接加载地图
                                                                mapView.vue
<template>
  <div class="mapWrapper">
    <div id="map"></div>
  </div>
</template>

<script>
export default {
  name: 'mapView',
    data() {
    return {
        mapoptions:{
        container:'map', // container id
        …………
        …………
      },
        map:null
    }
  },
  methods: {
    init() {
      this.map=new mapboxgl.Map(this.mapoptions)
    },
  },
  mounted(){
    this.init()
  }}
</script>
2、引入mapView.vue组件
                                                                homeView.vue
<template>
  <div class="wrapper">
    <div class="right">
      <mapView />
    </div>
    <div class="left">
      <div class="left1"></div>
      <div class="left2"></div>
    </div>
  </div>
</template>


<script>
import mapView from './mapView.vue'

export default {
  name: 'Home',
  components: { mapView },
}
</script>
3、添加地图切换控件
具体参数可参考:地图切换 | Vue-iClient-MapboxGL
<sm-tdt-map-switcher position="top-left" :data="{tk:'1d109683f4d84198e37a38c442d68311'}" :collapsed="false"></sm-tdt-map-switcher>
4、查看运行效果
完整项目代码可在github上获取:GitHub - mosuiqin/weather: 利用supermap iclient for mapboxgl 完成简单的气象可视化


 1878
1878


 被折叠的 条评论
为什么被折叠?
被折叠的 条评论
为什么被折叠?
 到【灌水乐园】发言


