


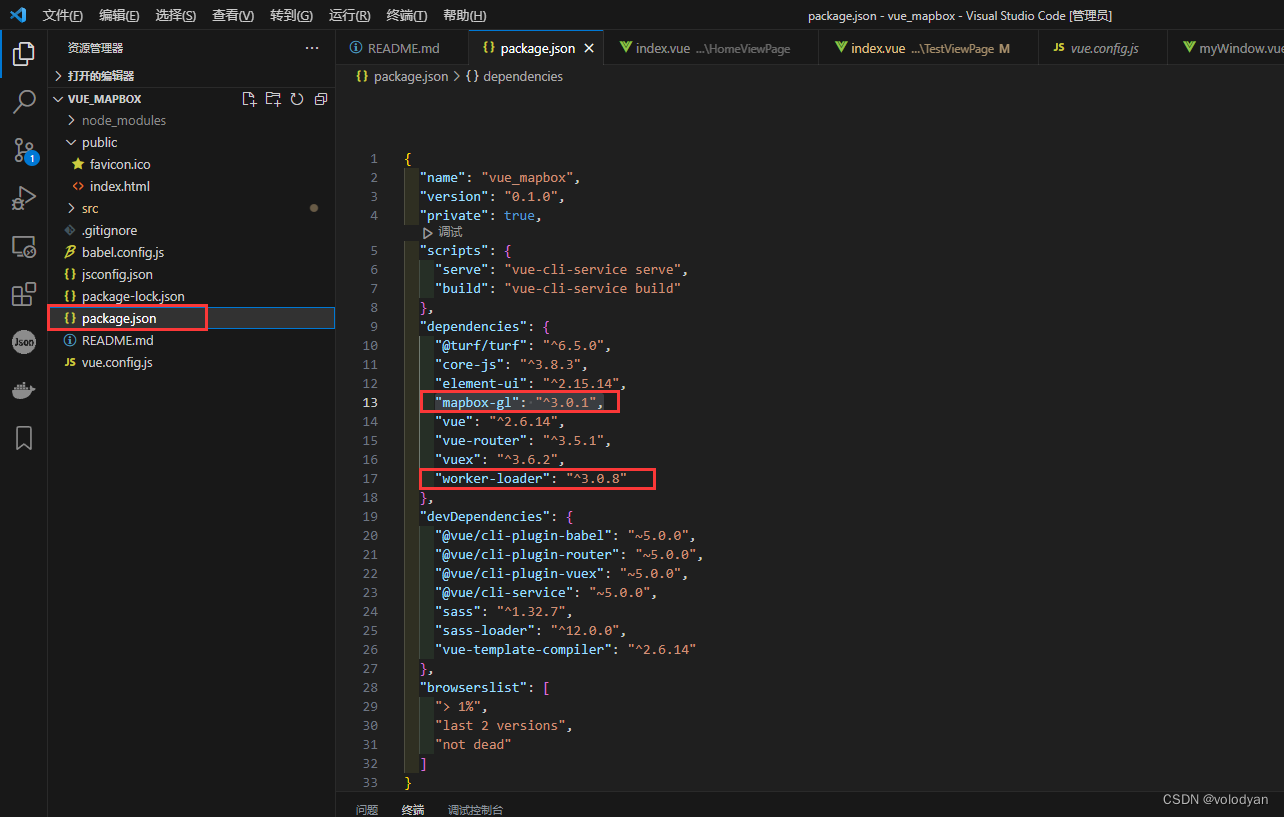
1.安装mapbox
这里安装的是"mapbox-gl": "^3.0.1",
npm install --save mapbox-gl2.安装worker-loader
npm install worker-loader --save-dev配置vue.config.js
const { defineConfig } = require('@vue/cli-service')
module.exports = defineConfig({
  transpileDependencies: true,
  chainWebpack: config => {
    config.module
      .rule('worker')
      .test(/\.worker\.js$/)            // 文件名必须要xxx.worker.js
      .use('worker')
      .loader('worker-loader')
  }
})

3.引入mapbox和worker-loader
import mapboxgl from "mapbox-gl";
import "mapbox-gl/dist/mapbox-gl.css";
import MapboxWorker from "worker-loader!mapbox-gl/dist/mapbox-gl-csp-worker"; // Load worker code separately with worker-loader
mapboxgl.workerClass = MapboxWorker; // Wire up loaded worker to be used instead of the default
4.测试完整代码
<template>
<div class="HomeViewPage">
<div ref="MyMapContainer" id="MyMapContainer"></div>
<div class="Selectbox">
<el-select
v-model="SelectValue"
placeholder="请选择"
@change="ChangeMapType"
>
<el-option
v-for="item in MapList"
:key="item.layerId"
:label="item.name"
:value="item.layerId"
>
</el-option>
</el-select>
</div>
</div>
</template>
<script>
import mapboxgl from "mapbox-gl";
import "mapbox-gl/dist/mapbox-gl.css";
import MapboxWorker from "worker-loader!mapbox-gl/dist/mapbox-gl-csp-worker"; // Load worker code separately with worker-loader
mapboxgl.workerClass = MapboxWorker; // Wire up loaded worker to be used instead of the default
export default {
name: "HomeViewPage",
components: {},
data() {
return {
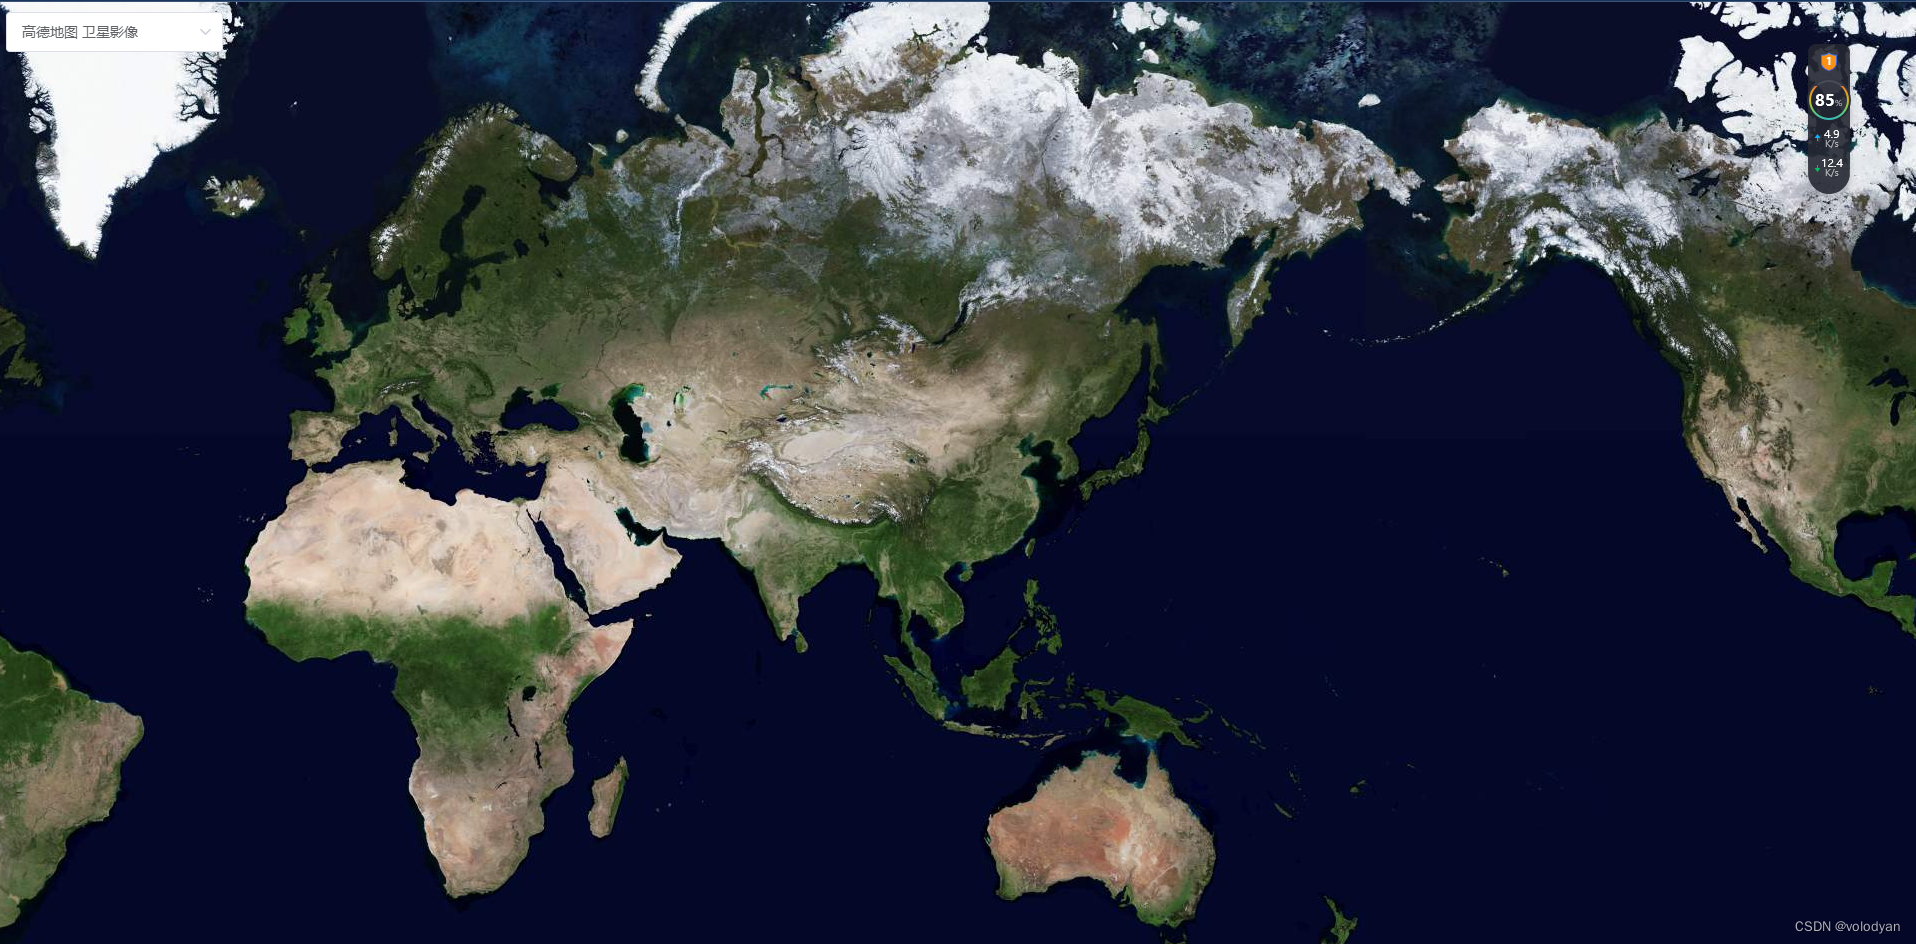
MapList: [
{ name: "高德地图 卫星影像", layerId: "gd-satellite" },
{ name: "高德地图 矢量地图", layerId: "gd-vector" },
{ name: "天地图 矢量注记", layerId: "tian-cvaw" },
{ name: "天地图 影像注记", layerId: "tian-ciaw" },
{ name: "天地图 卫星影像", layerId: "tian-satellite" },
{ name: "天地图 矢量地图", layerId: "tian-vector" },
///
{ name: "天地图 地形晕渲", layerId: "tian-terw" },
{ name: "天地图 地形注记", layerId: "tian-ctaw" },
{ name: "天地图 全球境界", layerId: "tian-ibow" },
// { name: "天地图 矢量英文注记", layerId: "tian-evaw" },
// { name: "天地图 影像英文注记", layerId: "tian-eiaw" },
///
{ name: "bingmap 卫星影像", layerId: "bing-satellite" },
{ name: "bingmap 矢量地图", layerId: "bing-vector" },
{ name: "mapbox 卫星影像", layerId: "mapbox-satellite" },
],
SelectValue: "gd-satellite",
};
},
mounted() {
this.$nextTick(() => {
this.InitMap();
});
},
methods: {
InitMap() {
const map = new mapboxgl.Map({
container: this.$refs.MyMapContainer,
style: {
version: 8,
sources: {
"gd-satellite": {
type: "raster",
tiles: [
// 高德地图 卫星影像
"http://wprd04.is.autonavi.com/appmaptile?x={x}&y={y}&z={z}&lang=zh_cn&size=1&scl=1&style=6",
],
tileSize: 256,
},
"gd-vector": {
type: "raster",
tiles: [
// 高德地图 矢量地图
"http://wprd04.is.autonavi.com/appmaptile?x={x}&y={y}&z={z}&lang=zh_cn&size=1&scl=2&style=7",
],
tileSize: 256,
},
"tian-cvaw": {
type: "raster",
tiles: [
// 天地图 矢量注记
"http://t0.tianditu.gov.cn/cva_w/wmts?tk=1883a2da124fe27b3c281f9d65356e82&SERVICE=WMTS&REQUEST=GetTile&VERSION=1.0.0&LAYER=cva&STYLE=default&TILEMATRIXSET=w&TILEMATRIX={z}&TILEROW={y}&TILECOL={x}&FORMAT=tiles",
],
tileSize: 256,
},
"tian-ciaw": {
type: "raster",
tiles: [
// 天地图 影像注记
"http://t0.tianditu.gov.cn/cia_w/wmts?tk=1883a2da124fe27b3c281f9d65356e82&SERVICE=WMTS&REQUEST=GetTile&VERSION=1.0.0&LAYER=cia&STYLE=default&TILEMATRIXSET=w&TILEMATRIX={z}&TILEROW={y}&TILECOL={x}&FORMAT=tiles",
],
tileSize: 256,
},
"tian-satellite": {
type: "raster",
tiles: [
// 天地图 卫星影像
"http://t0.tianditu.gov.cn/img_w/wmts?tk=1883a2da124fe27b3c281f9d65356e82&SERVICE=WMTS&REQUEST=GetTile&VERSION=1.0.0&LAYER=img&STYLE=default&TILEMATRIXSET=w&TILEMATRIX={z}&TILEROW={y}&TILECOL={x}&FORMAT=tiles",
],
tileSize: 256,
},
"tian-vector": {
type: "raster",
tiles: [
// 天地图 矢量地图
"http://t0.tianditu.gov.cn/vec_w/wmts?tk=1883a2da124fe27b3c281f9d65356e82&SERVICE=WMTS&REQUEST=GetTile&VERSION=1.0.0&LAYER=vec&STYLE=default&TILEMATRIXSET=w&TILEMATRIX={z}&TILEROW={y}&TILECOL={x}&FORMAT=tiles",
],
tileSize: 256,
},
"tian-terw": {
type: "raster",
tiles: [
// 天地图 地形晕渲
"http://t0.tianditu.gov.cn/ter_w/wmts?tk=1883a2da124fe27b3c281f9d65356e82&SERVICE=WMTS&REQUEST=GetTile&VERSION=1.0.0&LAYER=ter&STYLE=default&TILEMATRIXSET=w&TILEMATRIX={z}&TILEROW={y}&TILECOL={x}&FORMAT=tiles",
],
tileSize: 256,
},
"tian-ctaw": {
type: "raster",
tiles: [
// 天地图 地形注记
"http://t0.tianditu.gov.cn/cta_w/wmts?tk=1883a2da124fe27b3c281f9d65356e82&SERVICE=WMTS&REQUEST=GetTile&VERSION=1.0.0&LAYER=cta&STYLE=default&TILEMATRIXSET=w&TILEMATRIX={z}&TILEROW={y}&TILECOL={x}&FORMAT=tiles",
],
tileSize: 256,
},
"tian-ibow": {
type: "raster",
tiles: [
// 天地图 全球境界
"http://t0.tianditu.gov.cn/ibo_w/wmts?tk=1883a2da124fe27b3c281f9d65356e82&SERVICE=WMTS&REQUEST=GetTile&VERSION=1.0.0&LAYER=ibo&STYLE=default&TILEMATRIXSET=w&TILEMATRIX={z}&TILEROW={y}&TILECOL={x}&FORMAT=tiles",
],
tileSize: 256,
},
// "tian-evaw": {
// type: "raster",
// tiles: [
// // 天地图 矢量英文注记
// "http://t0.tianditu.gov.cn/eva_w/wmts?tk=1883a2da124fe27b3c281f9d65356e82&SERVICE=WMTS&REQUEST=GetTile&VERSION=1.0.0&LAYER=eva&STYLE=default&TILEMATRIXSET=w&TILEMATRIX={z}&TILEROW={y}&TILECOL={x}&FORMAT=tiles",
// ],
// tileSize: 256,
// },
// "tian-eiaw": {
// type: "raster",
// tiles: [
// // 天地图 影像英文注记
// "http://t0.tianditu.gov.cn/eia_w/wmts?tk=1883a2da124fe27b3c281f9d65356e82&SERVICE=WMTS&REQUEST=GetTile&VERSION=1.0.0&LAYER=eia&STYLE=default&TILEMATRIXSET=w&TILEMATRIX={z}&TILEROW={y}&TILECOL={x}&FORMAT=tiles",
// ],
// tileSize: 256,
// },
"bing-satellite": {
type: "raster",
tiles: [
// bingmap 卫星影像
"http://ak.dynamic.t0.tiles.virtualearth.net/comp/ch/{quadkey}?mkt=zh-CN&it=A,G,L&og=819&n=z",
],
tileSize: 256,
},
"bing-vector": {
type: "raster",
tiles: [
// bingmap 矢量地图
"http://ak.dynamic.t0.tiles.virtualearth.net/comp/ch/{quadkey}?mkt=zh-CN&it=G,L&shading=hill&og=819&n=z",
],
tileSize: 256,
},
"mapbox-satellite": {
type: "raster",
tiles: [
// mapbox 卫星影像
"https://api.mapbox.com/v4/mapbox.satellite/{z}/{x}/{y}.png?sku=101wZp4uNMRnl&access_token=pk.eyJ1Ijoidm9sb2R5YW4iLCJhIjoiY2xwYnc4enk0MGdhaTJpcW9odWppNXcwOSJ9.g598xmjqTXnpvZ1FztOsGg",
],
tileSize: 256,
},
},
layers: [
{
id: "gd-satellite",
type: "raster",
source: "gd-satellite",
layout: {
visibility: "visible",
},
minzoom: 0,
maxzoom: 22,
},
{
id: "gd-vector",
type: "raster",
source: "gd-vector",
layout: {
visibility: "none",
},
minzoom: 0,
maxzoom: 22,
},
{
id: "tian-cvaw",
type: "raster",
source: "tian-cvaw",
layout: {
visibility: "none",
},
minzoom: 0,
maxzoom: 22,
},
{
id: "tian-ciaw",
type: "raster",
source: "tian-ciaw",
layout: {
visibility: "none",
},
minzoom: 0,
maxzoom: 22,
},
{
id: "tian-satellite",
type: "raster",
source: "tian-satellite",
layout: {
visibility: "none",
},
minzoom: 0,
maxzoom: 22,
},
{
id: "tian-vector",
type: "raster",
source: "tian-vector",
layout: {
visibility: "none",
},
minzoom: 0,
maxzoom: 22,
},
/
{
id: "tian-terw",
type: "raster",
source: "tian-terw",
layout: {
visibility: "none",
},
minzoom: 0,
maxzoom: 22,
},
{
id: "tian-ctaw",
type: "raster",
source: "tian-ctaw",
layout: {
visibility: "none",
},
minzoom: 0,
maxzoom: 22,
},
{
id: "tian-ibow",
type: "raster",
source: "tian-ibow",
layout: {
visibility: "none",
},
minzoom: 0,
maxzoom: 22,
},
// {
// id: "tian-evaw",
// type: "raster",
// source: "tian-evaw",
// layout: {
// visibility: "none",
// },
// minzoom: 0,
// maxzoom: 22,
// },
// {
// id: "tian-eiaw",
// type: "raster",
// source: "tian-eiaw",
// layout: {
// visibility: "none",
// },
// minzoom: 0,
// maxzoom: 22,
// },
/
{
id: "bing-satellite",
type: "raster",
source: "bing-satellite",
layout: {
visibility: "none",
},
minzoom: 0,
maxzoom: 22,
},
{
id: "bing-vector",
type: "raster",
source: "bing-vector",
layout: {
visibility: "none",
},
minzoom: 0,
maxzoom: 22,
},
{
id: "mapbox-satellite",
type: "raster",
source: "mapbox-satellite",
layout: {
visibility: "none",
},
minzoom: 0,
maxzoom: 22,
},
],
}, // mapbox底图
center: [108, 35], // 初始化中心点
zoom: 2, // 初始化层级
// projection: "globe",
language: "zh-Hans",
// pitch: 65,
// bearing: -180,
//interactive: false,
});
this.map = map;
map.on("webglcontextrestored", () => {
console.log("A webglcontextrestored event occurred.");
});
map.on("webglcontextlost", () => {
console.log("A webglcontextlost event occurred.");
});
},
ChangeMapType(layerId) {
this.MapList.forEach((item, index) => {
const showStatus = item.layerId === layerId ? "visible" : "none";
this.map.setLayoutProperty(item.layerId, "visibility", showStatus);
});
},
},
};
</script>
<style lang="scss" scoped>
.HomeViewPage {
padding: 0;
margin: 0;
width: 100%;
height: 100%;
position: relative;
#MyMapContainer {
width: 100%;
height: 100%;
::v-deep .mapboxgl-ctrl {
display: none !important;
}
}
.Selectbox {
position: absolute;
top: 10px;
left: 10px;
}
}
</style>

5.安装npm install @turf/turf
npm install @turf/turf引入
import * as turf from '@turf/turf'6.综合示例完整代码
index.vue
<template>
<div class="TestViewPage">
<div ref="BasicMapboxRef" class="BasicMapbox"></div>
</div>
</template>
<script>
import mapboxgl from "mapbox-gl";
import "mapbox-gl/dist/mapbox-gl.css";
import MapboxWorker from "worker-loader!mapbox-gl/dist/mapbox-gl-csp-worker"; // Load worker code separately with worker-loader
mapboxgl.workerClass = MapboxWorker; // Wire up loaded worker to be used instead of the default
import * as turf from "@turf/turf";
import { VmInstanceClass, VmInstance } from "./Cpt/index";
export default {
name: "TestViewPage",
data() {
return {};
},
mounted() {
this.Init();
},
methods: {
// 初始化
Init() {
const CenterPoint = [108.97274577932018, 19.15470548802415];
const monument = [108.97274577932018, 19.15470548802415];
const map = new mapboxgl.Map({
container: this.$refs.BasicMapboxRef,
//style: 'mapbox://styles/mapbox/light-v11',
style: {
version: 8,
sources: {
"gd-satellite": {
type: "raster",
tiles: [
// 高德地图 卫星影像
"http://wprd04.is.autonavi.com/appmaptile?x={x}&y={y}&z={z}&lang=zh_cn&size=1&scl=1&style=6",
],
tileSize: 256,
},
"gd-vector": {
type: "raster",
tiles: [
// 高德地图 矢量地图
"http://wprd04.is.autonavi.com/appmaptile?x={x}&y={y}&z={z}&lang=zh_cn&size=1&scl=2&style=7",
],
tileSize: 256,
},
"tian-cvaw": {
type: "raster",
tiles: [
// 天地图 矢量注记
"http://t0.tianditu.gov.cn/cva_w/wmts?tk=1883a2da124fe27b3c281f9d65356e82&SERVICE=WMTS&REQUEST=GetTile&VERSION=1.0.0&LAYER=cva&STYLE=default&TILEMATRIXSET=w&TILEMATRIX={z}&TILEROW={y}&TILECOL={x}&FORMAT=tiles",
],
tileSize: 256,
},
"tian-ciaw": {
type: "raster",
tiles: [
// 天地图 影像注记
"http://t0.tianditu.gov.cn/cia_w/wmts?tk=1883a2da124fe27b3c281f9d65356e82&SERVICE=WMTS&REQUEST=GetTile&VERSION=1.0.0&LAYER=cia&STYLE=default&TILEMATRIXSET=w&TILEMATRIX={z}&TILEROW={y}&TILECOL={x}&FORMAT=tiles",
],
tileSize: 256,
},
"tian-satellite": {
type: "raster",
tiles: [
// 天地图 卫星影像
"http://t0.tianditu.gov.cn/img_w/wmts?tk=1883a2da124fe27b3c281f9d65356e82&SERVICE=WMTS&REQUEST=GetTile&VERSION=1.0.0&LAYER=img&STYLE=default&TILEMATRIXSET=w&TILEMATRIX={z}&TILEROW={y}&TILECOL={x}&FORMAT=tiles",
],
tileSize: 256,
},
"tian-vector": {
type: "raster",
tiles: [
// 天地图 矢量地图
"http://t0.tianditu.gov.cn/vec_w/wmts?tk=1883a2da124fe27b3c281f9d65356e82&SERVICE=WMTS&REQUEST=GetTile&VERSION=1.0.0&LAYER=vec&STYLE=default&TILEMATRIXSET=w&TILEMATRIX={z}&TILEROW={y}&TILECOL={x}&FORMAT=tiles",
],
tileSize: 256,
},
"tian-terw": {
type: "raster",
tiles: [
// 天地图 地形晕渲
"http://t0.tianditu.gov.cn/ter_w/wmts?tk=1883a2da124fe27b3c281f9d65356e82&SERVICE=WMTS&REQUEST=GetTile&VERSION=1.0.0&LAYER=ter&STYLE=default&TILEMATRIXSET=w&TILEMATRIX={z}&TILEROW={y}&TILECOL={x}&FORMAT=tiles",
],
tileSize: 256,
},
"tian-ctaw": {
type: "raster",
tiles: [
// 天地图 地形注记
"http://t0.tianditu.gov.cn/cta_w/wmts?tk=1883a2da124fe27b3c281f9d65356e82&SERVICE=WMTS&REQUEST=GetTile&VERSION=1.0.0&LAYER=cta&STYLE=default&TILEMATRIXSET=w&TILEMATRIX={z}&TILEROW={y}&TILECOL={x}&FORMAT=tiles",
],
tileSize: 256,
},
"tian-ibow": {
type: "raster",
tiles: [
// 天地图 全球境界
"http://t0.tianditu.gov.cn/ibo_w/wmts?tk=1883a2da124fe27b3c281f9d65356e82&SERVICE=WMTS&REQUEST=GetTile&VERSION=1.0.0&LAYER=ibo&STYLE=default&TILEMATRIXSET=w&TILEMATRIX={z}&TILEROW={y}&TILECOL={x}&FORMAT=tiles",
],
tileSize: 256,
},
"bing-satellite": {
type: "raster",
tiles: [
// bingmap 卫星影像
"http://ak.dynamic.t0.tiles.virtualearth.net/comp/ch/{quadkey}?mkt=zh-CN&it=A,G,L&og=819&n=z",
],
tileSize: 256,
},
"bing-vector": {
type: "raster",
tiles: [
// bingmap 矢量地图
"http://ak.dynamic.t0.tiles.virtualearth.net/comp/ch/{quadkey}?mkt=zh-CN&it=G,L&shading=hill&og=819&n=z",
],
tileSize: 256,
},
"mapbox-satellite": {
type: "raster",
tiles: [
// mapbox 卫星影像
"https://api.mapbox.com/v4/mapbox.satellite/{z}/{x}/{y}.png?sku=101wZp4uNMRnl&access_token=pk.eyJ1Ijoidm9sb2R5YW4iLCJhIjoiY2xwYnc4enk0MGdhaTJpcW9odWppNXcwOSJ9.g598xmjqTXnpvZ1FztOsGg",
//'https://api.mapbox.com/v4/mapbox.satellite/{z}/{x}/{y}.png?access_token=pk.eyJ1Ijoidm9sb2R5YW4iLCJhIjoiY2xwYnc4enk0MGdhaTJpcW9odWppNXcwOSJ9.g598xmjqTXnpvZ1FztOsGg'
],
tileSize: 256,
},
},
layers: [
{
id: "gd-satellite",
type: "raster",
source: "gd-satellite",
layout: {
visibility: "none",
},
minzoom: 0,
maxzoom: 22,
},
{
id: "gd-vector",
type: "raster",
source: "gd-vector",
layout: {
visibility: "none",
},
minzoom: 0,
maxzoom: 22,
},
{
id: "tian-cvaw",
type: "raster",
source: "tian-cvaw",
layout: {
visibility: "none",
},
minzoom: 0,
maxzoom: 22,
},
{
id: "tian-ciaw",
type: "raster",
source: "tian-ciaw",
layout: {
visibility: "none",
},
minzoom: 0,
maxzoom: 22,
},
{
id: "tian-satellite",
type: "raster",
source: "tian-satellite",
layout: {
visibility: "none",
},
minzoom: 0,
maxzoom: 22,
},
{
id: "tian-vector",
type: "raster",
source: "tian-vector",
layout: {
visibility: "none",
},
minzoom: 0,
maxzoom: 22,
},
/
{
id: "tian-terw",
type: "raster",
source: "tian-terw",
layout: {
visibility: "none",
},
minzoom: 0,
maxzoom: 22,
},
{
id: "tian-ctaw",
type: "raster",
source: "tian-ctaw",
layout: {
visibility: "none",
},
minzoom: 0,
maxzoom: 22,
},
{
id: "tian-ibow",
type: "raster",
source: "tian-ibow",
layout: {
visibility: "none",
},
minzoom: 0,
maxzoom: 22,
},
{
id: "bing-satellite",
type: "raster",
source: "bing-satellite",
layout: {
visibility: "none",
},
minzoom: 0,
maxzoom: 22,
},
{
id: "bing-vector",
type: "raster",
source: "bing-vector",
layout: {
visibility: "none",
},
minzoom: 0,
maxzoom: 22,
},
{
id: "mapbox-satellite",
type: "raster",
source: "mapbox-satellite",
layout: {
visibility: "visible",
},
minzoom: 0,
maxzoom: 22,
},
],
glyphs: "mapbox://fonts/mapbox/{fontstack}/{range}.pbf", //"glyphs":"https://fonts.openmaptiles.org/{fontstack}/{range}.pbf"//
},
language: "zh-Hans",
center: CenterPoint,
zoom: 11, ///15,
});
window.map = map;
// 地图回调事件
map.on("load", (e) => {
console.log("地图加载完成", e);
let VW = VmInstance({ a: 1, b: 2 }); //new VmInstanceClass({a:1,b:2}).InitVmInstanceClassFun()
const MyCustomMapboxPopup = new mapboxgl.Popup({
offset: 25,
closeButton: false,
closeOnClick: true,
});
window.MyCustomMapboxPopup = MyCustomMapboxPopup;
MyCustomMapboxPopup.on("close", (e) => {
console.log("监听弹窗关闭");
});
MyCustomMapboxPopup.on("open", (e) => {
console.log("监听弹窗打开");
});
const el = document.createElement("div");
el.id = "marker";
el.className = "MarkerDivClass";
new mapboxgl.Marker(el)
.setLngLat(monument)
.setPopup(MyCustomMapboxPopup.setDOMContent(VW))
.addTo(map);
this.LineFn(); //动态线
this.AggregationEffectFun(); //聚合效果
this.DrawShadowAreaFun(); //绘制阴影面积
this.CustomBuilingFun(); //自定义建筑体
this.ColorGradientLineFun(); //绘制line且颜色渐变
this.DrawImgFun(); //绘制图片
this.DrawLinesFun(); //绘制多条曲线
this.DrawAnimationLinesFun(); ///绘制动态线
this.DrawAnimationPointsFun(); //动画扩散点
let PositionList = [];
var hoveredStateId = null;
//鼠标放上去
map.on("mousemove", "maine", (e) => {
if (hoveredStateId) {
map.setFeatureState(
{ source: "maine", id: hoveredStateId },
{ hover: false }
);
}
hoveredStateId = e.features[0].id;
map.setFeatureState(
{ source: "maine", id: hoveredStateId },
{ hover: true }
);
});
// 鼠标移开
map.on("mouseleave", "maine", (e) => {
if (hoveredStateId) {
map.setFeatureState(
{ source: "maine", id: hoveredStateId },
{ hover: false }
);
}
hoveredStateId = null;
});
var popup2 = new mapboxgl.Popup({
closeButton: false,
closeOnClick: false,
});
map.on("mouseenter", "clusters", (e) => {
const features = map.queryRenderedFeatures(e.point);
if (features.length) {
map.getCanvas().style.cursor = "pointer";
var coordinates = e.features[0].geometry.coordinates.slice();
var popupName = e.features[0].properties.name;
var popupvalue = e.features[0].properties.value;
const contain = `
<div class="popupClass">
<div class="popupClass-title">
<span>名称:</span>
<span>${popupName}</span>
</div>
<div class="popupClass-title">
<span>值:</span>
<span>${popupvalue}</span></div>
</div>
`;
popup2.setLngLat(coordinates).setHTML(contain).addTo(map);
}
});
map.on("mouseleave", "clusters", (e) => {
map.getCanvas().style.cursor = "";
popup2.remove();
});
map.on("mouseenter", "pointsImg", (e) => {
const features = map.queryRenderedFeatures(e.point);
if (features.length) {
map.getCanvas().style.cursor = "pointer";
var coordinates = e.features[0].geometry.coordinates.slice();
var popupName = e.features[0].properties.name;
var popupvalue = e.features[0].properties.value;
const contain = `
<div class="popupClass">
<div class="popupClass-title">
<span>名称:</span>
<span>${popupName}</span>
</div>
<div class="popupClass-title">
<span>值:</span>
<span>${popupvalue}</span></div>
</div>
`;
popup2.setLngLat(coordinates).setHTML(contain).addTo(map);
}
});
map.on("mouseleave", "pointsImg", (e) => {
map.getCanvas().style.cursor = "";
popup2.remove();
});
//点击定位点弹出内容框
map.on("click", "points", (e) => {
// map.setCenter()
new mapboxgl.Popup()
.setLngLat(e.lngLat)
.setHTML(e.features[0].properties.name)
.addTo(map);
});
map.on("click", (e) => {
console.log(`click---e`, e);
PositionList.push([e.lngLat.lng, e.lngLat.lat]);
console.log(`PositionList`, PositionList);
console.log(`map.getCenter()`, map.getCenter());
// map.setCenter()
return;
var el = document.createElement("div");
el.className = "clickmarker";
el.style.height = "20px";
el.style.width = "20px";
el.style.backgroundColor = "black";
el.addEventListener("click", (e) => {
// Prevent the `map.on('click')` to also be triggered
e.stopPropagation();
console.log("hello");
});
let marker = new mapboxgl.Marker(el).setLngLat(e.lngLat).addTo(map);
});
map.on("styledata", (e) => {
// 发现切换底图之后, 原有点位就会丢失,重新添加回来
//console.log('更换底图后,样式加载成功' )
});
map.on("error", (data) => {
// console.log("地图error回调触发:", data);
});
map.on("zoomend", () => {
let currentZoom = map.getZoom();
// console.log("缩放层级 ", currentZoom);
});
//
});
},
// 一条线绘制 线颜色渐变
LineFn() {
if (map.getSource("lineOne")) {
map.removeLayer("lineOne");
map.removeSource("lineOne");
}
var routeGeoJson = {
type: "Feature",
geometry: {
type: "LineString",
coordinates: [
[108.839734, 19.045513],
[108.9096, 19.087778],
[109.033196, 19.139681],
[109.11913, 19.255433],
],
},
properties: {},
};
// 添加数据源
map.addSource("lineOne", {
type: "geojson",
lineMetrics: true, // 线渐变必须条件
data: {
type: "Feature",
geometry: {
type: "LineString",
coordinates: [
[108.839734, 19.045513],
[108.9096, 19.087778],
[109.033196, 19.139681],
[109.11913, 19.255433],
],
},
properties: {},
},
});
// 添加一条线
map.addLayer({
id: "lineOne",
source: "lineOne",
type: "line",
layout: {
visibility: "visible",
"line-join": "round",
"line-cap": "round",
},
paint: {
"line-color": "#fff",
"line-width": 15,
// 'line-gradient': ['interpolate',['linear'],['line-progress'],0,'blue',0.1,'royalblue',0.3,'cyan',0.5,'lime',0.7,'yellow',1,'red']
},
});
// 线滚动显示效果
var totalTime1 = 0;
var totalTime2 = 5;
// 创建一条线
var lineCount = turf.lineString([
[108.839734, 19.045513],
[108.9096, 19.087778],
[109.033196, 19.139681],
[109.11913, 19.255433],
]);
// 分割线段
var chunk = turf.lineChunk(lineCount, 1, { units: "miles" });
console.log("一条线分割成多段:", chunk);
var colorNum = 0;
var colorList = [
"red",
"rgba(255,255,255,0)",
"blue",
"rgba(255,255,255,0)",
"green",
"rgba(255,255,255,0)",
];
for (let i = 0; i < chunk.features.length; i++) {
var oneMarker = chunk.features[i].geometry.coordinates;
console.log("分割的线段" + oneMarker);
var pageNum = i % 6;
var lineName = "lineAllCount_" + i;
// 绘制渐变的线
this.AddAllLineFn(lineName, chunk.features[i], colorList[pageNum]);
}
//定时器动态修改线的颜色
setInterval(() => {
colorNum++;
for (let i = 0; i < chunk.features.length; i++) {
var oneMarker = chunk.features[i].geometry.coordinates;
var countNumShow = colorNum % 6;
var pageNum = i % 6;
var lineName = "lineAllCount_" + i;
var totalNum = pageNum - countNumShow;
if (totalNum <= 0) {
map.setPaintProperty(
lineName,
"line-color",
colorList[5 - Math.abs(totalNum)]
);
}
if (totalNum > 0) {
map.setPaintProperty(
lineName,
"line-color",
colorList[totalNum - 1]
);
}
}
// 触发一个显示框的渲染。使用自定义图层时,当图层发生改变,使用此方法去重渲染。
// 在下一个显示框渲染前多次调用此方法也只会渲染一次
map.triggerRepaint();
}, 300);
},
AddAllLineFn(name, source, color) {
// 添加数据源
map.addSource(name, {
type: "geojson",
lineMetrics: true, // 线渐变必须条件
data: source,
});
// 添加一条线
map.addLayer({
id: name,
source: name,
type: "line",
layout: {
visibility: "visible",
"line-join": "round",
"line-cap": "round",
},
paint: {
"line-color": color,
"line-width": 6,
},
});
},
/聚合效果
AggregationEffectFun() {
map.addSource("earthquakes", {
type: "geojson",
data: "https://docs.mapbox.com/mapbox-gl-js/assets/earthquakes.geojson",
cluster: true, //开启聚合效果
});
map.addLayer({
id: "clusters",
type: "circle",
source: "earthquakes",
paint: {
"circle-color": "#51bbd6",
"circle-radius": 20,
},
});
// 文字图层
map.addLayer({
id: "cluster-count",
type: "symbol",
source: "earthquakes",
layout: {
"text-field": "文字图层",
"text-font": ["DIN Offc Pro Medium", "Arial Unicode MS Bold"], //字体
"text-offset": [0, 1.25], //设置图标与图标注相对之间的距离
"text-anchor": "top", //标记文本相对于定位点的位置
"text-size": 22, //字号
},
paint: {
// 绘制类属性
// 文本类属性(需要设置 text-field)
"text-opacity": 1, // 文本的不透明度(可选,取值范围为 0 ~ 1,默认值为 1)
"text-color": "#ff00ff", // 文本的颜色(可选,默认值为 #000000)
"text-halo-color": "rgba(0,0,0,0)", // 文本的光晕颜色(可选,默认值为 rgba(0,0,0,0))
"text-halo-width": 0, // 文本的光晕宽度(可选,值 >= 0,默认值为 0,单位:像素)
"text-halo-blur": 0, // 文本的光晕模糊宽度(可选,值 >= 0,默认值为 0,单位:像素)
"text-translate": [0, 0], // 文本的平移(可选,通过平移 [x, y] 达到一定的偏移量。默认值为 [0, 0],单位:像素。)
"text-translate-anchor": "map", // 文本的平移锚点,即相对的参考物(可选,可选值为 map、viewport,默认为 map)
},
});
},
绘制阴影面积
DrawShadowAreaFun() {
map.addLayer({
id: "maine",
type: "fill",
source: {
type: "geojson",
data: {
type: "Feature",
geometry: {
type: "Polygon",
coordinates: [
[
[108.88608239135675, 19.1398434553587],
[108.92625115356498, 19.142276019403027],
[108.92693779907222, 19.119570694754827],
[108.89912865600621, 19.117462184843347],
[108.8799025817865, 19.118435346606162],
[108.87818596801759, 19.142113849582543],
[108.88608239135675, 19.1398434553587],
],
],
},
id: "3",
},
},
layout: {},
paint: {
"fill-color": "#088",
"fill-opacity": [
"case",
["boolean", ["feature-state", "hover"], false], //判断鼠标移上去显示颜色
1,
0.5,
],
},
});
// map.flyTo({
// center: [108.9011180746175, 19.127966153101667],
// //zoom: 9,
// speed: 0.3,
// easing(t) {
// return t;
// },
// });
},
/自定义建筑体
CustomBuilingFun() {
map.addLayer({
id: "room-extrusion",
type: "fill-extrusion",
source: {
type: "geojson",
data: {
features: [
{
type: "Feature",
properties: {
level: 1,
name: "Bird Exhibit",
height: 160,
base_height: 0,
color: "red",
},
geometry: {
coordinates: [
[
[108.91156272021732, 19.207917124633312],
[108.93399650855417, 19.20719490986758],
[108.96076409691301, 19.207676386730014],
[108.95592043806687, 19.187693912702684],
[108.92813313205727, 19.18360081747511],
[108.90289512017728, 19.18817544662795],
[108.89779653191789, 19.203583788468677],
],
],
type: "Polygon",
},
id: "08a10ab2bf15c4d14669b588062f7f08",
},
{
type: "Feature",
properties: {
level: 1,
name: "Ancient Egypt",
height: 190,
base_height: 0,
color: "blue",
},
geometry: {
coordinates: [
[
[108.84571644647241, 19.207398225961285],
[108.89858815057386, 19.200913871858063],
[108.89755818231208, 19.187620147023196],
[108.86597248895202, 19.207074014326693],
[108.89652821405042, 19.203507644172262],
[108.89481160027975, 19.187620147023196],
[108.8663158117065, 19.185998887618993],
[108.8532695470571, 19.18729589641977],
],
],
type: "Polygon",
},
},
],
type: "FeatureCollection",
},
},
paint: {
"fill-extrusion-color": ["get", "color"],
"fill-extrusion-height": ["get", "height"],
"fill-extrusion-base": ["get", "base_height"],
"fill-extrusion-opacity": 0.5,
},
});
// map.flyTo({
// center: [108.97274577932018,19.15470548802415],
// zoom: 15,
// speed: 0.3,
// easing(t) {
// return t;
// },
//});
},
//绘制line且颜色渐变
ColorGradientLineFun() {
// 添加数据源
map.addSource("ColorGradientLine", {
type: "geojson",
lineMetrics: true, // 线渐变必须条件
data: {
type: "Feature",
geometry: {
type: "LineString",
coordinates: [
[108.96999919728881, 19.065657014245033],
[108.98064220266036, 19.06987532721513],
[108.99300182180076, 19.076040360742084],
[109.01772106008167, 19.082205164878914],
[109.02699077443702, 19.09226303690471],
[109.0342005522707, 19.101022621102516],
[109.04175365285539, 19.11075494853226],
[109.05308330373407, 19.116269679847207],
[109.07162273244649, 19.115945288979063],
[109.1152686698606, 19.11646450055744],
[109.13724132611088, 19.11646450055744],
[109.14925762249686, 19.11386935885227],
[109.16539379192955, 19.109003358361463],
[109.18084331585692, 19.105110454878087],
[109.19251628948837, 19.09180901012317],
[109.1971026715268, 19.071343458858436],
],
},
properties: {},
},
});
map.addLayer({
type: "line",
source: "ColorGradientLine",
id: "ColorGradientLine",
paint: {
"line-color": "red",
"line-width": 5,
"line-gradient": [
"interpolate",
["linear"],
["line-progress"],
0,
"blue",
0.1,
"royalblue",
0.3,
"cyan",
0.5,
"lime",
0.7,
"yellow",
1,
"red",
],
},
layout: {
"line-cap": "round",
"line-join": "round",
},
});
},
/绘制图片
DrawImgFun() {
map.loadImage(require("@/assets/img/爆管-1.png"), (error, image) => {
if (error) throw error;
map.addImage("cat", image);
map.addLayer({
id: "pointsImg",
type: "symbol",
source: {
type: "geojson",
data: {
type: "FeatureCollection",
features: [
{
type: "Feature",
geometry: {
type: "Point",
coordinates: [108.87142729268334, 19.27490629947056],
},
properties: {
name: "坐标点1",
},
},
{
type: "Feature",
geometry: {
type: "Point",
coordinates: [108.78597820119654, 19.108808528859697],
},
properties: {
name: "坐标点2<p>asfdasfdas</p>",
},
},
],
},
},
layout: {
"icon-image": "cat",
"icon-size": 1,
visibility: "visible", //
},
});
});
},
绘制多条曲线
DrawLinesFun() {
map.addSource("MyCustomlines", {
type: "geojson",
data: {
type: "FeatureCollection",
features: [
{
type: "Feature",
properties: {
color: "#F7455D", // red
},
geometry: {
type: "LineString",
coordinates: [
[108.72795665578485, 19.22133875411727],
[108.74374950246488, 19.221987120485267],
[108.77224532116793, 19.229118971730983],
[108.78769484509348, 19.228794802939134],
[108.79696455944878, 19.226525603482486],
[108.83414703121872, 19.229137281712354],
[108.85096984616052, 19.236268832473357],
[108.85199981442219, 19.244696629496772],
],
},
},
{
type: "Feature",
properties: {
color: "#33C9EB", // blue
},
geometry: {
type: "LineString",
coordinates: [
[108.68298137502444, 19.03872217883449],
[108.70529738810336, 19.06857740835045],
[108.71559708203768, 19.09193861422048],
[108.73830836723033, 19.125796468657413],
[108.75204127738516, 19.134878630789984],
[108.76838778126819, 19.168116204400178],
[108.7539682256043, 19.17687176607255],
[108.73920534718769, 19.186599622200788],
[108.71894930470631, 19.190166358801875],
[108.70967959035107, 19.2054051809326],
[108.74956456561256, 19.20389678341249],
],
},
},
],
},
});
map.addLayer({
id: "MyCustomlines",
type: "line",
source: "MyCustomlines",
paint: {
"line-width": 3,
// Use a get expression (https://docs.mapbox.comhttps://docs.mapbox.com/style-spec/reference/expressions/#get)
// to set the line-color to a feature property value.
"line-color": ["get", "color"],
},
});
},
///绘制动态线
DrawAnimationLinesFun() {
const geojson = {
type: "FeatureCollection",
features: [
{
type: "Feature",
properties: {},
geometry: {
coordinates: [
[109.22989452199619, 19.240140339902368],
[109.21753490285579, 19.22976731734059],
[109.19968211965227, 19.213233958706027],
[109.17580001089982, 19.184195539179612],
[109.10001241983537, 19.133470215947554],
[109.07288992227649, 19.133470215947554],
[109.06739675821353, 19.13995722415669],
[109.06739675821353, 19.147092638783647],
],
type: "LineString",
},
},
{
type: "Feature",
properties: {},
geometry: {
coordinates: [
[109.16363323049268, 19.135731966665944],
[109.17461955861694, 19.146759577886357],
[109.21554064178974, 19.19107402328848],
[109.21966051483645, 19.19820722531415],
[109.22824358368462, 19.217984031509516],
[109.23888658905611, 19.23192362918958],
[109.24197649384132, 19.239379207488625],
],
type: "LineString",
},
},
{
type: "Feature",
properties: {},
geometry: {
coordinates: [
[109.17496288137141, 19.233333117753645],
[109.18697917775734, 19.22976731734059],
[109.20277202443742, 19.22393220423919],
[109.2192515166247, 19.214206555254933],
[109.2254313261949, 19.20869509873897],
[109.23161113576685, 19.19929277603012],
[109.25564372853881, 19.178540921412505],
],
type: "LineString",
},
},
{
type: "Feature",
properties: {},
geometry: {
coordinates: [
[109.22749126271833, 19.080582870243916],
[109.23435771779748, 19.092911910892198],
[109.20963843081171, 19.12048671260588],
[109.20963843081171, 19.138975467609015],
[109.12844112166454, 19.17856911476261],
[109.14526394931647, 19.20580538828324],
[109.15865353671865, 19.21099273774354],
[109.16757992832129, 19.202563211787293],
[109.18302945224684, 19.196402900408657],
[109.2367810062604, 19.163677453410585],
],
type: "LineString",
},
},
],
};
map.addSource("AnimateDashLine", {
type: "geojson",
data: geojson,
});
// add a line layer without line-dasharray defined to fill the gaps in the dashed line
map.addLayer({
type: "line",
source: "AnimateDashLine",
id: "AnimateDashLine-background",
paint: {
"line-color": "yellow",
"line-width": 6,
"line-opacity": 0.4,
},
});
// add a line layer with line-dasharray set to the first value in dashArraySequence
map.addLayer({
type: "line",
source: "AnimateDashLine",
id: "AnimateDashLine-dashed",
paint: {
"line-color": "yellow",
"line-width": 6,
"line-dasharray": [0, 4, 3],
},
});
// technique based on https://jsfiddle.net/2mws8y3q/
// an array of valid line-dasharray values, specifying the lengths of the alternating dashes and gaps that form the dash pattern
const dashArraySequence = [
[0, 4, 3],
[0.5, 4, 2.5],
[1, 4, 2],
[1.5, 4, 1.5],
[2, 4, 1],
[2.5, 4, 0.5],
[3, 4, 0],
[0, 0.5, 3, 3.5],
[0, 1, 3, 3],
[0, 1.5, 3, 2.5],
[0, 2, 3, 2],
[0, 2.5, 3, 1.5],
[0, 3, 3, 1],
[0, 3.5, 3, 0.5],
];
let step = 0;
function animateDashArray(timestamp) {
// Update line-dasharray using the next value in dashArraySequence. The
// divisor in the expression `timestamp / 50` controls the animation speed.
const newStep = parseInt((timestamp / 50) % dashArraySequence.length);
if (newStep !== step) {
map.setPaintProperty(
"AnimateDashLine-dashed",
"line-dasharray",
dashArraySequence[step]
);
step = newStep;
}
// Request the next frame of the animation.
requestAnimationFrame(animateDashArray);
}
// start the animation
animateDashArray(0);
},
动画扩散点
DrawAnimationPointsFun() {
const size = 200;
// This implements `StyleImageInterface`
// to draw a pulsing dot icon on the map.
const pulsingDot = {
width: size,
height: size,
data: new Uint8Array(size * size * 4),
// When the layer is added to the map,
// get the rendering context for the map canvas.
onAdd: function () {
const canvas = document.createElement("canvas");
canvas.width = this.width;
canvas.height = this.height;
this.context = canvas.getContext("2d");
},
// Call once before every frame where the icon will be used.
render: function () {
const duration = 1000;
const t = (performance.now() % duration) / duration;
const radius = (size / 2) * 0.3;
const outerRadius = (size / 2) * 0.7 * t + radius;
const context = this.context;
// Draw the outer circle.
context.clearRect(0, 0, this.width, this.height);
context.beginPath();
context.arc(
this.width / 2,
this.height / 2,
outerRadius,
0,
Math.PI * 2
);
context.fillStyle = `rgba(255, 200, 200, ${1 - t})`;
context.fill();
// Draw the inner circle.
context.beginPath();
context.arc(this.width / 2, this.height / 2, radius, 0, Math.PI * 2);
context.fillStyle = "rgba(255, 100, 100, 1)";
context.strokeStyle = "white";
context.lineWidth = 2 + 4 * (1 - t);
context.fill();
context.stroke();
// Update this image's data with data from the canvas.
this.data = context.getImageData(0, 0, this.width, this.height).data;
// Continuously repaint the map, resulting
// in the smooth animation of the dot.
map.triggerRepaint();
// Return `true` to let the map know that the image was updated.
return true;
},
};
map.addImage("pulsing-dot", pulsingDot, { pixelRatio: 2 });
map.addSource("dot-point", {
type: "geojson",
data: {
type: "FeatureCollection",
features: [
{
type: "Feature",
geometry: {
type: "Point",
coordinates: [108.98201549367656, 19.26542183598174], // icon position [lng, lat]
},
},
{
type: "Feature",
geometry: {
type: "Point",
coordinates: [108.98201549367656, 19.24046448629788], // icon position [lng, lat]
},
},
{
type: "Feature",
geometry: {
type: "Point",
coordinates: [108.99471843557143, 19.224256382626862], // icon position [lng, lat]
},
},
{
type: "Feature",
geometry: {
type: "Point",
coordinates: [109.06784618557248, 19.276116685716573], // icon position [lng, lat]
},
},
],
},
});
map.addLayer({
id: "layer-with-pulsing-dot",
type: "symbol",
source: "dot-point",
layout: {
"icon-image": "pulsing-dot",
},
});
},
///
},
};
</script>
<style lang="scss" scoped>
.TestViewPage {
padding: 0;
margin: 0;
width: 100%;
height: 100%;
position: relative;
.BasicMapbox {
position: absolute;
top: 0;
bottom: 0;
width: 100%;
::v-deep #marker {
background-image: url("https://docs.mapbox.com/mapbox-gl-js/assets/washington-monument.jpg");
background-size: cover;
width: 50px;
height: 50px;
border-radius: 50%;
cursor: pointer;
}
::v-deep .mapboxgl-popup {
max-width: 300px !important;
.mapboxgl-popup-content {
padding: 0;
}
}
::v-deep .mapboxgl-ctrl {
display: none !important;
}
}
}
</style>
Cpt/index.js
import Vue from "vue";
import myWindow from "./myWindow.vue";
/01
export let VmInstance = (Pararms) => {
    let WindowVm = Vue.extend(myWindow);
    let Vm = new WindowVm({}).$mount()
    Vm.data = Pararms
    Vm.propsData = Pararms
    console.log(`Vm`, Vm);
    return Vm.$el
}
/02
class VmInstanceClass {
    constructor(Pararms) {
        this.Pararms = { ...Pararms }
        this.WindowVm = Vue.extend(myWindow);
    }
    InitVmInstanceClassFun() {
        console.log(`this.Pararms`, this.Pararms);
        let Vm = new this.WindowVm({}).$mount()
        Vm.data = this.Pararms
        Vm.propsData = this.Pararms
        console.log(`Vm`, Vm);
        return Vm.$el
    }
}
export { VmInstanceClass }
Cpt/myWindow.vue
<template>
  <div class="MyCustomMapboxPopupCpt">
    <div class="MyCustomMapboxPopupCptOutbox" @click="ClosePopFun">
      <div class="NavOutbox">
        <div class="NavLeft">弹框</div>
        <div class="NavRight" @click="ClosePopFun">x</div>
      </div>
      <div class="ContentOutbox">这里是样式{{ propsData }}</div>
    </div>
  </div>
</template>
  <script>
export default {
  props: {
    propsData: {
      type: Object,
      default: () => {},
    },
    detailId: {
      type: Number,
      required: false,
    },
  },
  data() {
    return {};
  },
  methods: {
    ClosePopFun() {
      if (MyCustomMapboxPopup) {
        MyCustomMapboxPopup.remove();
      }
    },
  },
};
</script>
  <style lang="scss" scoped>
.MyCustomMapboxPopupCpt {
  width: 290px;
  .MyCustomMapboxPopupCptOutbox {
    width: calc(100% - 30px);
    margin: 15px;
    .NavOutbox {
      display: flex;
      flex-flow: row nowrap;
      justify-content: space-between;
      align-items: center;
      width: 100%;
      margin-bottom: 15px;
      .NavLeft {
        color: #222;
        font-size: 14px;
        font-weight: 500;
      }
      .NavRight {
        color: #222;
        font-size: 22px;
        font-weight: 500;
        cursor: pointer;
      }
    }
    .ContentOutbox {
      width: 100%;
      color: #222;
      font-size: 14px;
    }
  }
}
</style>


 1764
1764


 被折叠的 条评论
为什么被折叠?
被折叠的 条评论
为什么被折叠?
 到【灌水乐园】发言


