


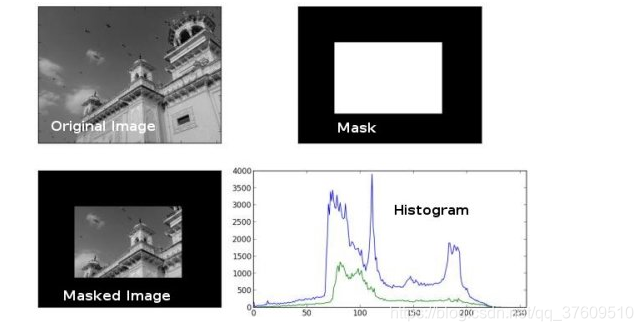
使用掩模:
要统计图像某个局部区域的直方图只需要构建一副掩模图像。将要统计的部分设置成白色,其余部分为黑色,就构成了一副掩模图像。然后把这个掩模图像传给函数就可以了。
img = cv2.imread(‘home.jpg’,0)
create a mask
mask = np.zeros(img.shape[:2], np.uint8)
mask[100:300, 100:400] = 255
masked_img = cv2.bitwise_and(img,img,mask = mask)
Calculate histogram with mask and without mask
Check third argument for mask
hist_full = cv2.calcHist([img],[0],None,[256],[0,256])
hist_mask = cv2.calcHist([img],[0],mask,[256],[0,256])
plt.subplot(221), plt.imshow(img, ‘gray’)
plt.subplot(222), plt.imshow(mask,‘gray’)
plt.subplot(223), plt.imshow(masked_img, ‘gray’)
plt.subplot(224), plt.plot(hist_full), plt.plot(hist_mask)
plt.xlim([0,256])
plt.show()


 1300
1300

 被折叠的 条评论
为什么被折叠?
被折叠的 条评论
为什么被折叠?
 到【灌水乐园】发言


