


03 甜甜圈图
apexcharts数据可视化之甜甜圈图。
有完整配套的Python后端代码。
本教程主要会介绍如下图形绘制方式:
- 基本甜甜圈图
- 个性图案的甜甜圈图
- 渐变色的甜甜圈图
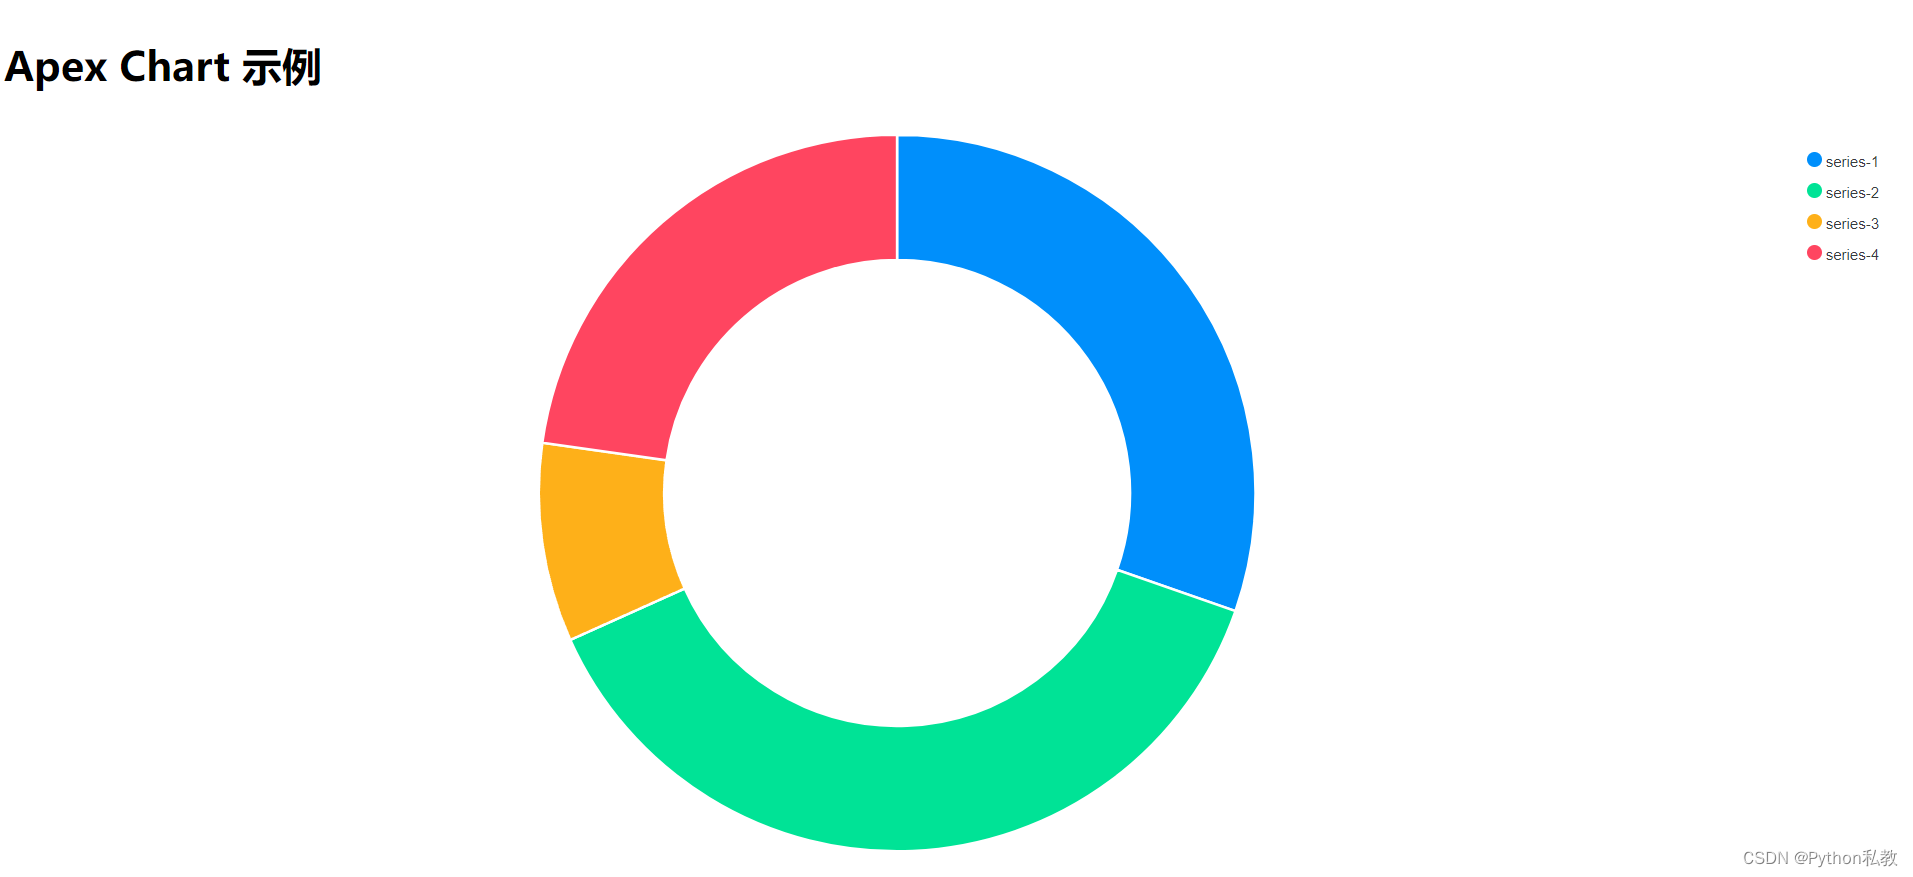
面包圈
import ApexChart from 'react-apexcharts';

export function DonutUpdate() {
    // 数据序列
    const series = [44, 55, 13, 33]
    // 图表选项
    const options = {
        // 图表
        chart: {
            width: 380,
            type: 'donut',
        },
        dataLabels: {
            enabled: false
        },
        // 响应式
        responsive: [{
            breakpoint: 480,
            options: {
                chart: {
                    width: 200
                },
                legend: {
                    show: false
                }
            }
        }],
        // 图例
        legend: {
            position: 'right',
            offsetY: 0,
            height: 230,
        }
    }
    return (
        <div id="chart">
            <ApexChart options={options} series={series} type="donut" height={600}/>
        </div>
    )
}
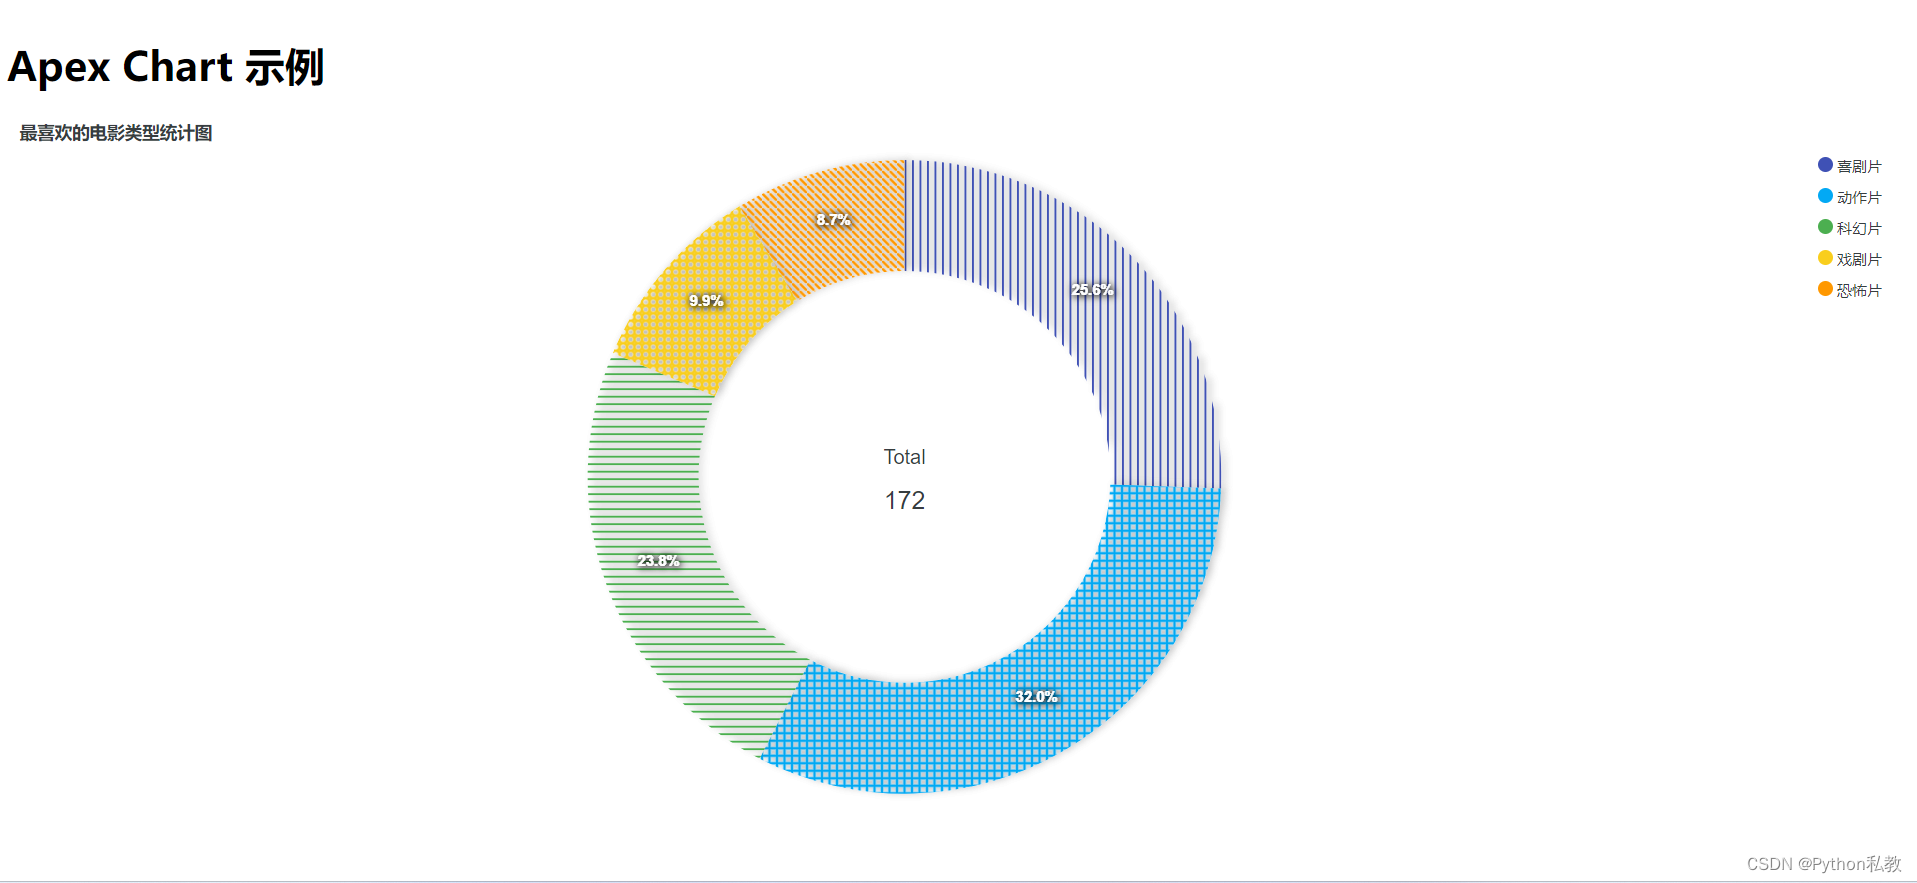
个性图案
import ApexChart from 'react-apexcharts';

export function DonutWithPattern() {
    // 数据序列
    const series = [44, 55, 41, 17, 15]
    // 图表选项
    const options = {
        // 图表选项
        chart: {
            width: 380,
            type: 'donut',
            // 阴影
            dropShadow: {
                enabled: true,
                color: '#111',
                top: -1,
                left: 3,
                blur: 3,
                opacity: 0.2
            }
        },
        stroke: {
            width: 0,
        },
        // 绘图选项
        plotOptions: {
            pie: {
                donut: {
                    labels: {
                        show: true,
                        total: {
                            showAlways: true,
                            show: true
                        }
                    }
                }
            }
        },
        labels: ["喜剧片", "动作片", "科幻片", "戏剧片", "恐怖片"],
        dataLabels: {
            dropShadow: {
                blur: 3,
                opacity: 0.8
            }
        },
        // 填充样式
        fill: {
            type: 'pattern',
            opacity: 1,
            pattern: {
                enabled: true,
                style: ['verticalLines', 'squares', 'horizontalLines', 'circles', 'slantedLines'],
            },
        },
        states: {
            hover: {
                filter: 'none'
            }
        },
        // 主题
        theme: {
            palette: 'palette2'
        },
        // 标题
        title: {
            text: "最喜欢的电影类型统计图"
        },
        // 响应式
        responsive: [{
            breakpoint: 480,
            options: {
                chart: {
                    width: 200
                },
                legend: {
                    position: 'bottom'
                }
            }
        }]
    }
    return (
        <div id="chart">
            <ApexChart options={options} series={series} type="donut" height={600}/>
        </div>
    )
}
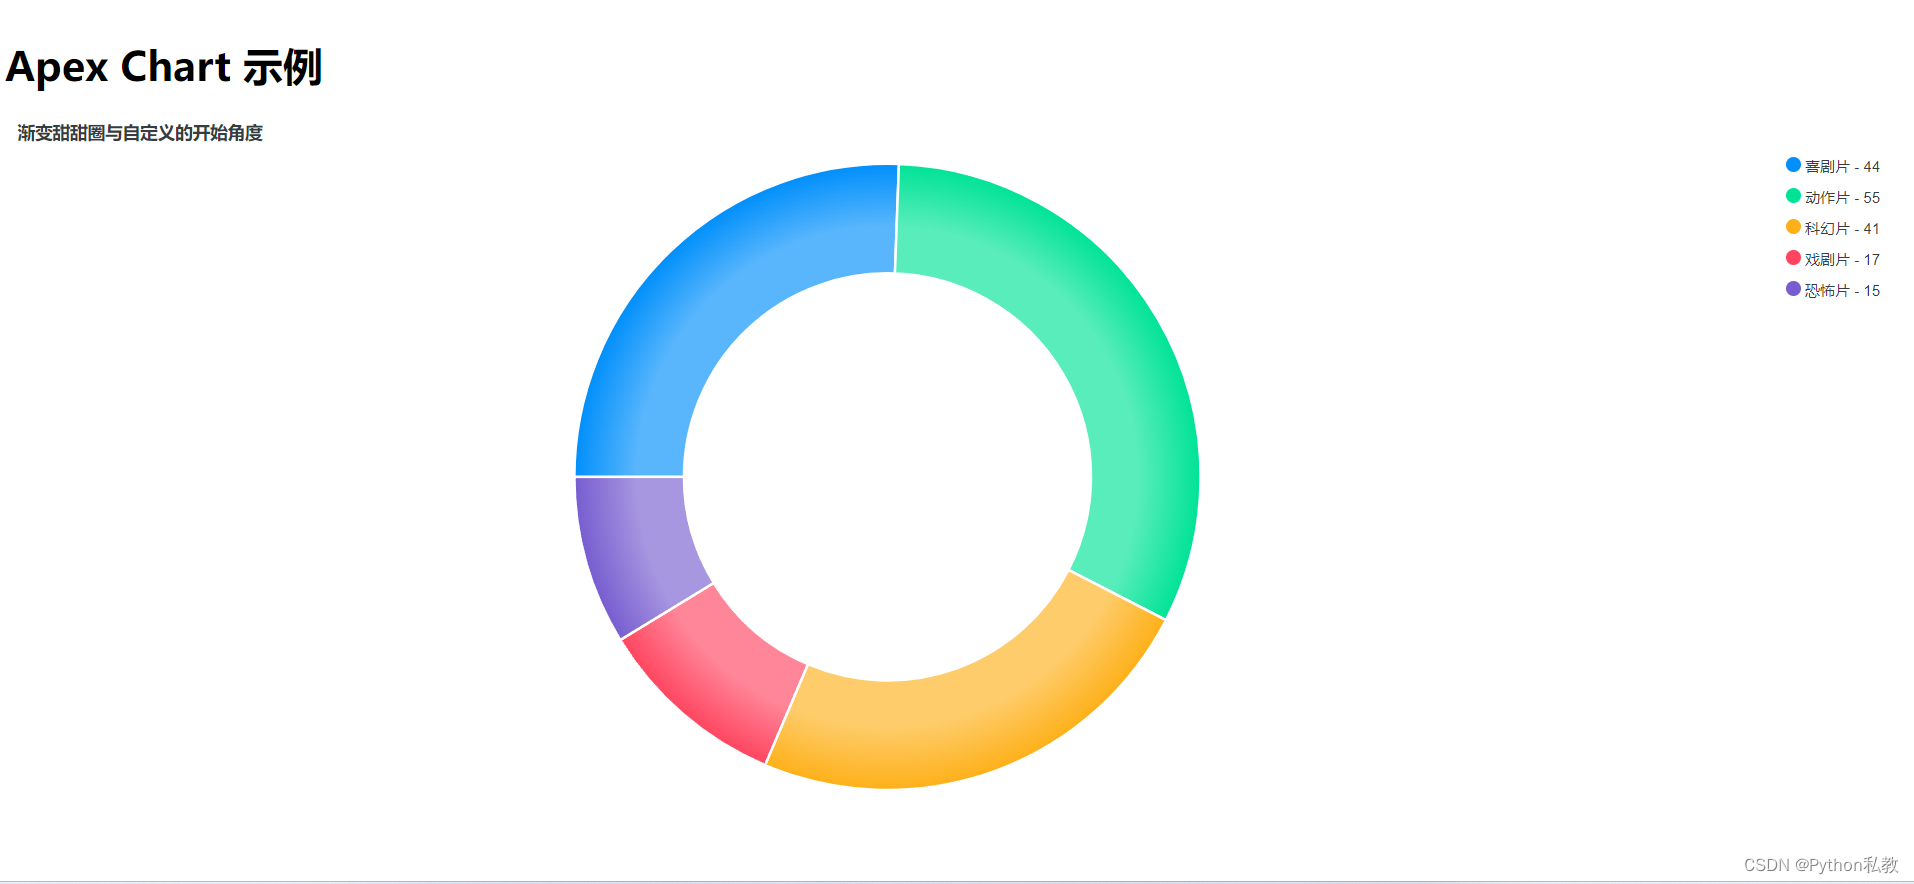
渐变
import ApexChart from 'react-apexcharts';

export function DonutGradient() {
    // 数据序列
    const series = [44, 55, 41, 17, 15]
    // 图表选项
    const options = {
        chart: {
            width: 380,
            type: 'donut',
        },
        // 绘制选项:自定义开始角度和结束角度
        plotOptions: {
            pie: {
                startAngle: -90,
                endAngle: 270
            }
        },
        dataLabels: {
            enabled: false
        },
        labels: ["喜剧片", "动作片", "科幻片", "戏剧片", "恐怖片"],
        // 填充类型:渐变
        fill: {
            type: 'gradient',
        },
        legend: {
            formatter: function(val, opts) {
                return val + " - " + opts.w.globals.series[opts.seriesIndex]
            }
        },
        title: {
            text: '渐变甜甜圈与自定义的开始角度'
        },
        responsive: [{
            breakpoint: 480,
            options: {
                chart: {
                    width: 200
                },
                legend: {
                    position: 'bottom'
                }
            }
        }]
    }
    return (
        <div id="chart">
            <ApexChart options={options} series={series} type="donut" height={550}/>
        </div>
    )
}


 被折叠的 条评论
为什么被折叠?
被折叠的 条评论
为什么被折叠?
 到【灌水乐园】发言


