


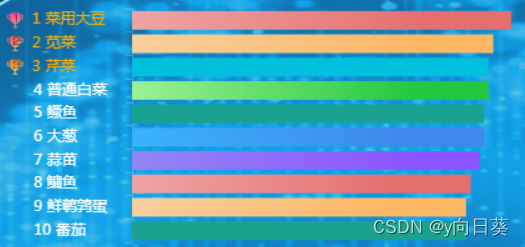
注意:echarts版本要 “echarts”: “^4.9.0”,否则icon图标显示出问题
<template>
  <div class="horizontal-bar" ref="horizontalBar" />
</template>

<script>
export default ({
  name: 'HorizontalBar',
  props: {
    source: Array,
    colors: {
      type: Array,
      default: () => ['#FFA554', '#FBD530', '#7B849B', '#B8CFE8', '#F99C37', '#FE852B', '#00D6EA', '#1B94F9', '#00D6EA', '#1B94F9'],
    },
    barWidth: {
      type: Number,
      default: 12,
    },
    barBorderRadius: { // 柱状图圆角
      type: Number,
      default: 0,
    },
    unit: { // 后缀
      type: String,
      default: '%',
    },
  },
  data() {
    return {
      charts: null,
    }
  },
  watch: {
    source: {
      handler(val) {
        if (!this.charts) {
          this.charts = this.initChart()
        }
        this.updateChart(val)
      },
    },
  },
  mounted() {
    this.charts = this.initChart()
    this.updateChart(this.source)
  },
  methods: {
    initChart() {
      const el = this.$refs.horizontalBar
      return this.$echarts.init(el)
    },
    updateChart(source) {
      const weatherIcons = {
        first: require('../../assets/img/gold.png'),
        second: require('../../assets/img/silver.png'),
        third: require('../../assets/img/copper.png'),
      }
      const names = source.map(item => item.name)
      const values = source.map((item, index) => ({ value: item.value, textStyle: { color: this.colors[index * 2] }}))
      let max = 0
      source.forEach(item => {
        if (max < item.value) {
          max = item.value
        }
      })
      const totals = source.map(() => ({ value: max }))
      const option = {
        grid: {
          left: '30%',
          right: '16%',
          bottom: '0%',
          top: '0%',
        },
        xAxis: {
          show: false,
        },
        yAxis: [
          {
            inverse: true,
            axisLine: {
              show: false,
            },
            splitLine: {
              show: false,
            },
            axisTick: {
              show: false,
            },
            axisLabel: {
              show: true,
              interval: 0,
              // margin: 12,
              formatter: function (value, index) {
                const ind = index + 1
                if (ind === 1) {
                  return `{one|} {taxon|${value}}`
                } else if (ind === 2) {
                  return `{two|} {taxon|${value}}`
                } else if (ind === 3) {
                  return `{three|} {taxon|${value}}`
                } else {
                  return `{four|${ind}} {taxon| ${value}}`
                }
              },
              rich: {
                value: {
                  color: '#fff',
                  fontSize: 14,
                },
                one: {
                  width: 32,
                  height: 18,
                  align: 'center',
                  backgroundColor: {
                    image: weatherIcons.first,
                  },
                },
                two: {
                  width: 32,
                  height: 18,
                  align: 'center',
                  backgroundColor: {
                    image: weatherIcons.second,
                  },
                },
                three: {
                  width: 32,
                  height: 18,
                  align: 'center',
                  backgroundColor: {
                    image: weatherIcons.third,
                  },
                },
                four: {
                  padding: [0, 0, 2, 0],
                  width: 20,
                  height: 20,
                  borderRadius: 10,
                  align: 'center',
                  background: '#1E234A',
                  borderWidth: 2,
                  borderColor: '#1B95F9',
                  color: '#06C8ED',
                  fontSize: 12,
                  lineHeight: 20,
                  verticalAlign: 'middle',
                },
                taxon: {
                  fontSize: 14,
                  color: '#fff',
                },
              },
            },
            data: names,
          }, {
            inverse: true,
            axisLine: {
              show: false,
            },
            splitLine: {
              show: false,
            },
            axisTick: {
              show: false,
            },
            axisLabel: {
              interval: 0,
              align: 'left',
              verticalAlign: 'center',
              fontSize: 18,
              formatter: (value) => {
                return `{num|${value}}{unit|${this.unit}}`
              },
              rich: {
                num: {
                  color: '#fff',
                  fontSize: 14,
                },
                unit: {
                  padding: [0, 0, 0, 2],
                  color: '#fff',
                  fontSize: 14,
                },
              },
            },
            data: values,
          }],
        series: [
          {
            type: 'bar',
            zlevel: 1,
            barWidth: this.barWidth,
            itemStyle: {
              color: (params) => {
                return new this.$echarts.graphic.LinearGradient(0, 0, 1, 0, [
                  {
                    offset: 0,
                    color: this.colors[params.dataIndex * 2],
                  },
                  {
                    offset: 1,
                    color: this.colors[params.dataIndex * 2 + 1],
                  },
                ], false)
              },
              barBorderRadius: this.barBorderRadius,
            },
            data: values,
          },
          {
            type: 'bar',
            barGap: '-100%',
            barWidth: this.barWidth,
            itemStyle: {
              color: 'rgba(0,156,255,.1)',
              barBorderRadius: this.barBorderRadius,
            },
            data: totals,
          },
        ],
      }
      this.charts.setOption(option, true)
      // 点击事件
      if (this.charts._$handlers.click) {
        this.charts._$handlers.click.length = 0
      }
      this.charts.on('click', (param) => {
        this.$emit('clickHandle', param)
      })
    },
  },
})
</script>

<style lang="scss" scoped>
.horizontal-bar{
  width: 100%;
  height: 100%;
}
</style>
设置左侧文字靠左对齐
yAxis:[
  {
    axisLabel:{
        margin: 150,
        textStyle: {
          align: 'left'
        }
    }
  }
]
这时候需要设置 grid 中的left
grid: {
    top: "0%",
    left: "-10%",
    right: "0%",
    bottom: "0%",
    containLabel: true,
  }
grid中的left与yAxis的axisLabel中的margin 相互修改,直至达到理想效果:
- grid中的
left是设置盒子左边距与y轴文字的距离 - yAxis的
axisLabel中的margin是设置y轴文字与圆柱的距离 - 一般会把grid中的left设置为负数值,再调整margin值


 1232
1232


 被折叠的 条评论
为什么被折叠?
被折叠的 条评论
为什么被折叠?
 到【灌水乐园】发言


