


布局-vuex保存用户信息
目标
能够把登录后返回信息保存到vuex中
讲解
在src/api/index.js模块中, 定义接口方法, 用于请求用户信息数据
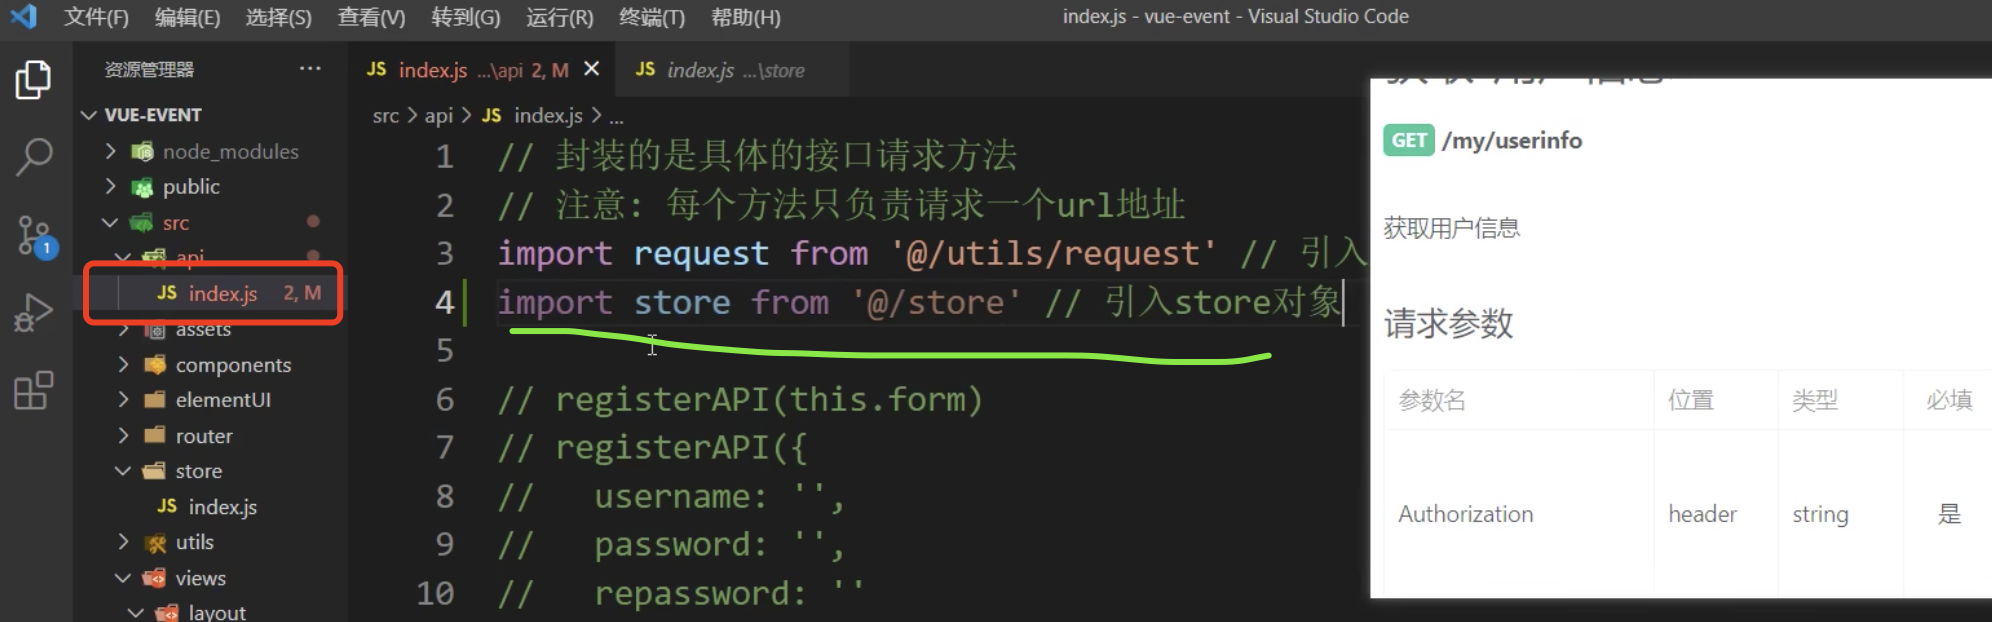
import store from '@/store'
/**
* 获取-用户信息
* @returns Promise对象
*/
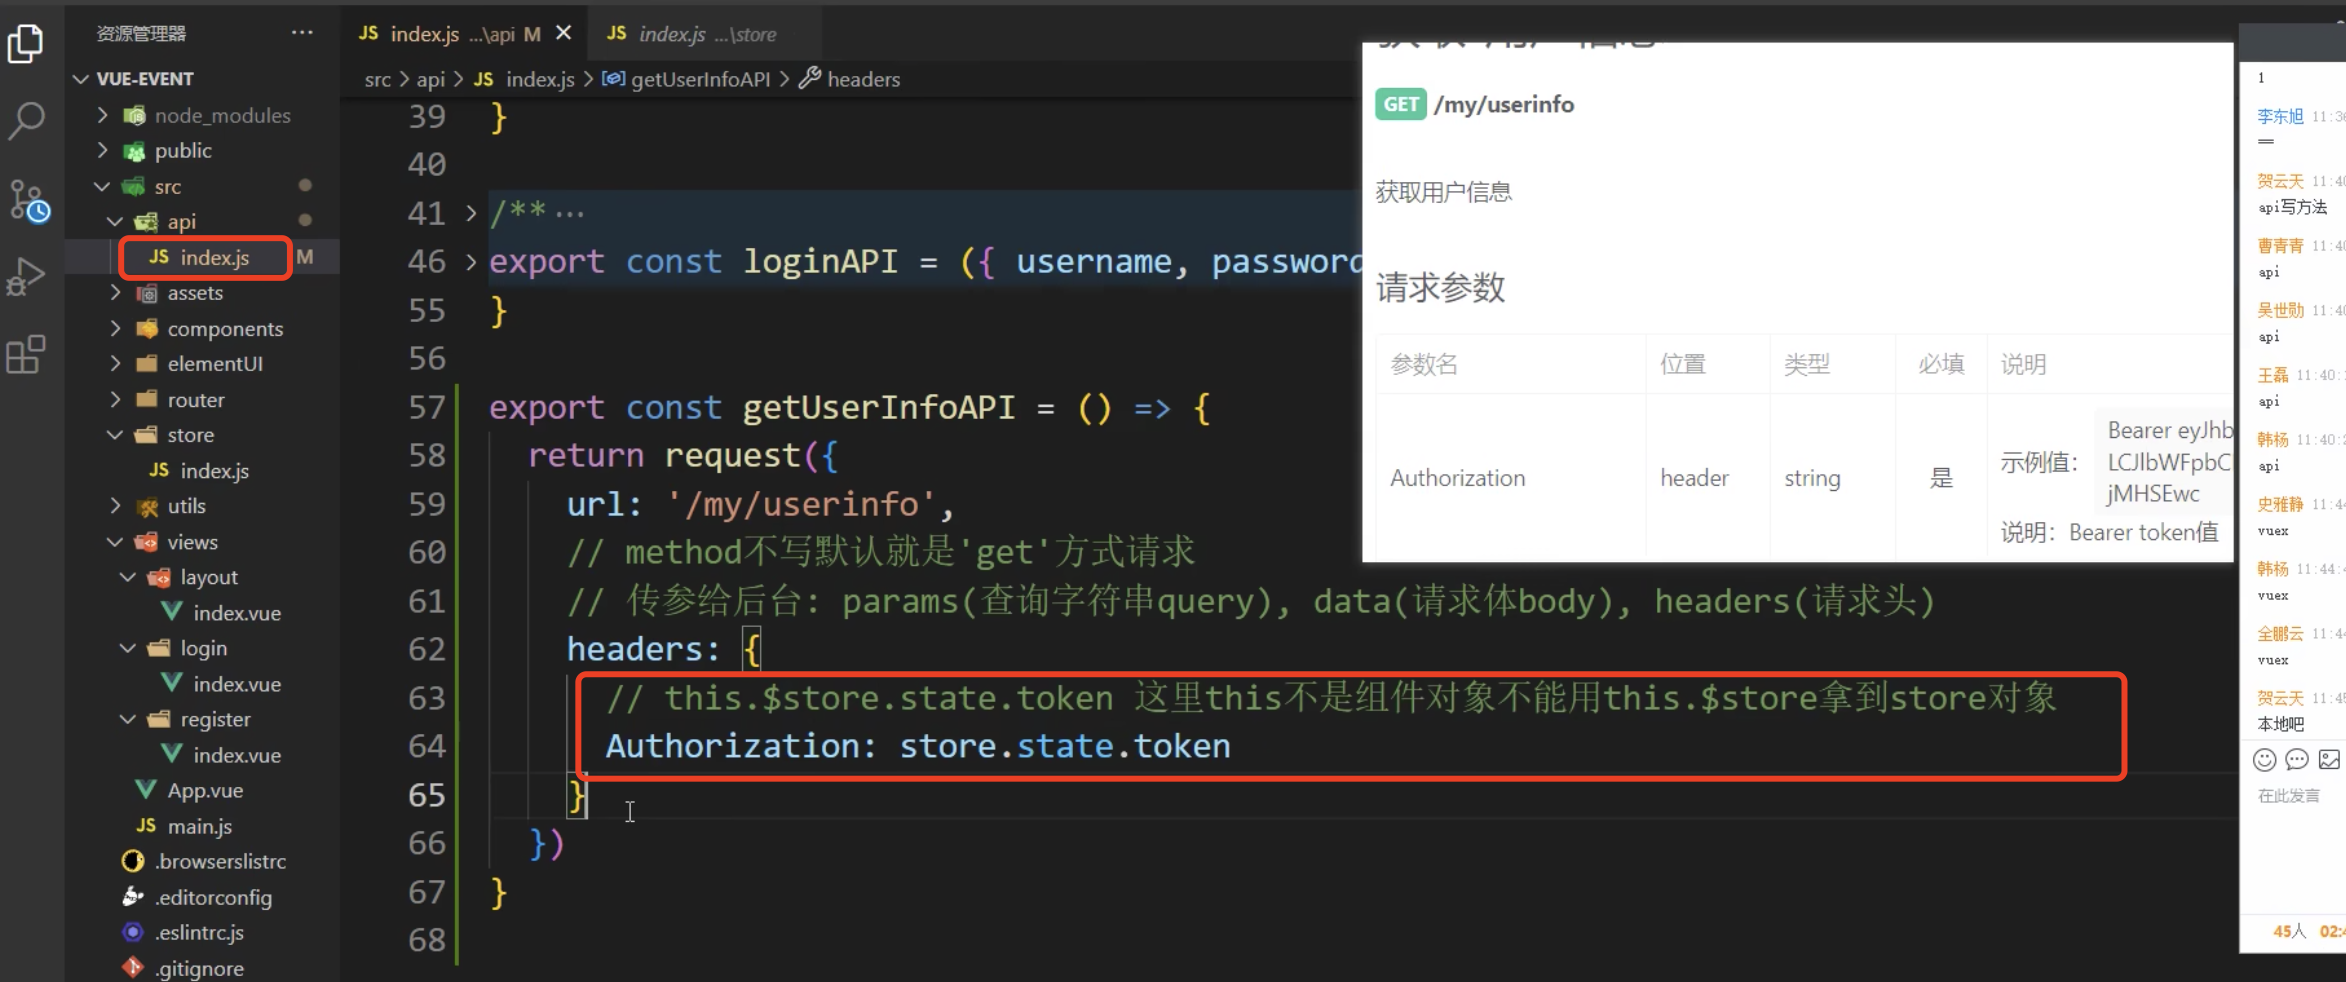
export const getUserInfoAPI = () => {
return request({
url: '/my/userinfo',
headers: {
Authorization: store.state.token
}
})
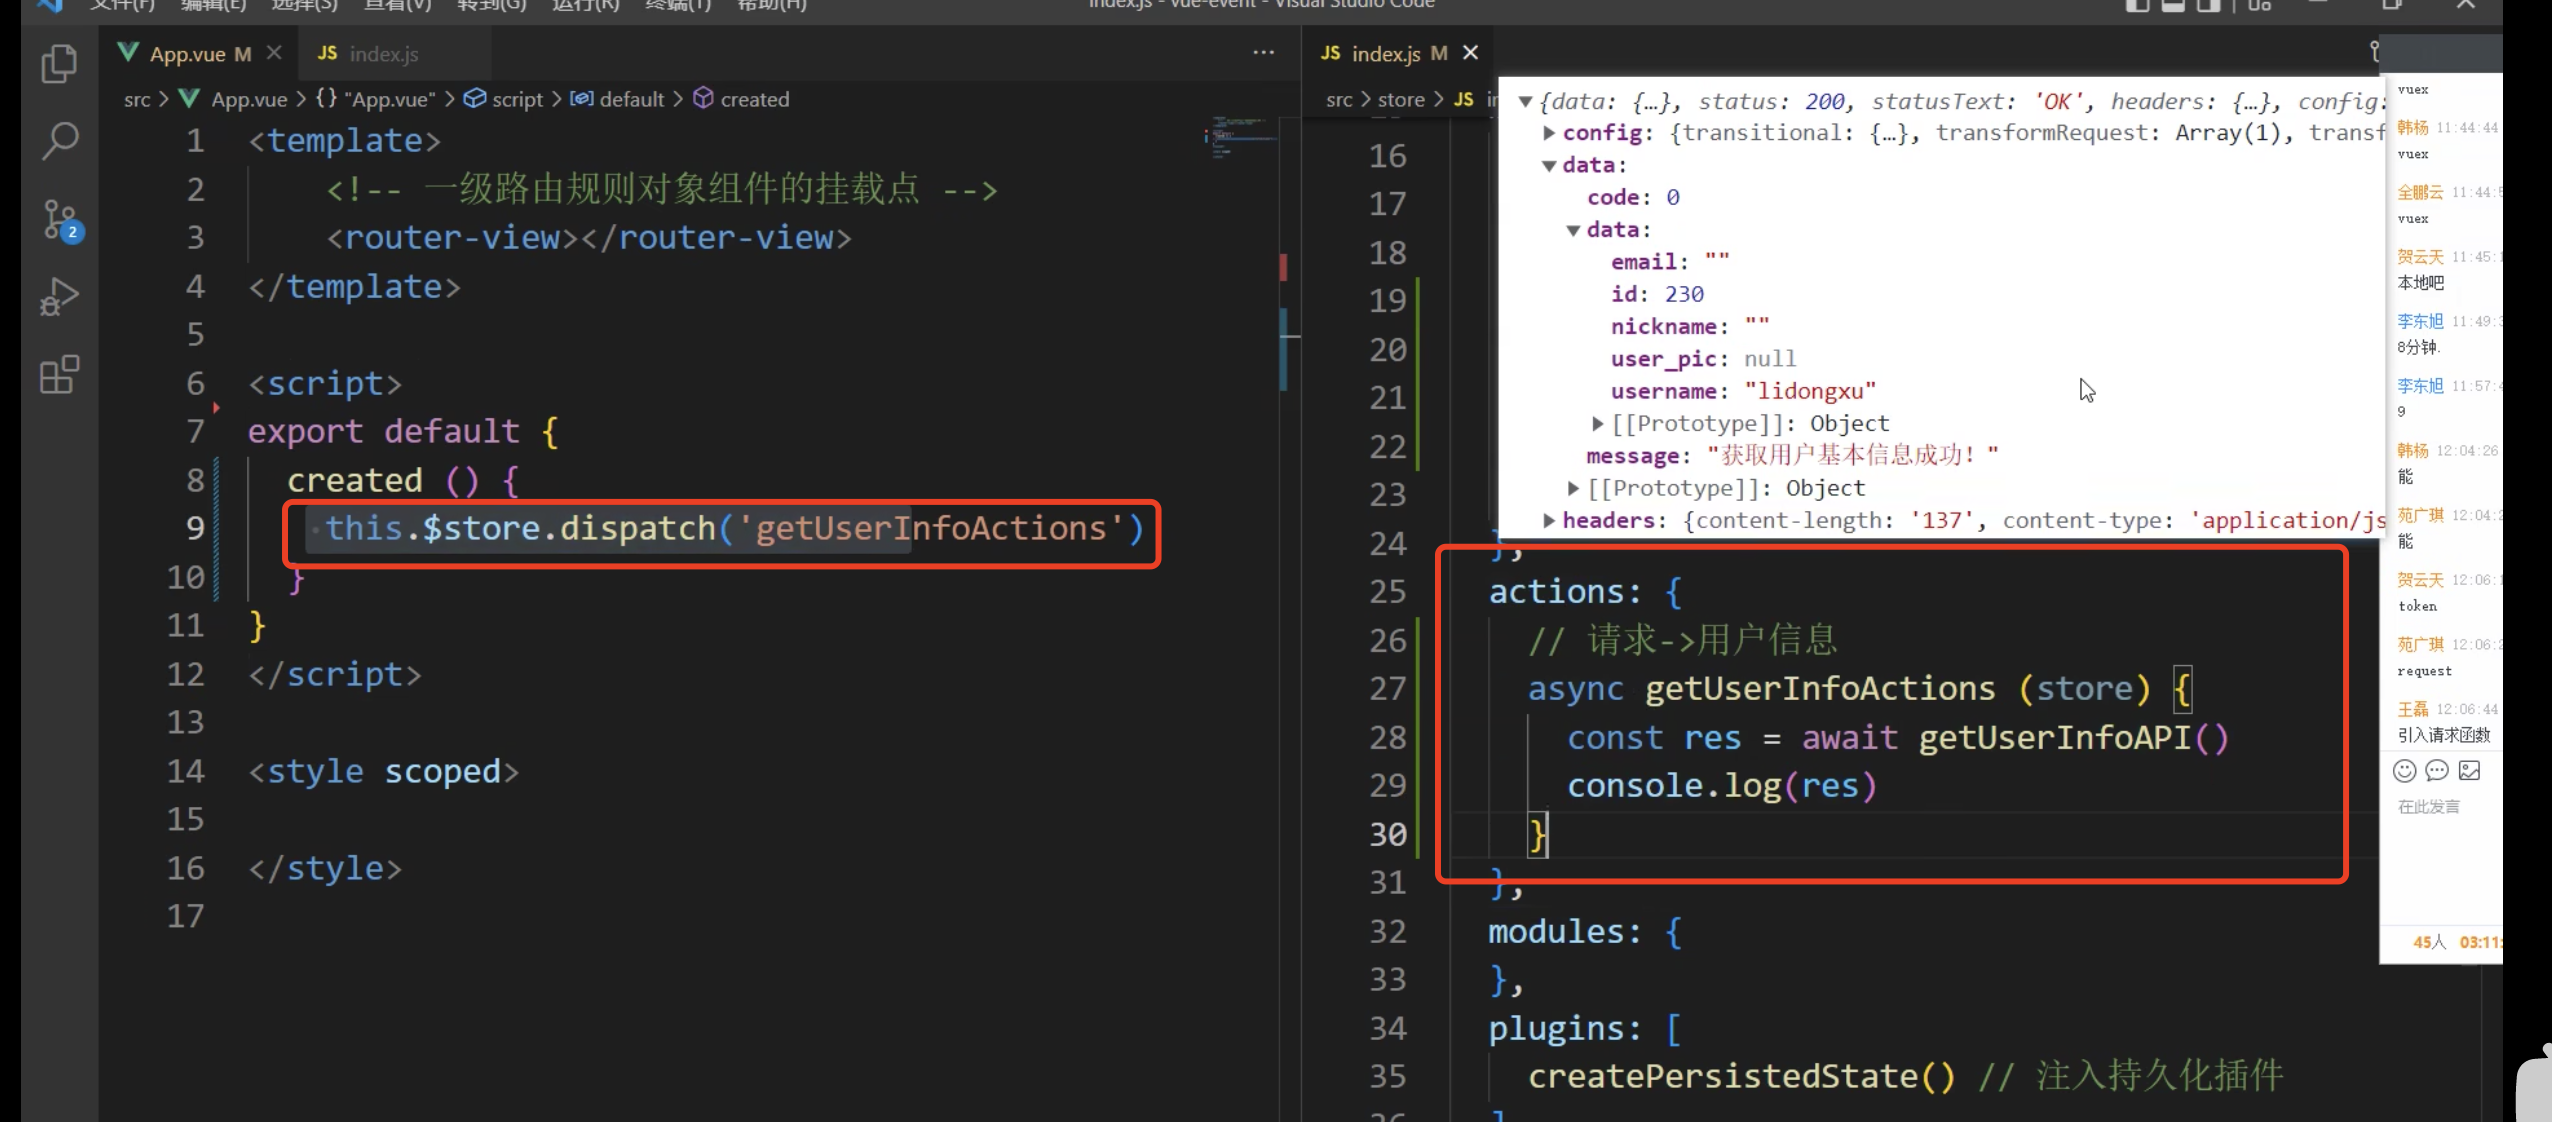
}在 src/store/index.js 模块中,使用接口方法+actions获取用户的基本信息
action里边可以调用方法 : 要么在逻辑页面直接发;要么在action写方法,在逻辑页面派发
import Vue from 'vue'
import Vuex from 'vuex'
import createPersistedState from 'vuex-persistedstate'
// 导入axios
import { getUserInfoAPI } from '@/api'
Vue.use(Vuex)
export default new Vuex.Store({
  state: {
    token: '', // 用户token
    userInfo: {} // 定义用户信息对象
  },
  mutations: {
    // 更新 token 的 mutation 函数
    updateToken (state, newToken) {
      state.token = newToken
    },
    // 更新用户的信息
    updateUserInfo (state, info) {
      state.userInfo = info
    }
  },
  actions: {
    // 定义初始化用户基本信息的 action 函数
    async initUserInfo (store) {
      const { data: res } = await getUserInfoAPI()
      if (res.code === 0) {
        store.commit('updateUserInfo', res.data)
      }
    }
  },
  // 配置为 vuex 的插件
  plugins: [createPersistedState()]
})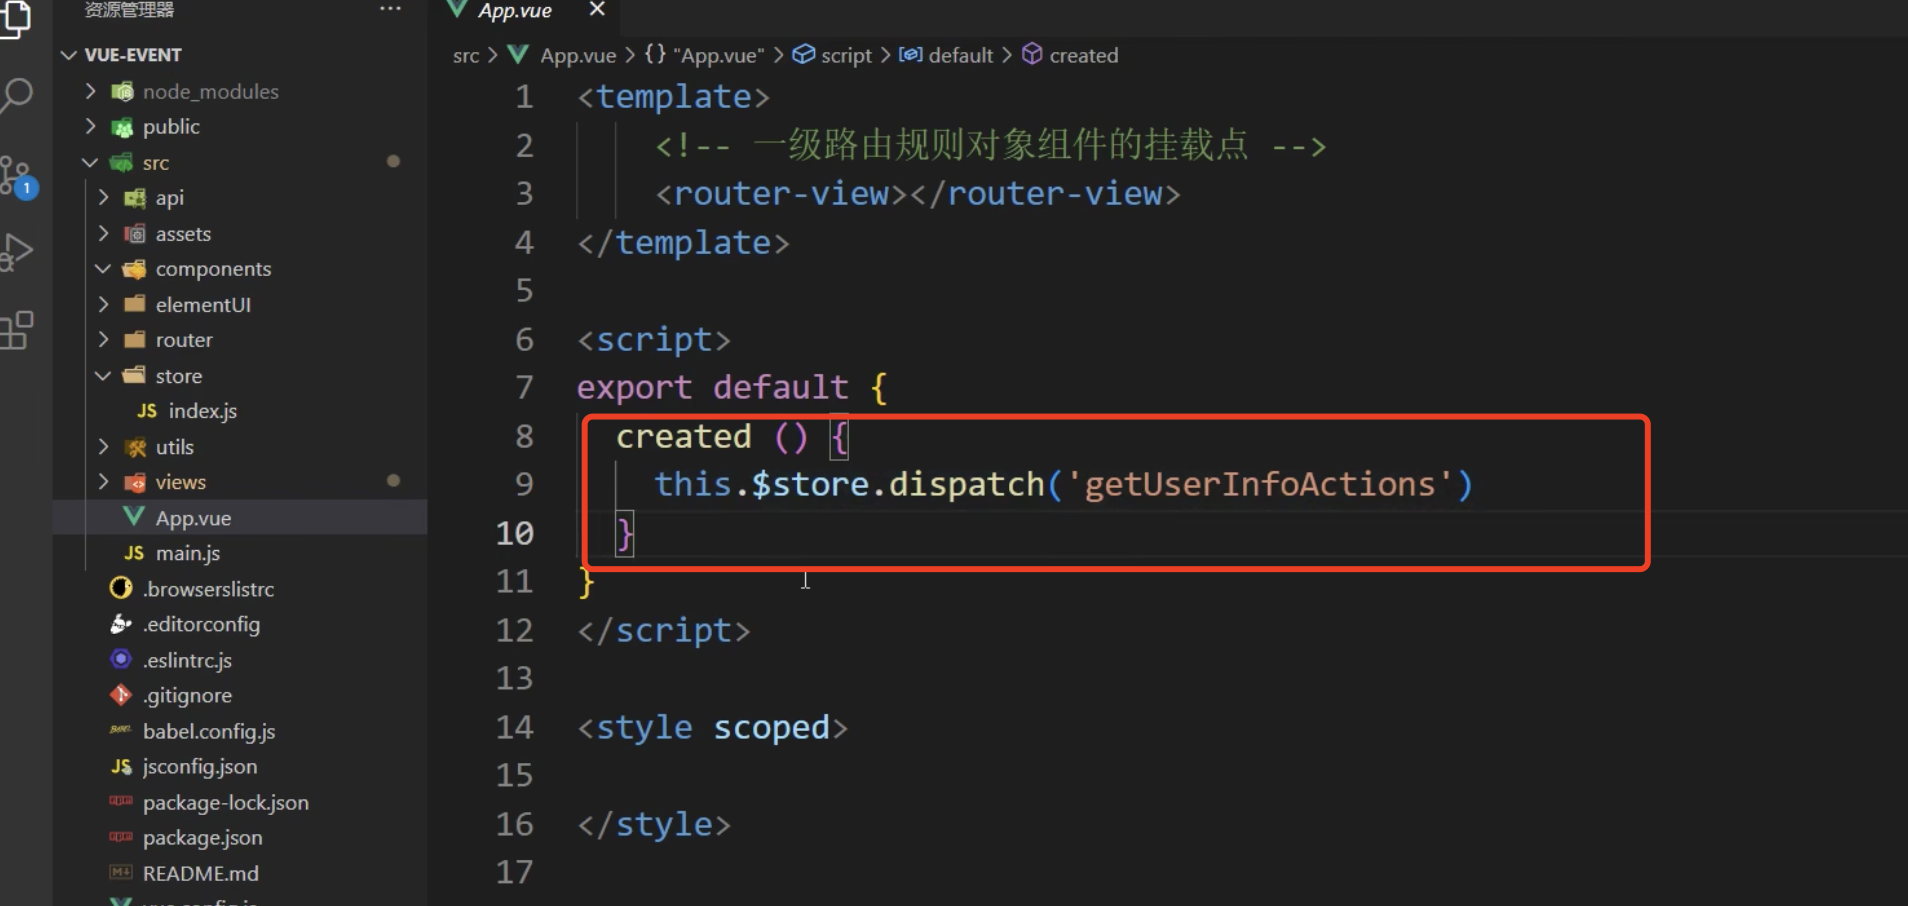
刷新网页,都会重新调用这个接口
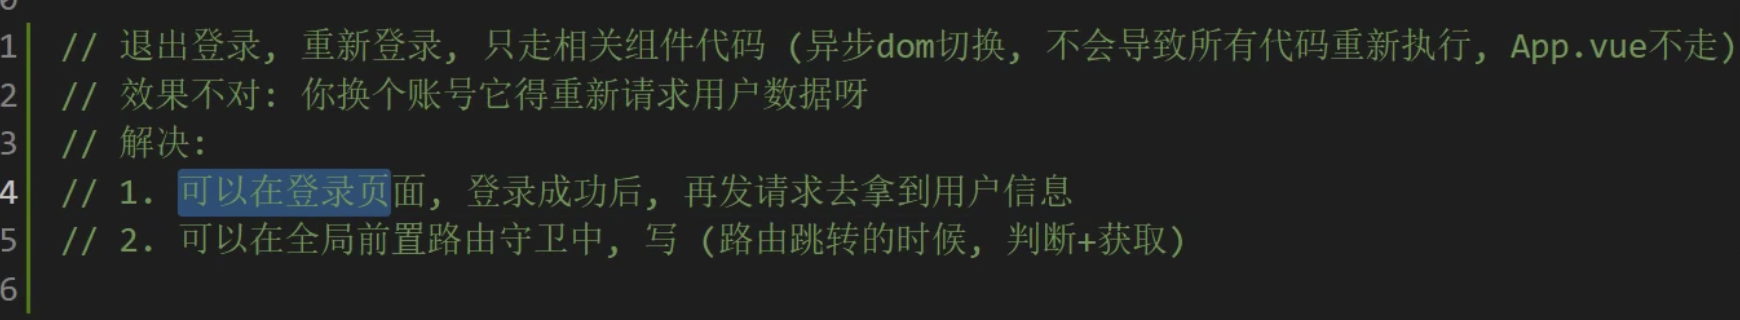
所以,在layout组件中的created里边不合适:
解决方法: 路由守卫
在全局前置守卫, 做判断, 有token但是无userInfo信息, 才发请求拿用户信息, 在src/router/index.js中编写
因为不确定先进入的哪个页面, 但是全局前置路由守卫必执行
import store from '@/store'
router.beforeEach((to, from, next) => {
const token = store.state.token
if (token && !store.state.userInfo.username) {
// 有token但是没有用户信息, 才去请求用户信息保存到vuex里,否则你退出在登陆也会走路由导航
// 调用actions里方法请求数据
store.dispatch('initUserInfo')
// 下次切换页面vuex里有用户信息数据就不会重复请求用户信息
}
next() // 路由放行
})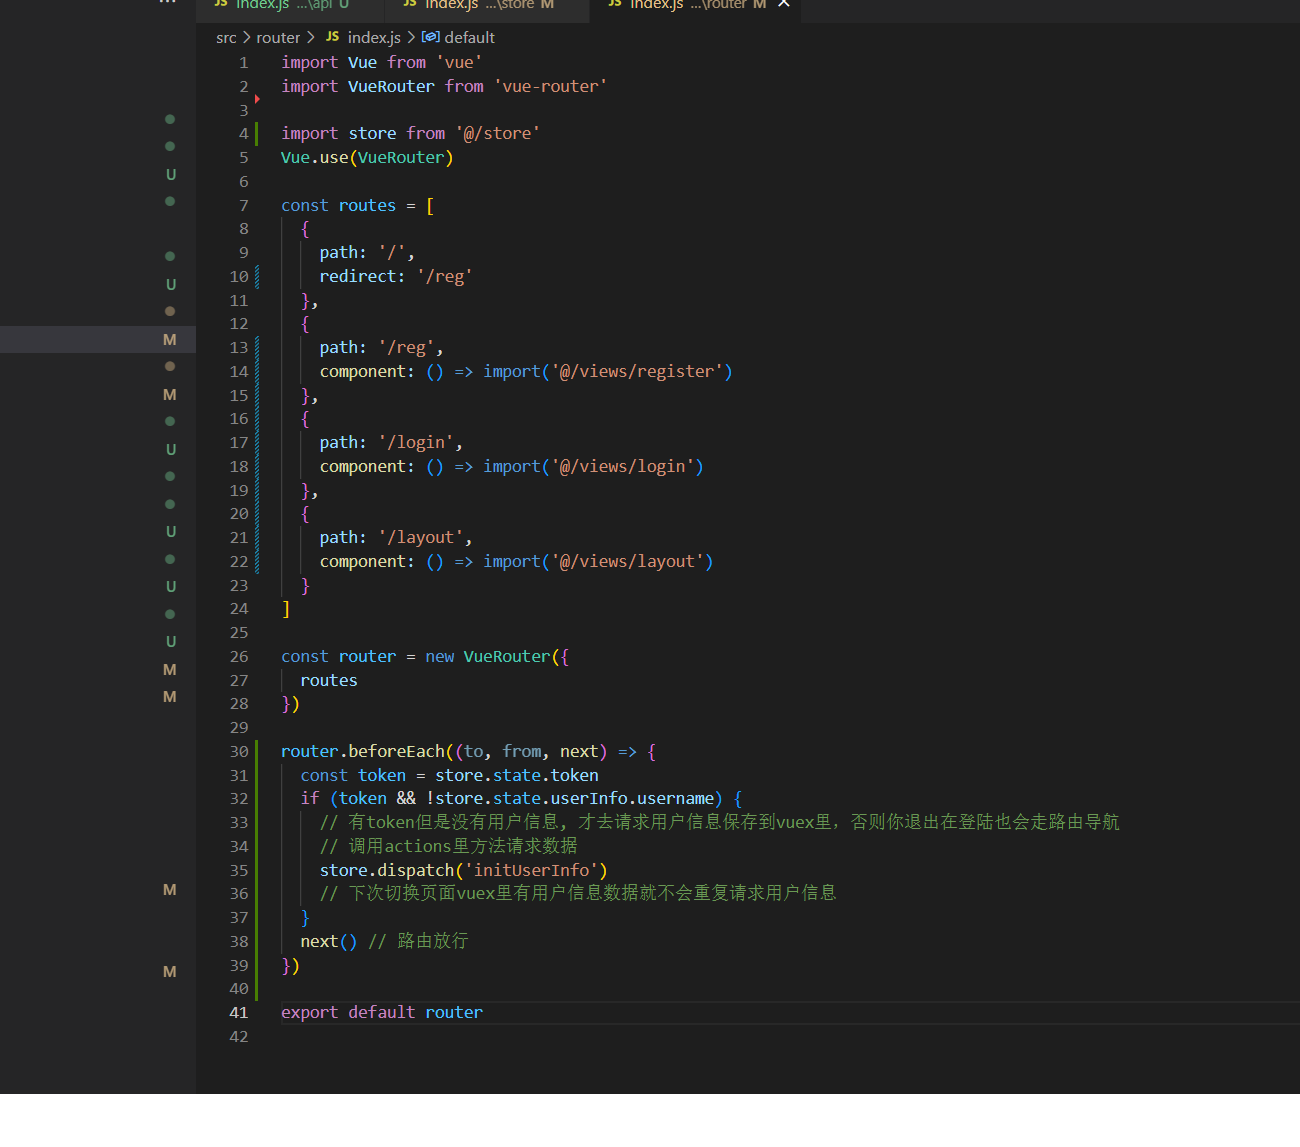
最后效果就是, 登录后, 刷新后, 会在vue调试工具中查看vuex中userInfo有值即可
注意条件:
token && !store.state.userInfo.username
1有token: 避免退出再登录页面的时候,也会去校验
2 !store.state.userInfo.username 如果不加这个,只要路由跳转,都会走路由守卫,重复请求用户
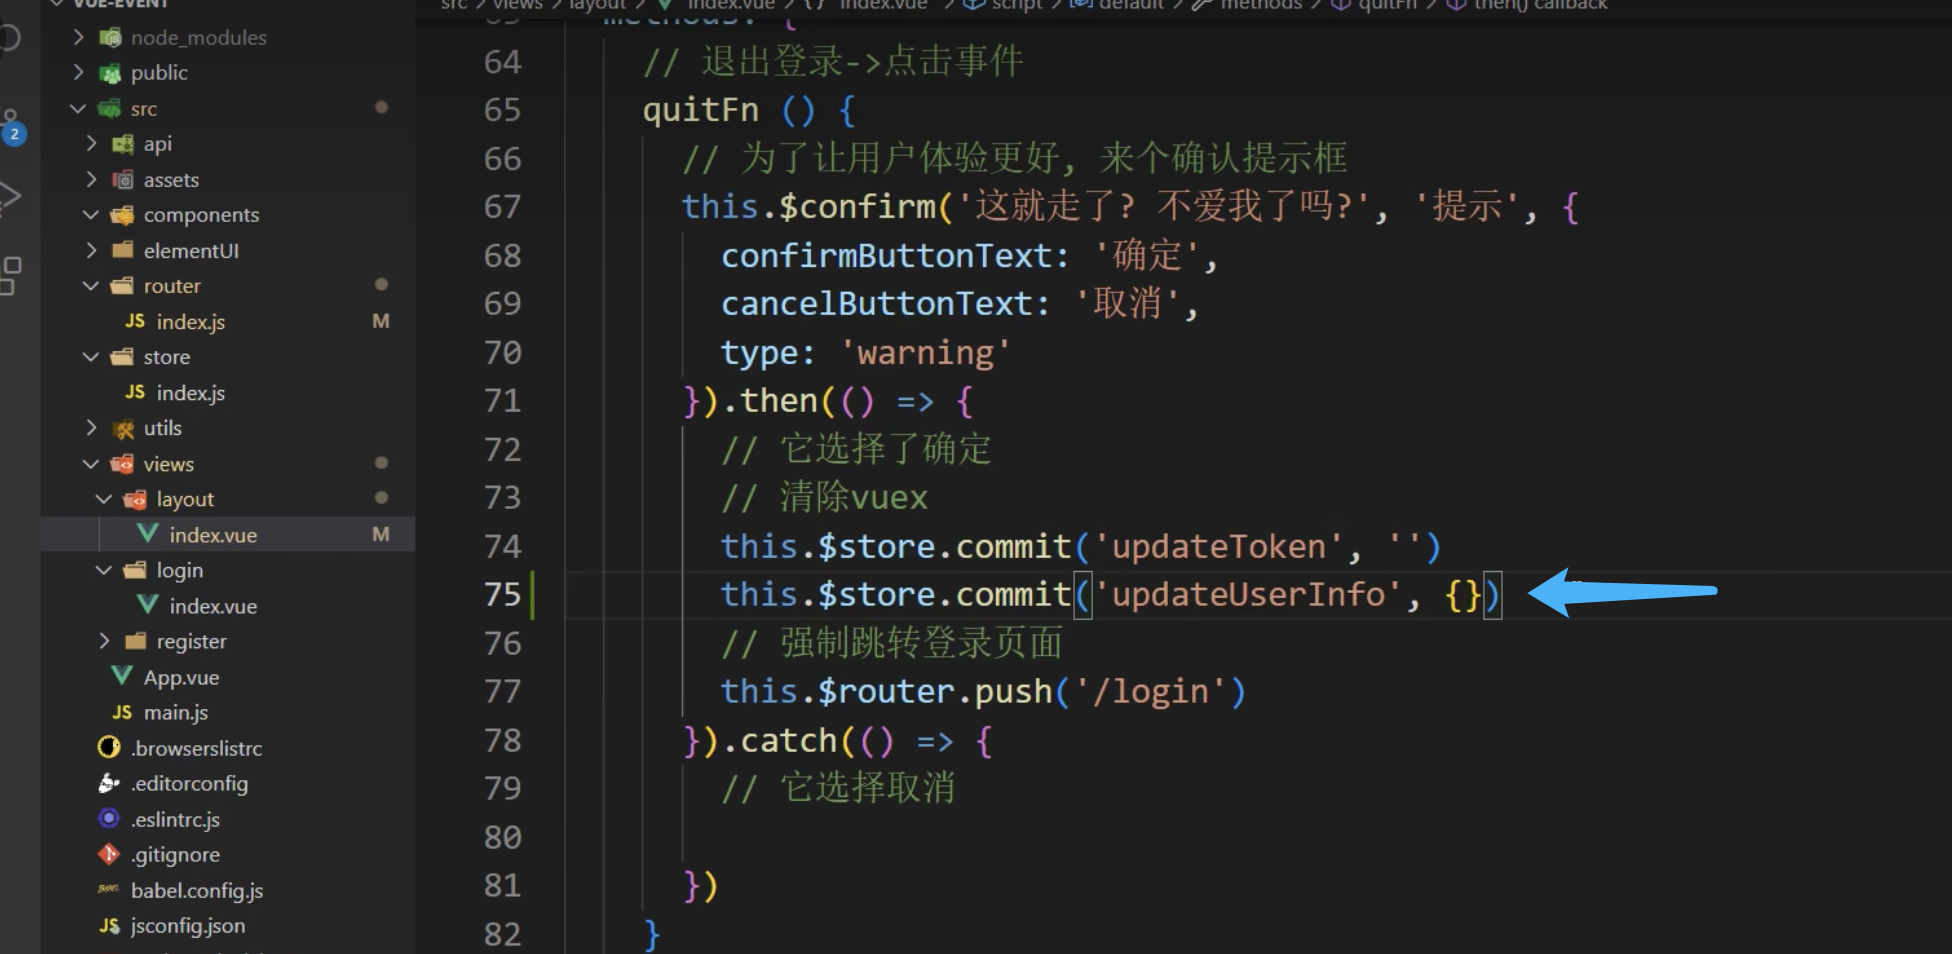
为了避免有用户信息 还重复调用用户信息退出登录时候,也要吧用户信息清除
02布局-渲染用户信息
目标
把vuex中用户信息, 渲染到标签上显示
讲解
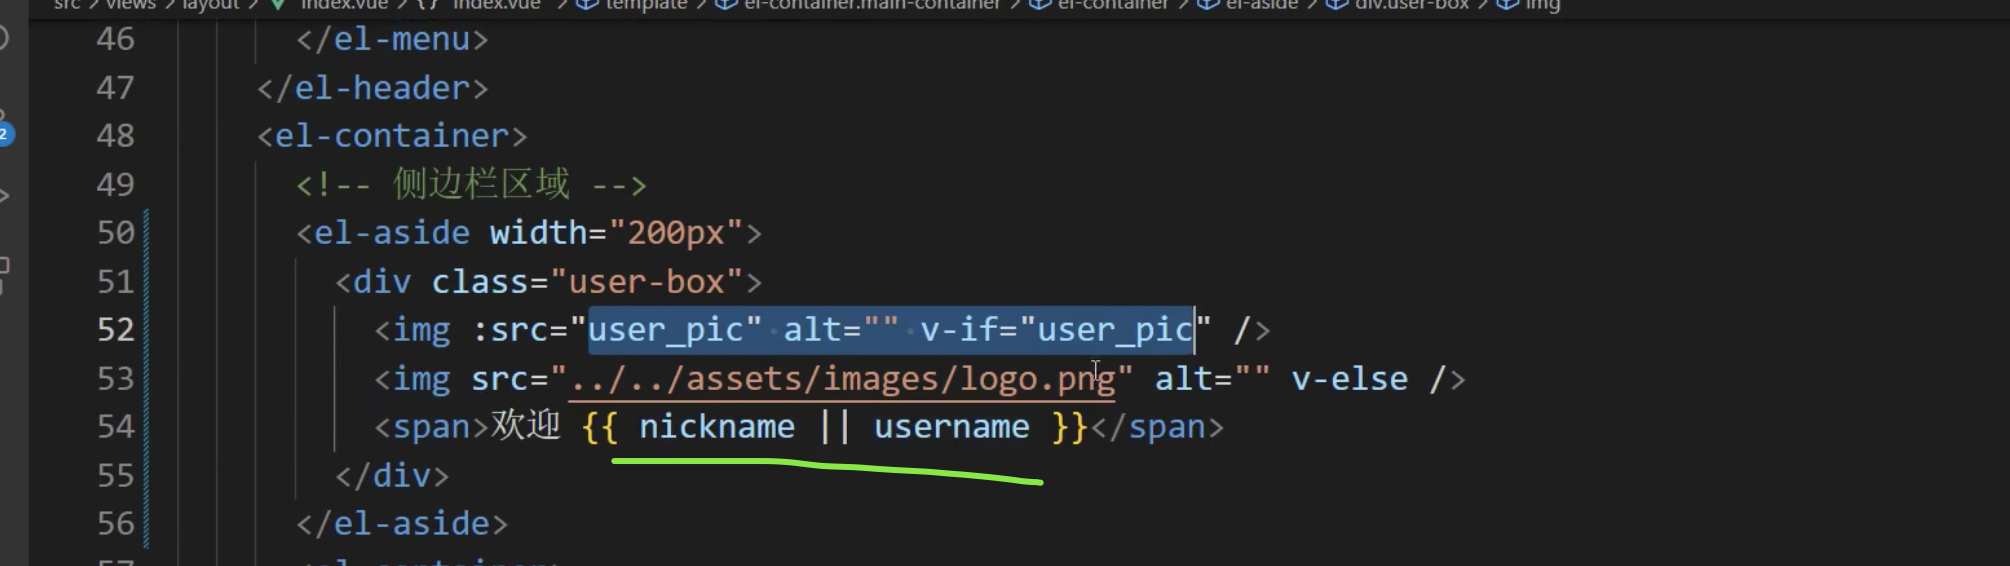
在src/views/layout/index.vue, 左侧侧边栏, 渲染用户信息昵称/用户名
<!-- 左侧边栏的用户信息 -->
<el-aside width="200px">
    <div class="user-box">
        <img :src="user_pic" alt="" v-if="user_pic" />
        <img src="../../assets/images/logo.png" alt="" v-else />
        <span>欢迎 {{ nickname || username }}</span>
    </div>
</el-aside>


<style lang="less" scoped>
// 左侧边栏用户信息区域
.user-box {
  height: 70px;
  display: flex;
  justify-content: center;
  align-items: center;
  border-top: 1px solid #000;
  border-bottom: 1px solid #000;
  user-select: none;
  img {
    width: 35px;
    height: 35px;
    border-radius: 50%;
    background-color: #fff;
    margin-right: 15px;
    object-fit: cover;
  }
  span {
    color: white;
    font-size: 12px;
  }
}
</style>
在vuex中, 定义getters, 定义并导出用户名和昵称
getters: {
    nickname: state => state.userInfo.nickname, // 昵称
    username: state => state.userInfo.username, // 用户名
    user_pic: state => state.userInfo.user_pic // 用户头像
}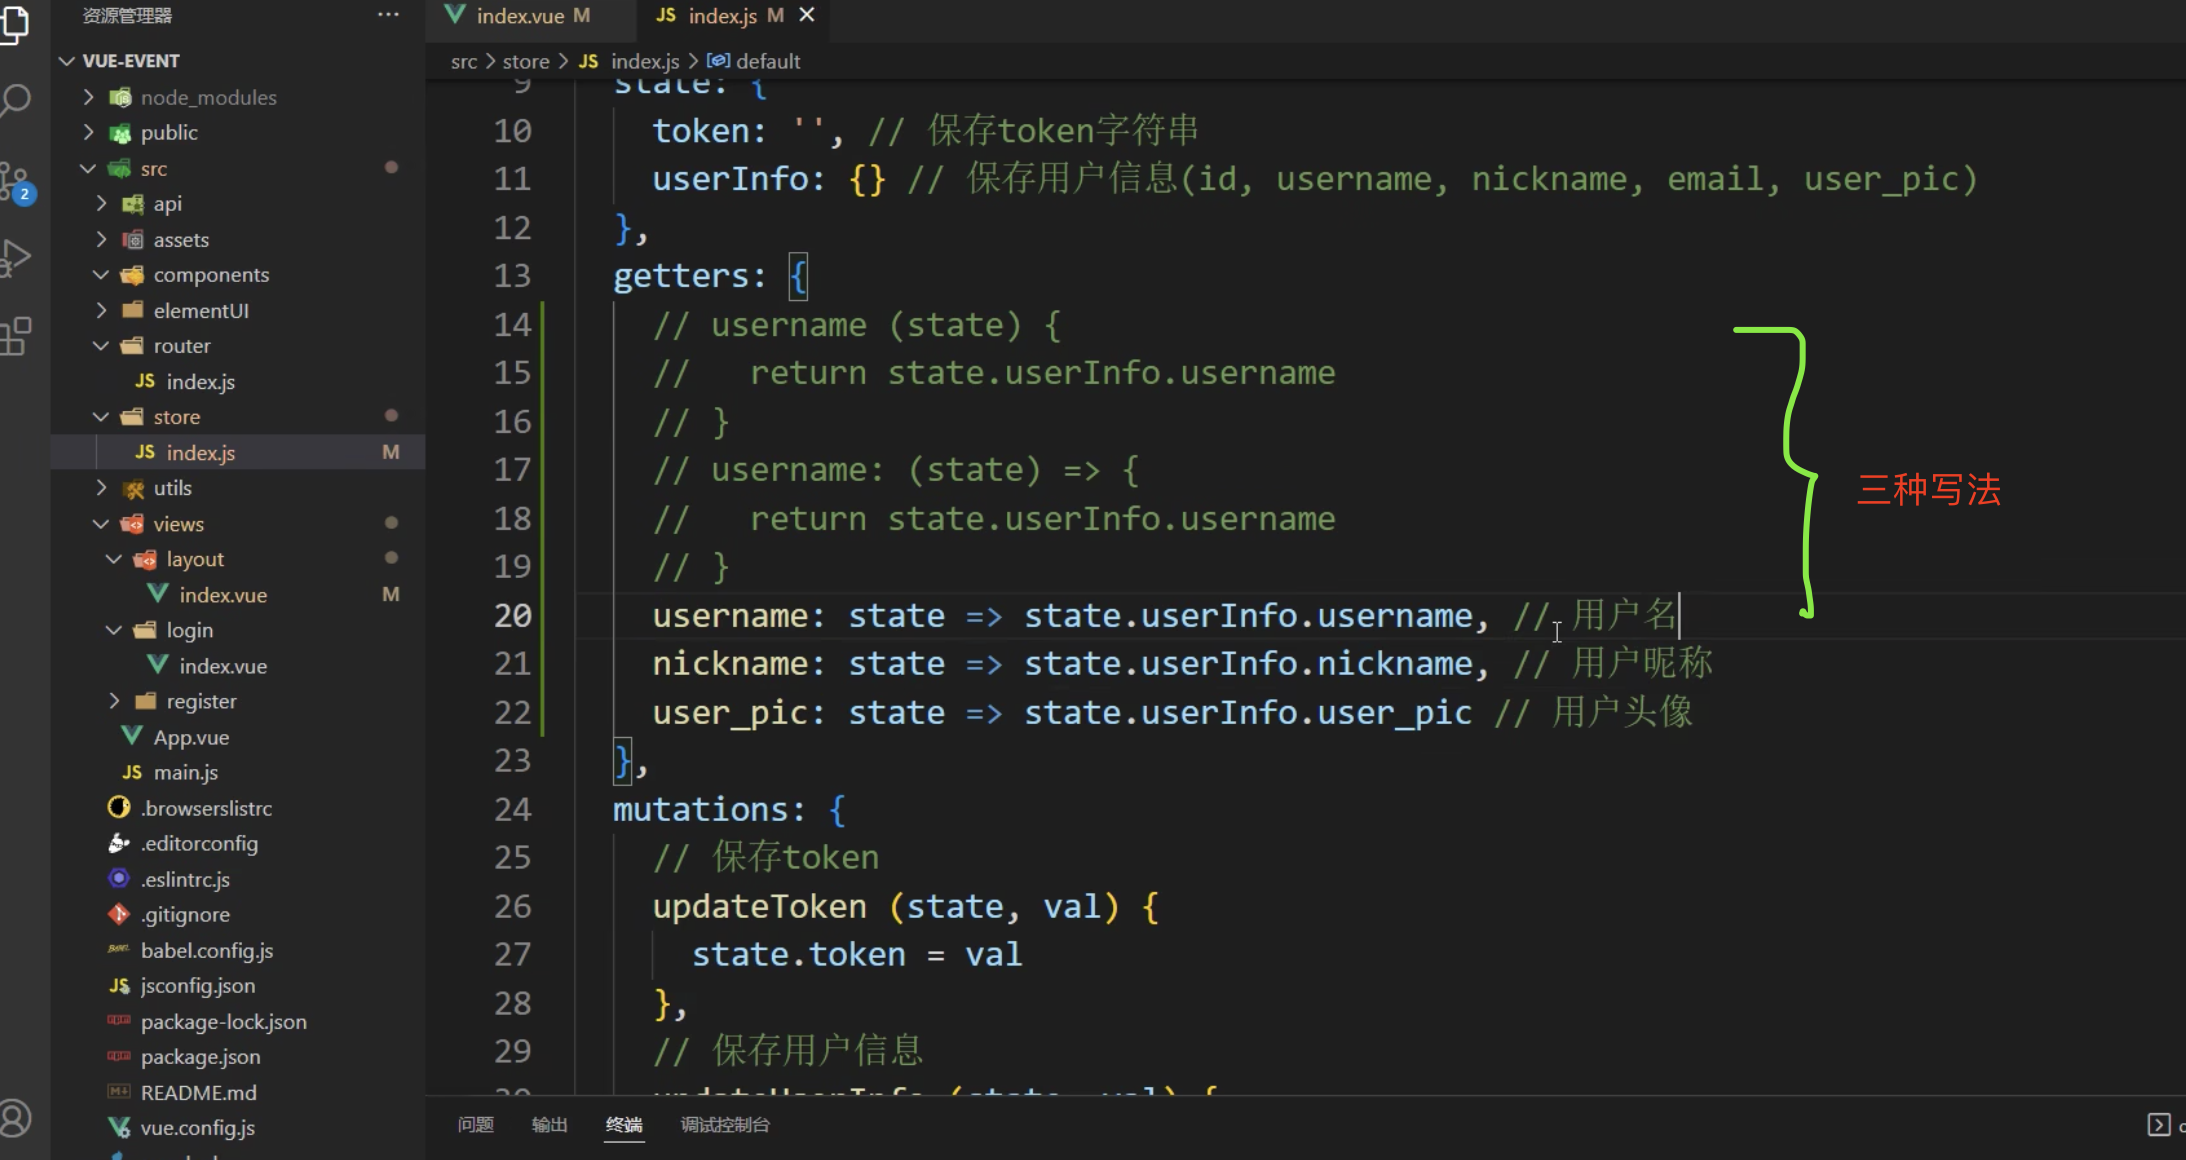
3 在src/views/layout/index.vue采用映射getters的方式定义计算属性
import { mapGetters } from 'vuex'
export default {
  computed: {
    ...mapGetters(['nickname', 'username', 'user_pic'])
  }
}
或者:
03 侧边导航准备
目标
使用elementUI组件, 开发左侧导航
讲解
在 src/views/layout/index.vue组件的 el-aside范围内div标签兄弟关系,定义左侧菜单的 UI 布局结构
<!-- 左侧边栏的用户信息 -->
<el-aside width="200px">
<div class="user-box">
<img :src="user_pic" alt="" v-if="user_pic" />
<img src="../../assets/images/head.png" alt="" v-else />
<span>欢迎 {{ nickname || username }}</span>
</div>
<!-- 左侧导航菜单 -->
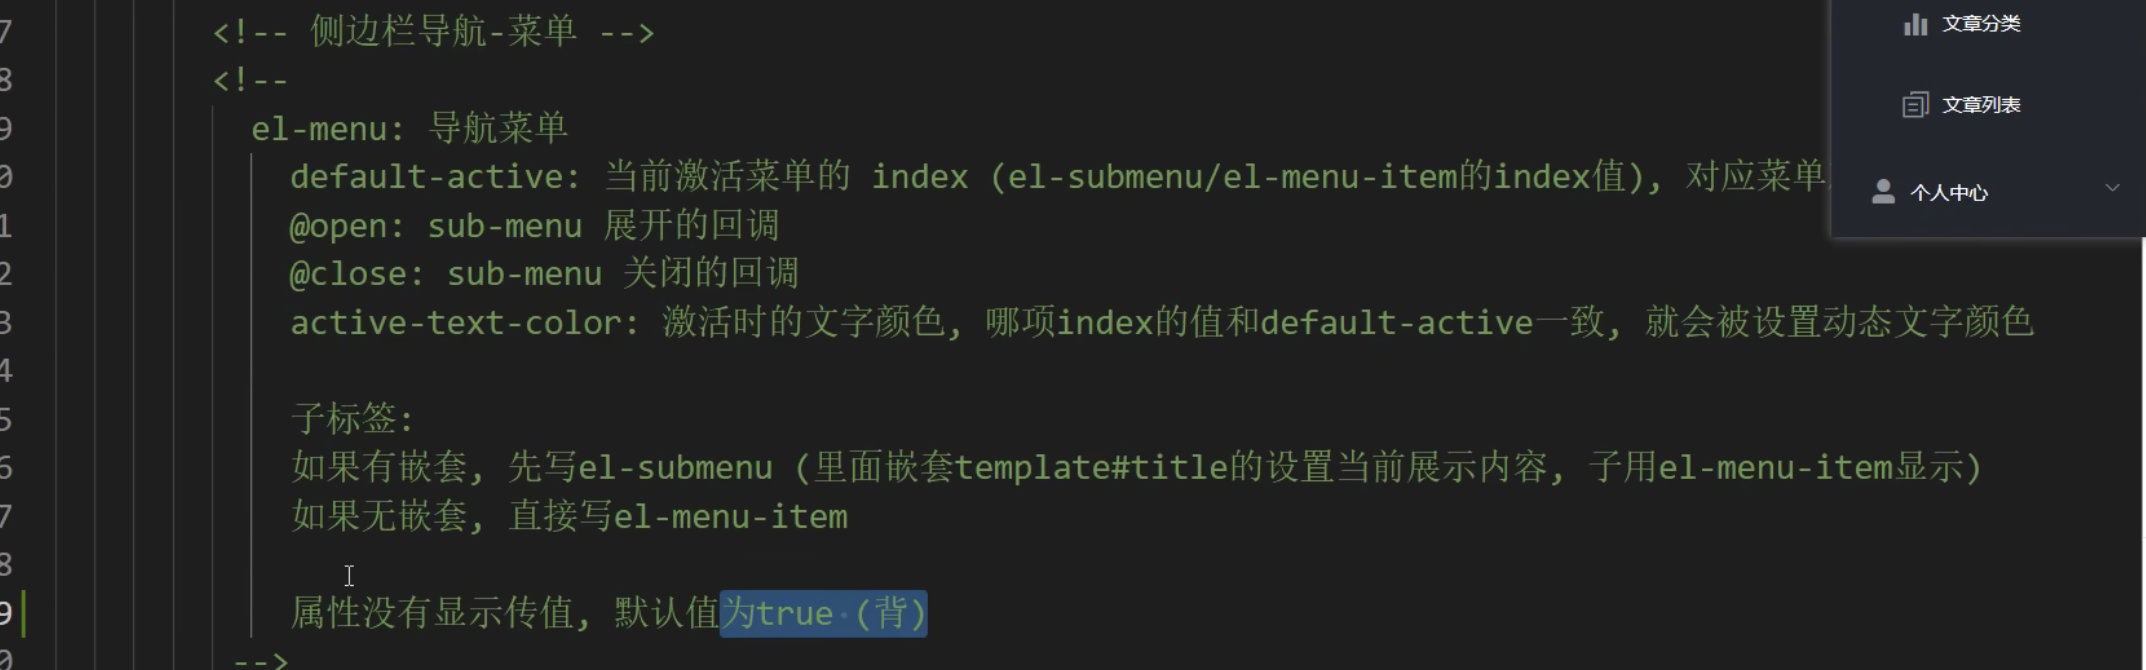
<el-menu
default-active="1"
class="el-menu-vertical-demo"
background-color="#23262E"
text-color="#fff"
active-text-color="#409EFF"
unique-opened
>
<!-- 不包含子菜单的“一级菜单” -->
<el-menu-item index="1"
><i class="el-icon-s-tools"></i>一级菜单</el-menu-item
>
<!-- 包含子菜单的“一级菜单” -->
<el-submenu index="2">
<template slot="title">
<i class="el-icon-s-tools"></i>
<span>一级菜单</span>
</template>
<el-menu-item index="2-1"
><i class="el-icon-star-on"></i>二级菜单</el-menu-item
>
<el-menu-item index="2-2"
><i class="el-icon-star-on"></i>二级菜单</el-menu-item
>
<el-menu-item index="2-3"
><i class="el-icon-star-on"></i>二级菜单</el-menu-item
>
</el-submenu>
</el-menu>
</el-aside>美化 Main.vue 组件的布局结构:
// 侧边栏菜单的样式
.el-aside {
  .el-submenu,
  .el-menu-item {
    width: 200px;
    user-select: none;
  }
}
04 布局-侧边栏导航数据
目标
从后台请求侧边栏标题等数据, 铺设侧边栏导航
讲解
在src/api/index.js封装请求侧边栏数据的接口方法
/**
 * 获取-侧边栏菜单数据
 * @returns Promise对象
 */
export const getMenusAPI = () => {
  return request({
    url: '/my/menus',
    headers: {
      Authorization: store.state.token
    }
  })
}
在src/views/layout/index.vue组件中, 引入接口方法, 发请求拿到数据, 保存到data变量中
import { getMenusAPI } from '@/api'
export default {
  // ...其他
  data () {
    return {
      menus: [] // 侧边栏数据
    }
  },
  created () {
    this.getMenusListFn()
  },
  methods: {
    // ...其他
    // 获取侧边栏菜单数据
    async getMenusListFn () {
      const { data: res } = await getMenusAPI()
      console.log(res)
      this.menus = res.data
    }
  }
}
循环渲染左侧的一级和二级菜单数据铺设
{
    "code":0,
    "message":"获取左侧菜单成功!",
    "data":[
        {
            "indexPath":"/home",
            "title":"首页",
            "icon":"el-icon-s-home",
            "children":null
        },
        {
            "indexPath":"2",
            "title":"文章管理",
            "icon":"el-icon-s-order",
            "children":[
                {
                    "indexPath":"/art-cate",
                    "title":"文章分类",
                    "icon":"el-icon-s-data"
                },
                {
                    "indexPath":"/art-list",
                    "title":"文章列表",
                    "icon":"el-icon-document-copy"
                }
            ]
        },
        {
            "indexPath":"3",
            "title":"个人中心",
            "icon":"el-icon-user-solid",
            "children":[
                {
                    "indexPath":"/user-info",
                    "title":"基本资料",
                    "icon":"el-icon-s-operation"
                },
                {
                    "indexPath":"/user-avatar",
                    "title":"更换头像",
                    "icon":"el-icon-camera"
                },
                {
                    "indexPath":"/user-pwd",
                    "title":"重置密码",
                    "icon":"el-icon-key"
                }
            ]
        }
    ]
}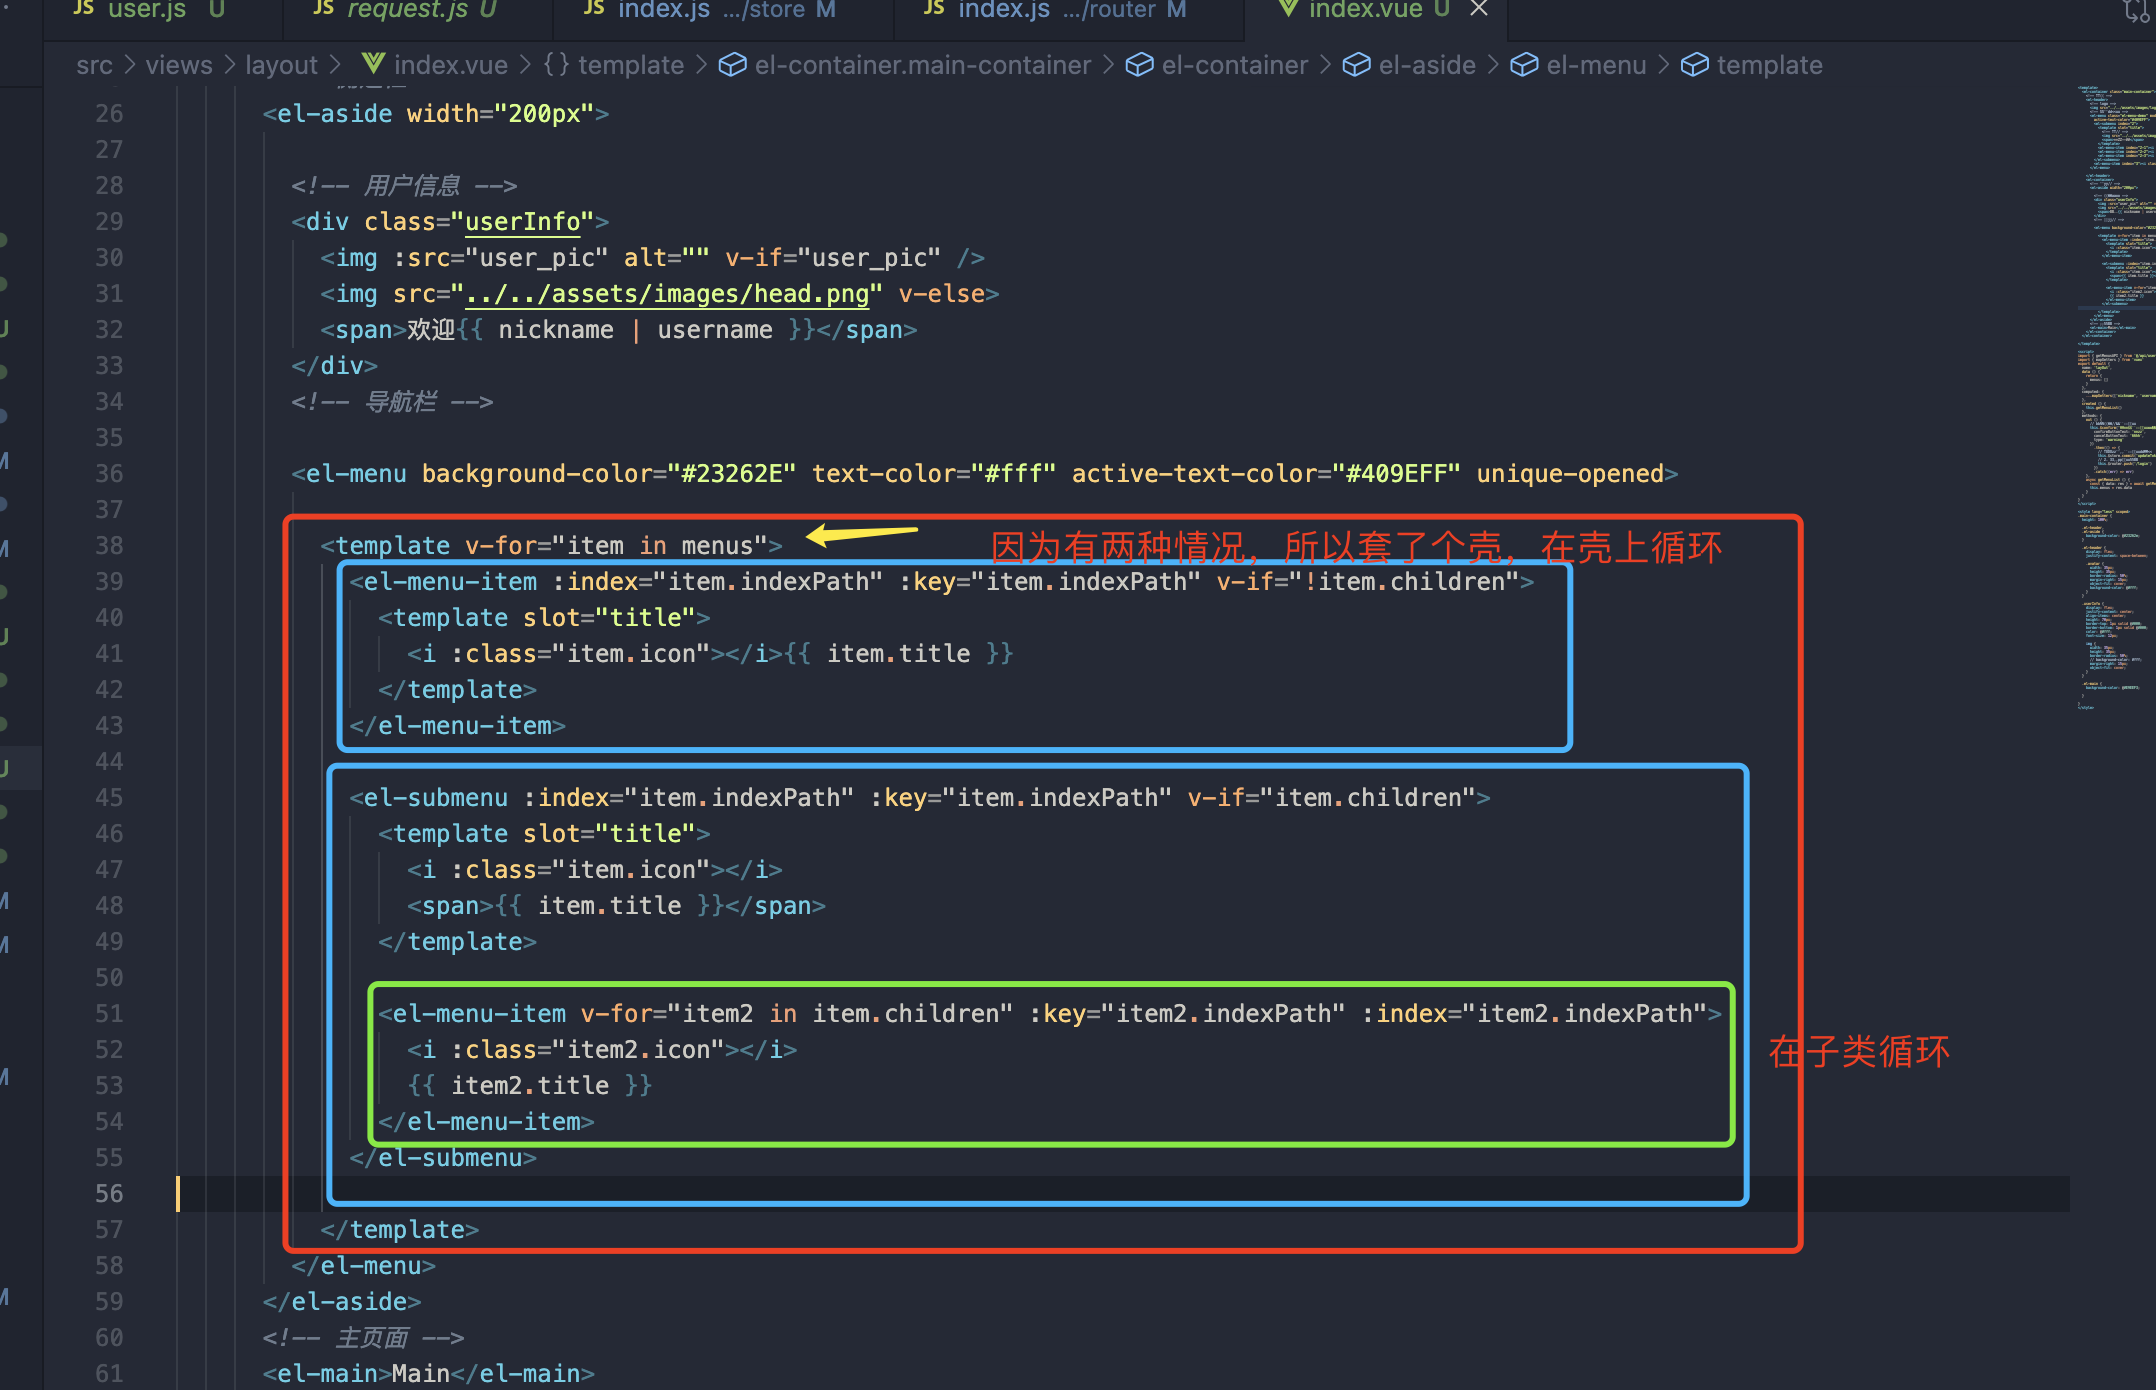
 <!-- 左侧导航菜单 -->
          <el-menu default-active="1" class="el-menu-vertical-demo" background-color="#23262E" text-color="#fff"
            active-text-color="#409EFF" unique-opened>
            <template v-for="item in menus">
              <!-- 不包含子菜单的“一级菜单” -->
              <el-menu-item :index="item.indexPath" :key="item.indexPath" v-if="!item.children">
                <i :class="item.icon"></i>{{ item.title }}
              </el-menu-item>
              <!-- 包含子菜单的“一级菜单” -->
              <el-submenu :index="item.indexPath" :key="item.indexPath" v-else>
                <template slot="title">
                  <i :class="item.icon"></i>
                  <span>{{ item.title }}</span>
                </template>
                <!-- 循环渲染“二级菜单” -->
                <el-menu-item :index="subItem.indexPath" v-for="subItem in item.children" :key="subItem.indexPath">
                  <i :class="subItem.icon"></i>{{ subItem.title }}
                </el-menu-item>
              </el-submenu>
            </template>
          </el-menu>
修改 el-menu组件的 default-active属性,可以设置默认激活的左侧菜单, 为首页路由路径
<el-menu
    default-active="/home"
    class="el-menu-vertical-demo"
    background-color="#23262E"
    text-color="#fff"
    active-text-color="#409EFF"
    unique-opened
   ></el-menu>
为 el-menu 组件添加 router 属性,可以开启左侧菜单的路由模式
<el-menu
    default-active="/home"
    class="el-menu-vertical-demo"
    background-color="#23262E"
    text-color="#fff"
    active-text-color="#409EFF"
    unique-opened
    router
   ></el-menu>
点击左侧导航, 查看路由地址是否切换
注意:
如果想是header 和footer固定住,只需要给el-container 添加个高度即可
05.axios-请求拦截器
目标
掌握axios请求拦截器使用, 在其中统一携带token
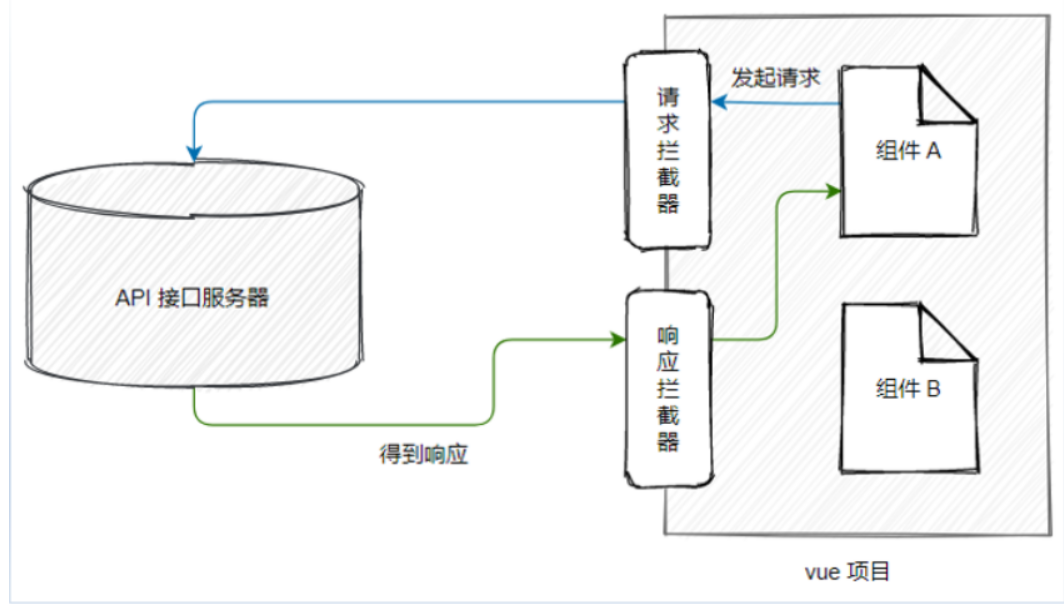
讲解
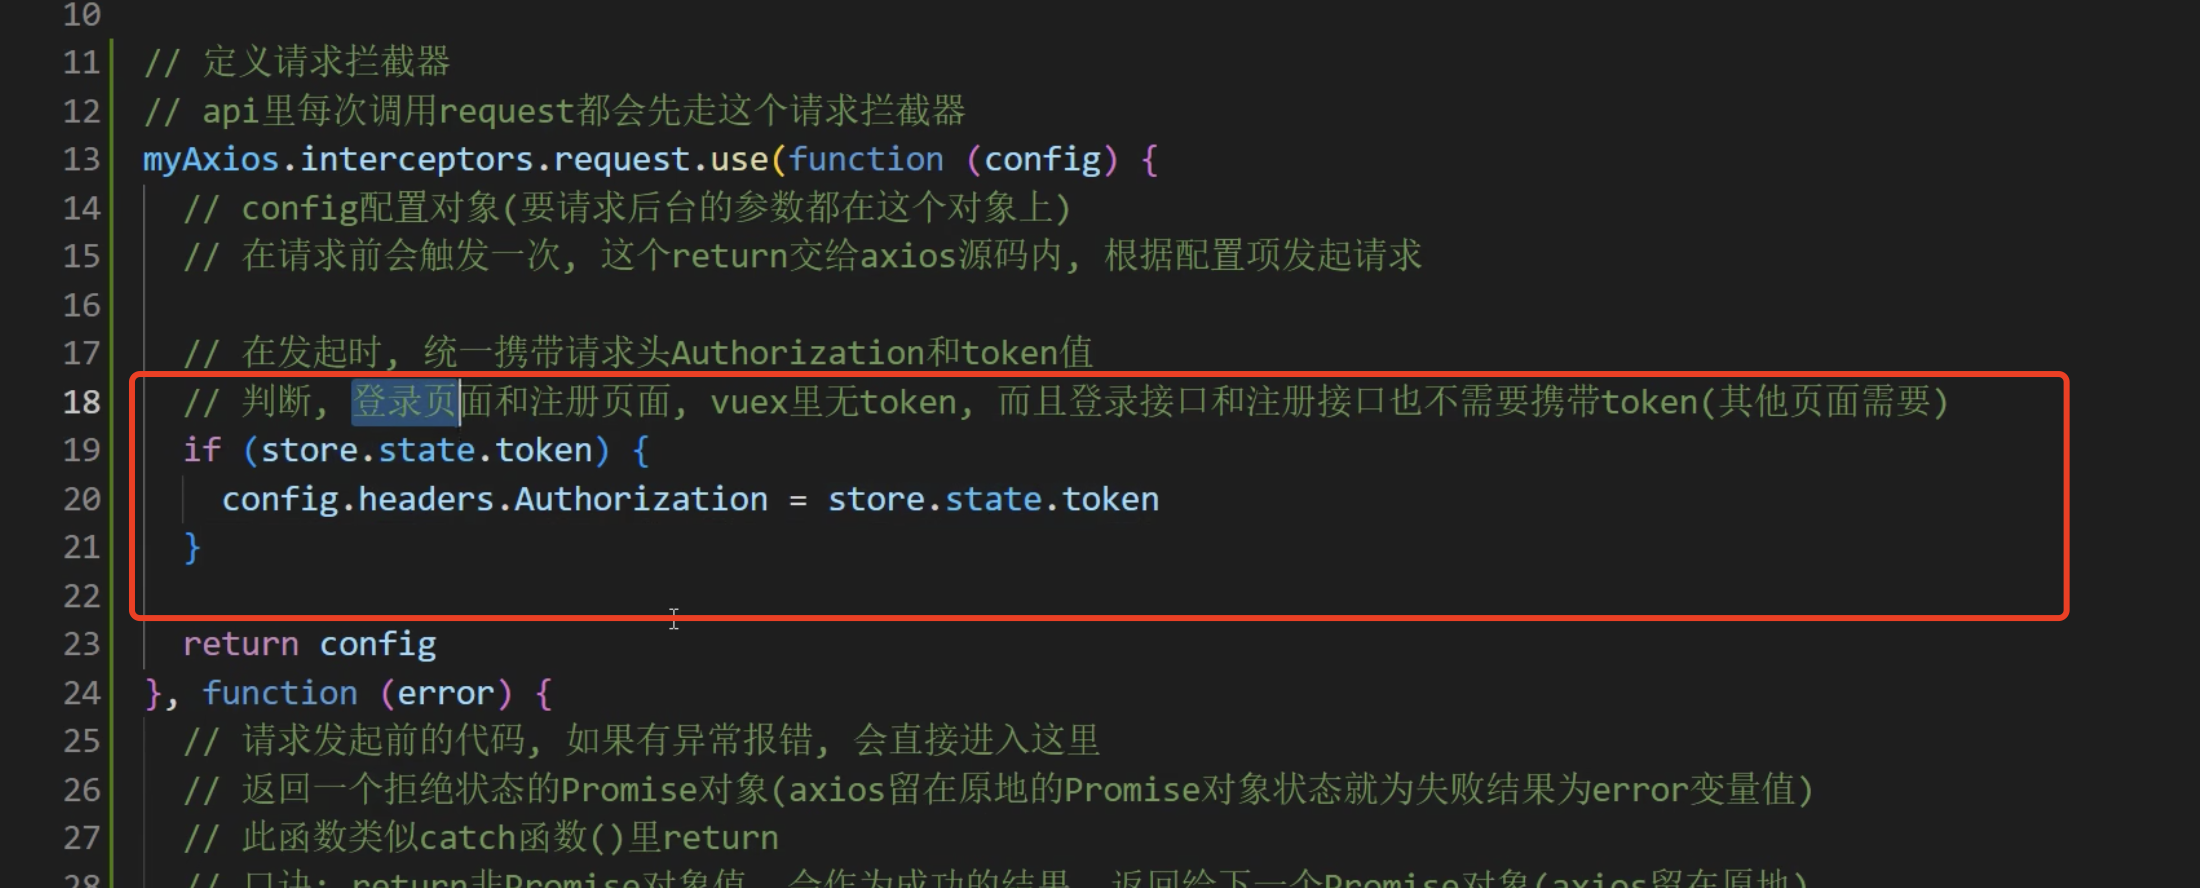
正常接口方法里, 在函数里请求headers参数需要写多个, 要修改需要改多处, 所以我们决定在请求拦截器统一携带
在utils/request.js中, 使用自定义axios函数绑定请求拦截器, 判断有token再携带到请求头上
// 定义请求拦截器
myAxios.interceptors.request.use(function (config) {
  // 为请求头挂载 Authorization 字段
  config.headers.Authorization = store.state.token
  return config
}, function (error) {
  return Promise.reject(error)
})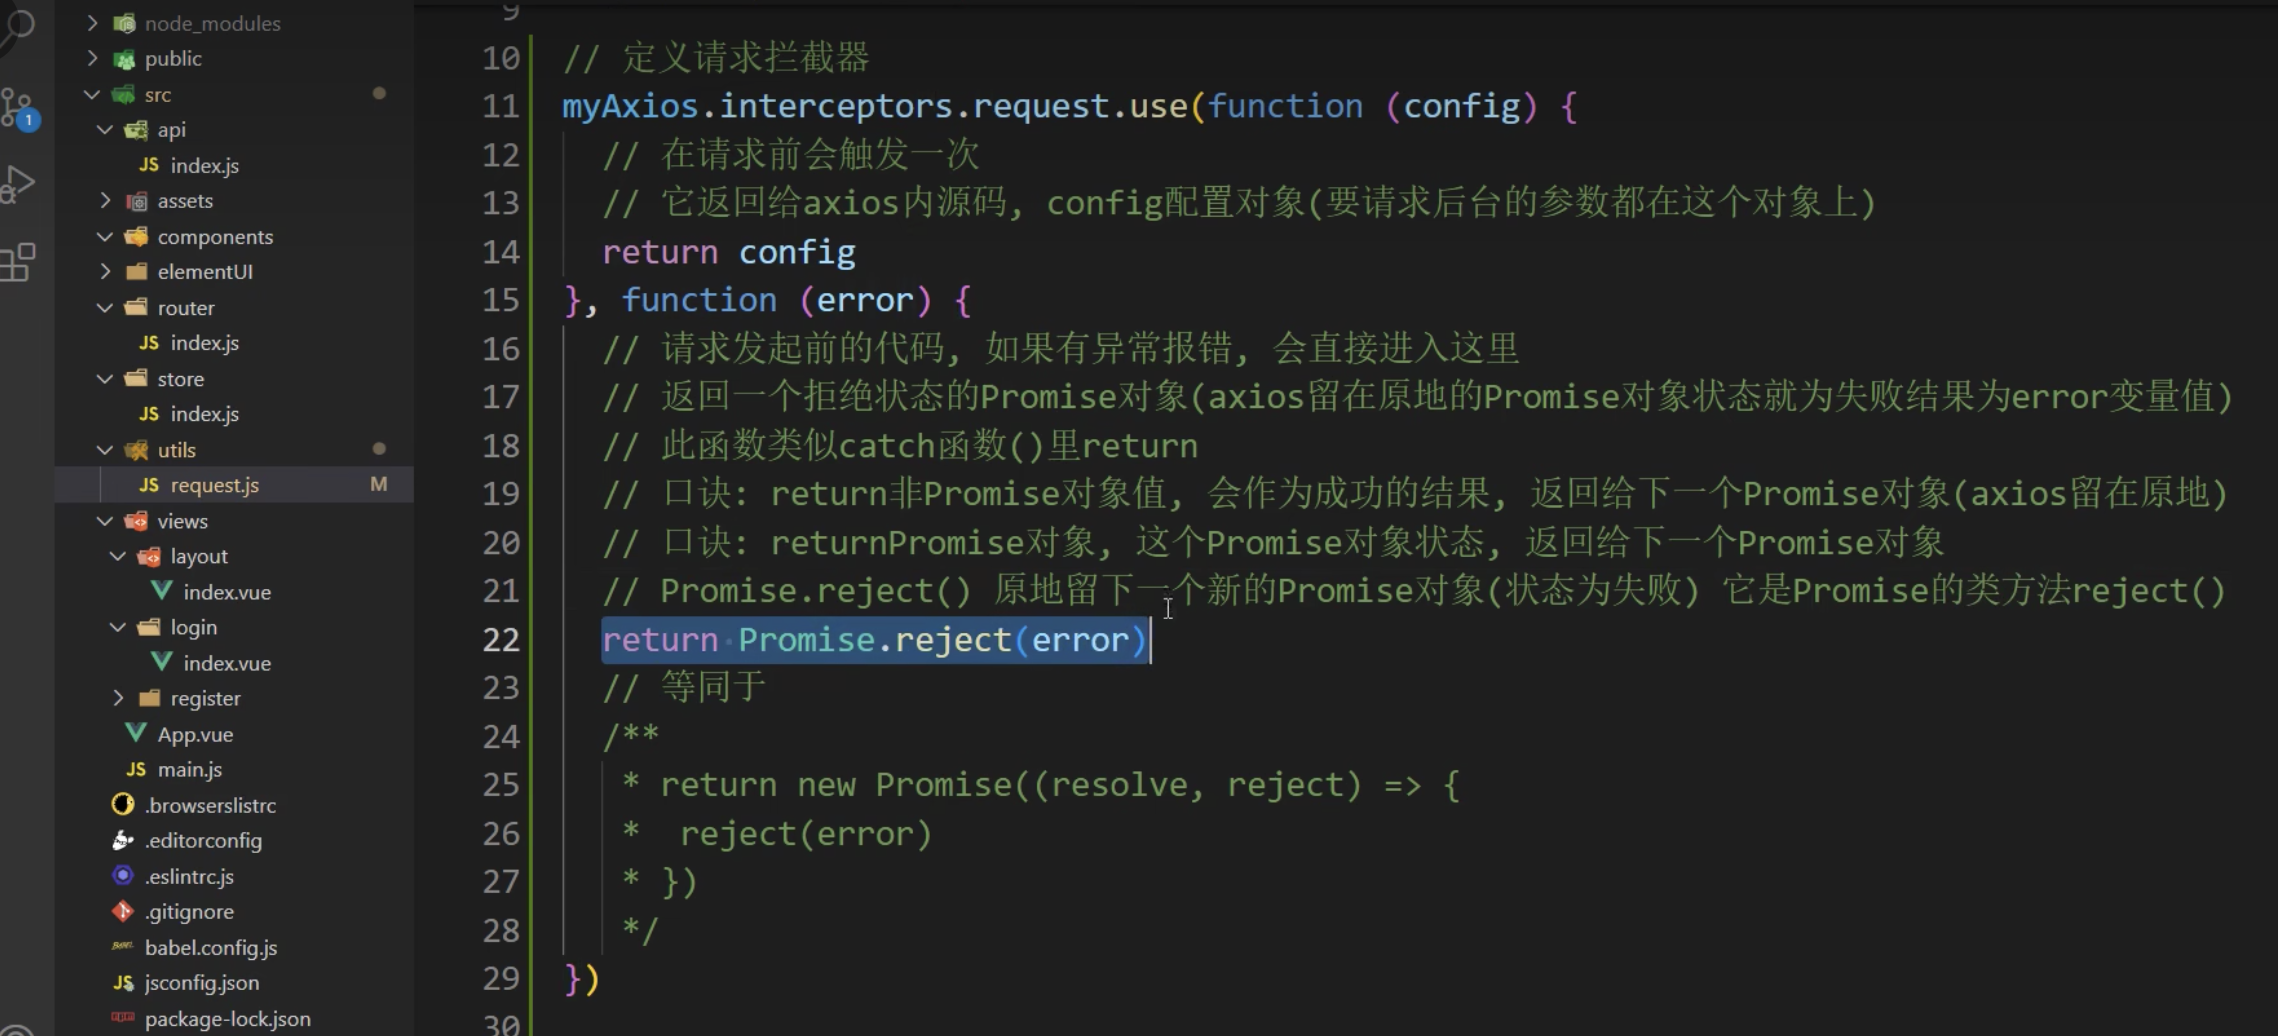
3 这是一个后台管理类项目, 除了登录和注册接口后端不要求使用token, 其他接口都得携带token
判断请求地址 登录: /api/login 和 注册: /api/reg
// 白名单: 不需要携带token的api地址
const whiteAPIList = ['/api/reg', '/api/login']
// 定义请求拦截器
myAxios.interceptors.request.use(function (config) {
  if (!whiteAPIList.includes(config.url)) {
    // 为请求头挂载 Authorization 字段
    config.headers.Authorization = store.state.token
  }
  return config
}, function (error) {
  return Promise.reject(error)
})
或者:
4 发请求看看登录/获取菜单的network里, 请求头上是否有Authorization和token值携带
06权限-控制访问
目标
当用户未登录的时候, 是无法访问到这个内部项目的正常页面的
讲解
可以在路由全局前置守卫判断当前vuex里是否有token
有token值证明刚才登录过, 无token值证明未登录
router.beforeEach((to, from, next) => {
  const token = store.state.token
  if (token) {
    // 如果有token, 证明已登录
    if (!store.state.userInfo.username) {
      // 有token但是没有用户信息, 才去请求用户信息保存到vuex里
      // 调用actions里方法请求数据
      store.dispatch('initUserInfo')
      // 下次切换页面vuex里有用户信息数据就不会重复请求用户信息
    }
    next() // 路由放行
  } else {
    next('/login')
  }
})
在主页删除本地的vuex数据, 刷新页面让vuex取出来空的token, 但是发现递归了
原因: 因为强制跳转到登录页也会让路由守卫再次触发, 又判断无token, 再次跳转登录页, 就递归了
解决: 登录页面应该是无需判断token的, 还有注册页面, 所以设置白名单, 无token要去这2个页面直接放行
// 无需验证token的页面
const whiteList = ['/login', '/reg']
router.beforeEach((to, from, next) => {
  const token = store.state.token
  if (token) {
    // 如果有token, 证明已登录
    if (!store.state.userInfo.username) {
      // 有token但是没有用户信息, 才去请求用户信息保存到vuex里
      // 调用actions里方法请求数据
      store.dispatch('initUserInfo')
      // 下次切换页面vuex里有用户信息数据就不会重复请求用户信息
    }
    next() // 路由放行
  } else {
    // 如果无token
    // 如果去的是白名单页面, 则放行
    if (whiteList.includes(to.path)) {
      next()
    } else {
      // 如果其他页面请强制拦截并跳转到登录页面
      next('/login')
    }
  }
})
小结
无token的时候, 还需要判断什么?
答案
07.axios-响应拦截器
目标
如果token有, 但是过期了怎么办
讲解
前端是无法判断token是否过期了的, 所以当某次发请求把token带给后台做验证的时候
后台发现token过期了, 则会返回响应状态码401
但是你又不确定在哪个请求会401, 所以要用统一的响应拦截器做判断
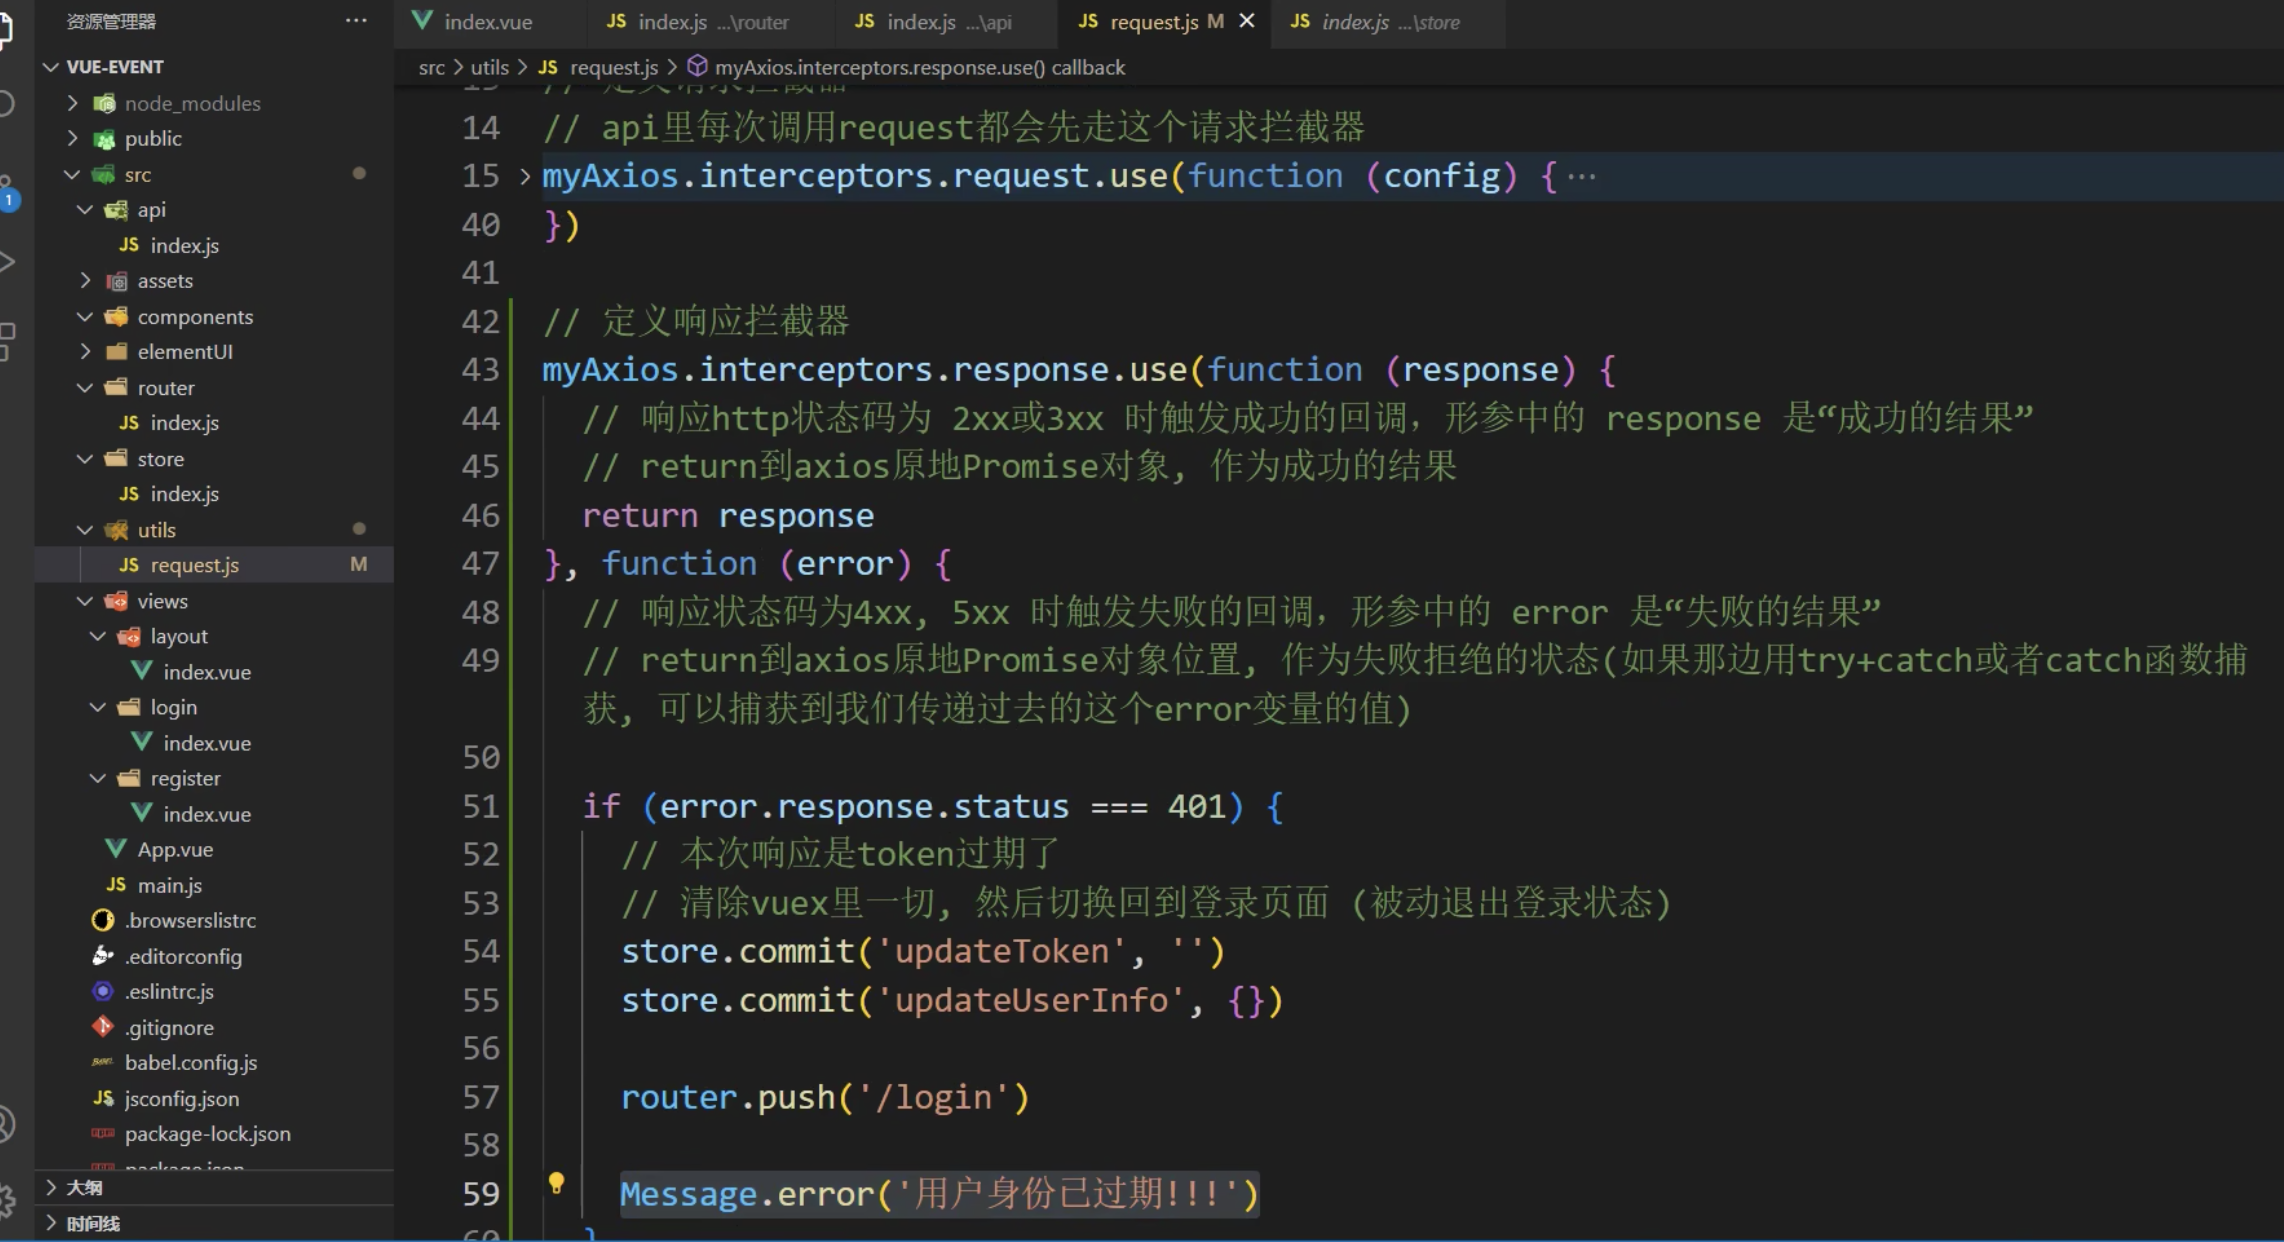
在src/utils/request.js中, 给自定义axios函数添加响应拦截器
响应状态码2xx和3xx进入第一个函数, 直接返回响应内容, 如果响应状态码为4xx和5xx则会进入第二个函数, 我们做具体判断和逻辑
return 会返回到本次请求的Promise对象位置
// 定义响应拦截器
myAxios.interceptors.response.use(function (response) {
  // 响应状态码为 2xx 时触发成功的回调,形参中的 response 是“成功的结果”
  return response
}, function (error) {
  // 响应状态码不是 2xx 时触发失败的回调,形参中的 error 是“失败的结果”
  return Promise.reject(error)
})
在第二个函数, 编写判断401状态码, token过期做出的处理逻辑
// 定义响应拦截器
myAxios.interceptors.response.use(function (response) {
  // 响应状态码为 2xx 时触发成功的回调,形参中的 response 是“成功的结果”
  return response
}, function (error) {
  // 响应状态码不是 2xx 时触发失败的回调,形参中的 error 是“失败的结果”
  if (error.response.status === 401) {
    // 无效的 token
    // 把 Vuex 中的 token 重置为空,并跳转到登录页面
    store.commit('updateToken', '')
    router.push('/login')
  }
  return Promise.reject(error)
})
可以手动修改本地token值, 乱改一个, 导致它过期, 试试是否能自动回到登录页面
小结
我们在哪里, 如何判断token过期问题?
答案
08.首页-标签和路由
目标
把首页的组件创建标签和路由配置好
讲解
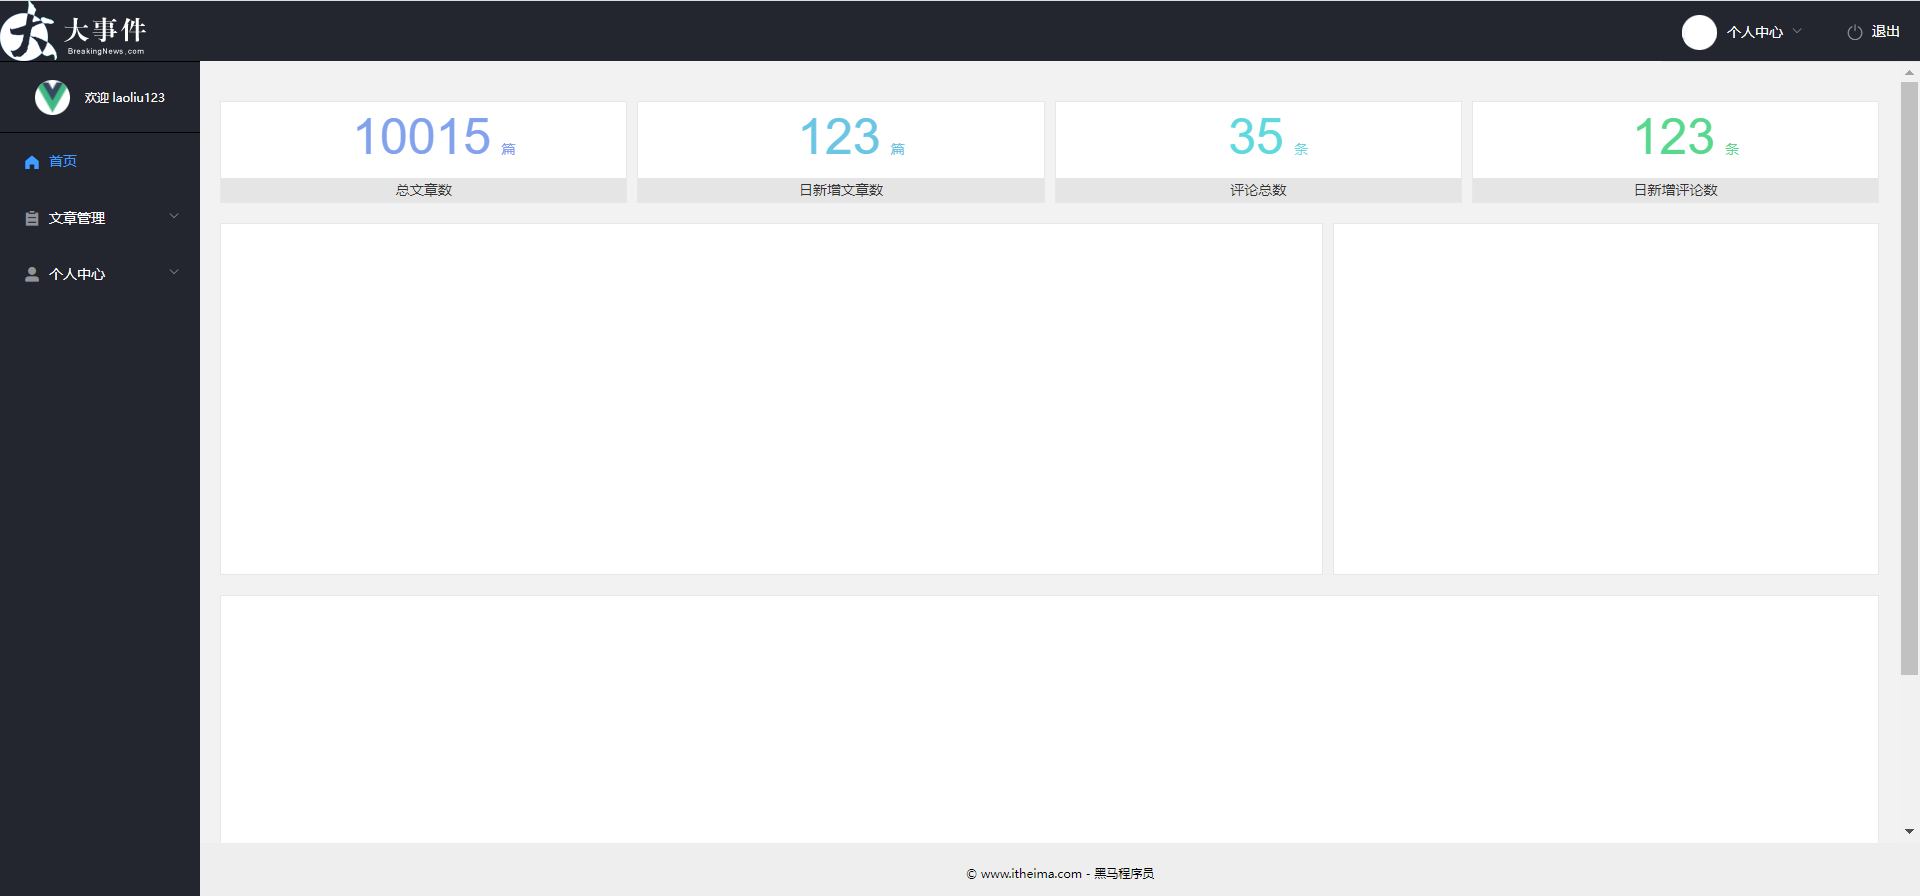
在 src/views/目录下,新建 /home/index.vue组件,并初始化如下的组件结构
用了响应式布局: 最小时候占两列,大的时候占4列:sm="6" :xs="12"
使用 el-col 不用指定宽度了,和行边距了,里边的div只需要设置高度即可
一行24
第一行 平分四份,每一份占6个。 边距用:gutter
<el-row :gutter="10">
<el-col :sm="6" :xs="12"> </el-col>
<el-col :sm="6" :xs="12"></el-col>
<el-col :sm="6" :xs="12"></el-col>
<el-col :sm="6" :xs="12"> </el-col>
</el-row>
第二行
<el-row :gutter="10">
<el-col :sm="16" :xs="16"> </el-col>
<el-col :sm="8" :xs="8"></el-col>
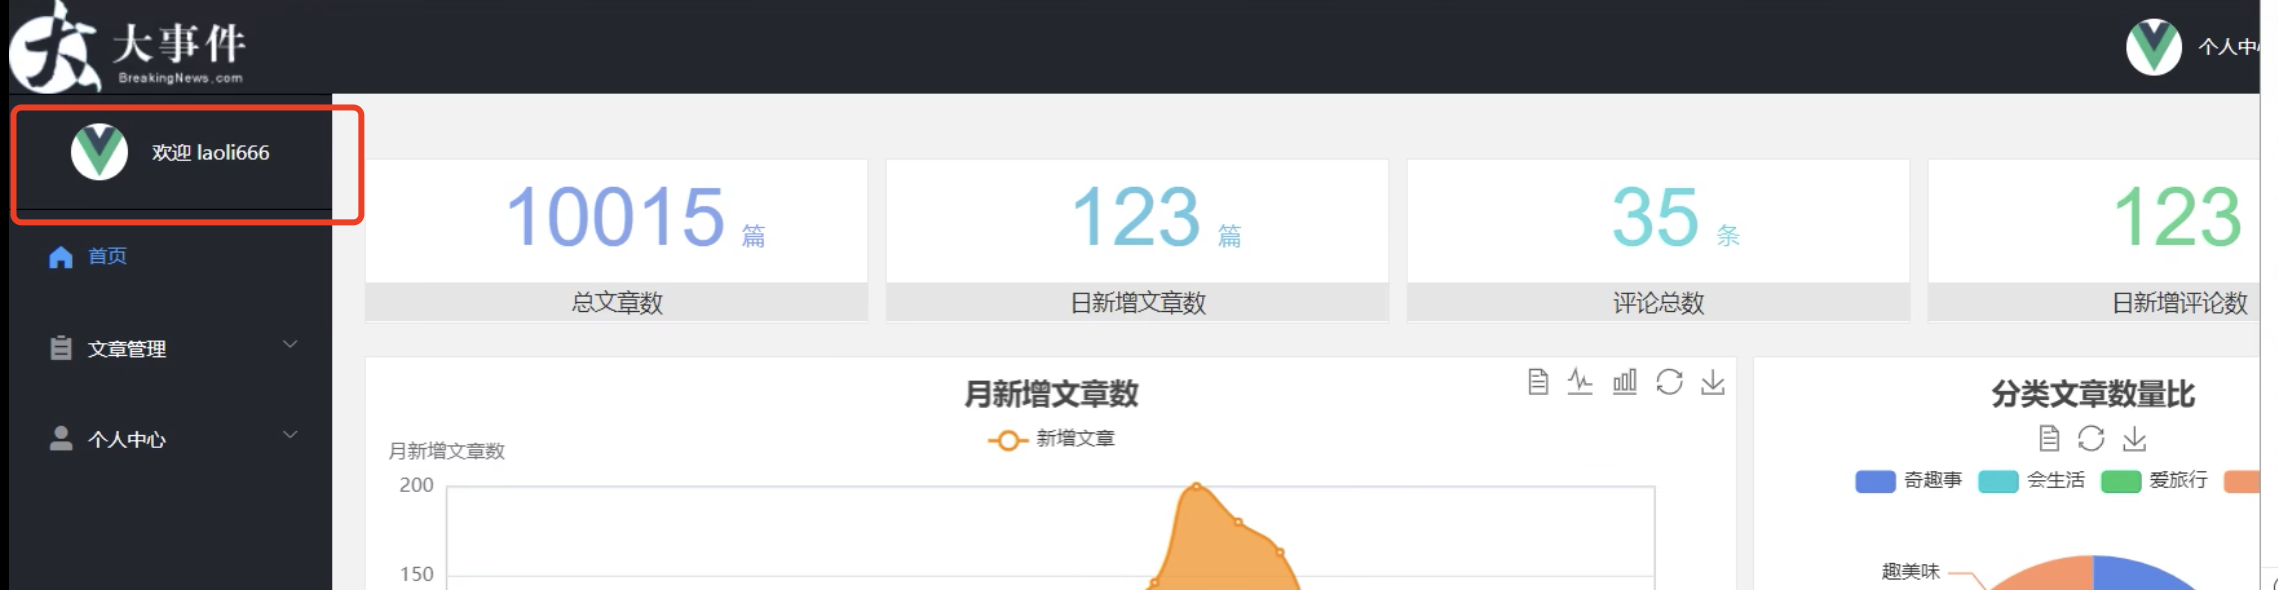
</el-row><template>
<div>
<div class="container-fluid">
<el-row class="spannel_list" :gutter="10">
<el-col :sm="6" :xs="12">
<div class="spannel">
<em>10015</em><span>篇</span>
<b>总文章数</b>
</div>
</el-col>
<el-col :sm="6" :xs="12">
<div class="spannel scolor01">
<em>123</em><span>篇</span>
<b>日新增文章数</b>
</div>
</el-col>
<el-col :sm="6" :xs="12">
<div class="spannel scolor02">
<em>35</em><span>条</span>
<b>评论总数</b>
</div>
</el-col>
<el-col :sm="6" :xs="12">
<div class="spannel scolor03">
<em>123</em><span>条</span>
<b>日新增评论数</b>
</div>
</el-col>
</el-row>
</div>
<div class="container-fluid">
<el-row class="curve-pie" :gutter="10">
<el-col :sm="16" :xs="16">
<div class="gragh_pannel" id="curve_show"></div>
</el-col>
<el-col :sm="8" :xs="8">
<div class="gragh_pannel" id="pie_show"></div>
</el-col>
</el-row>
</div>
<div class="container-fluid">
<div class="column_pannel" id="column_show"></div>
</div>
</div>
</template>
<script>
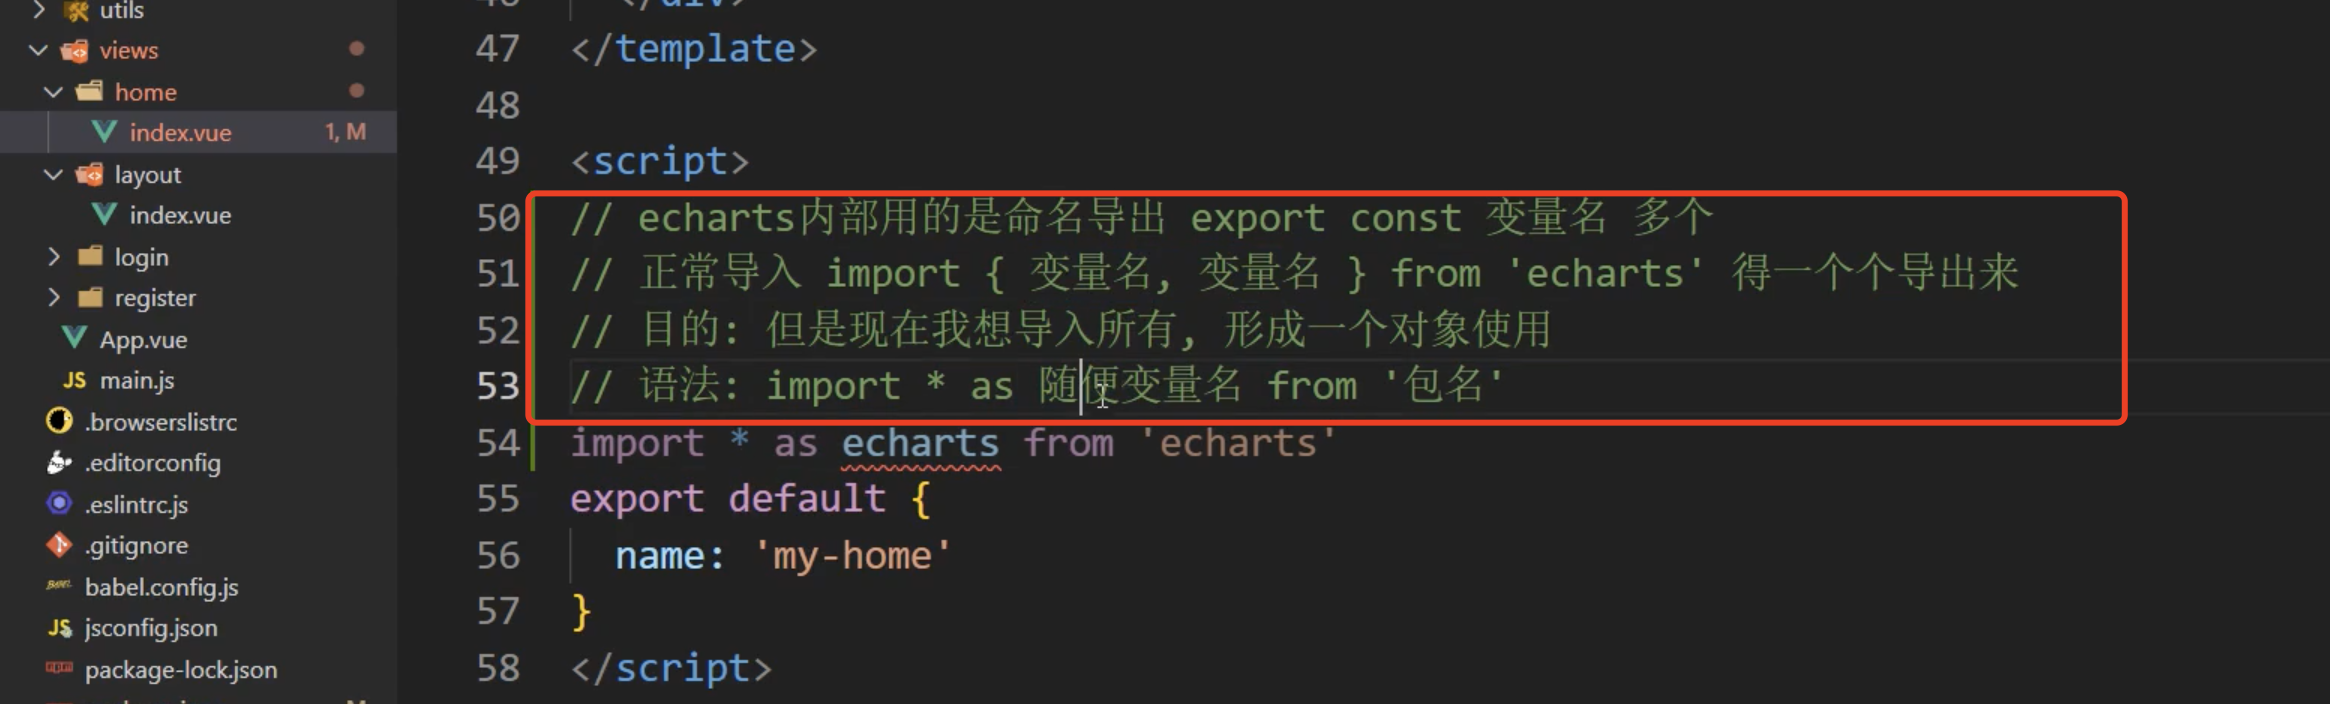
import * as echarts from 'echarts'
export default {
name: 'my-home'
}
</script>
<style lang="less" scoped>
.spannel_list {
margin-top: 20px;
}
.spannel {
height: 100px;
overflow: hidden;
text-align: center;
position: relative;
background-color: #fff;
border: 1px solid #e7e7e9;
margin-bottom: 20px;
}
.spannel em {
font-style: normal;
font-size: 50px;
line-height: 50px;
display: inline-block;
margin: 10px 0 0 20px;
font-family: 'Arial';
color: #83a2ed;
}
.spannel span {
font-size: 14px;
display: inline-block;
color: #83a2ed;
margin-left: 10px;
}
.spannel b {
position: absolute;
left: 0;
bottom: 0;
width: 100%;
line-height: 24px;
background: #e5e5e5;
color: #333;
font-size: 14px;
font-weight: normal;
}
.scolor01 em,
.scolor01 span {
color: #6ac6e2;
}
.scolor02 em,
.scolor02 span {
color: #5fd9de;
}
.scolor03 em,
.scolor03 span {
color: #58d88e;
}
.gragh_pannel {
height: 350px;
border: 1px solid #e7e7e9;
background-color: #fff !important;
margin-bottom: 20px;
}
.column_pannel {
margin-bottom: 20px;
height: 400px;
border: 1px solid #e7e7e9;
background-color: #fff !important;
}
</style>配置路由在src/router/index.js中
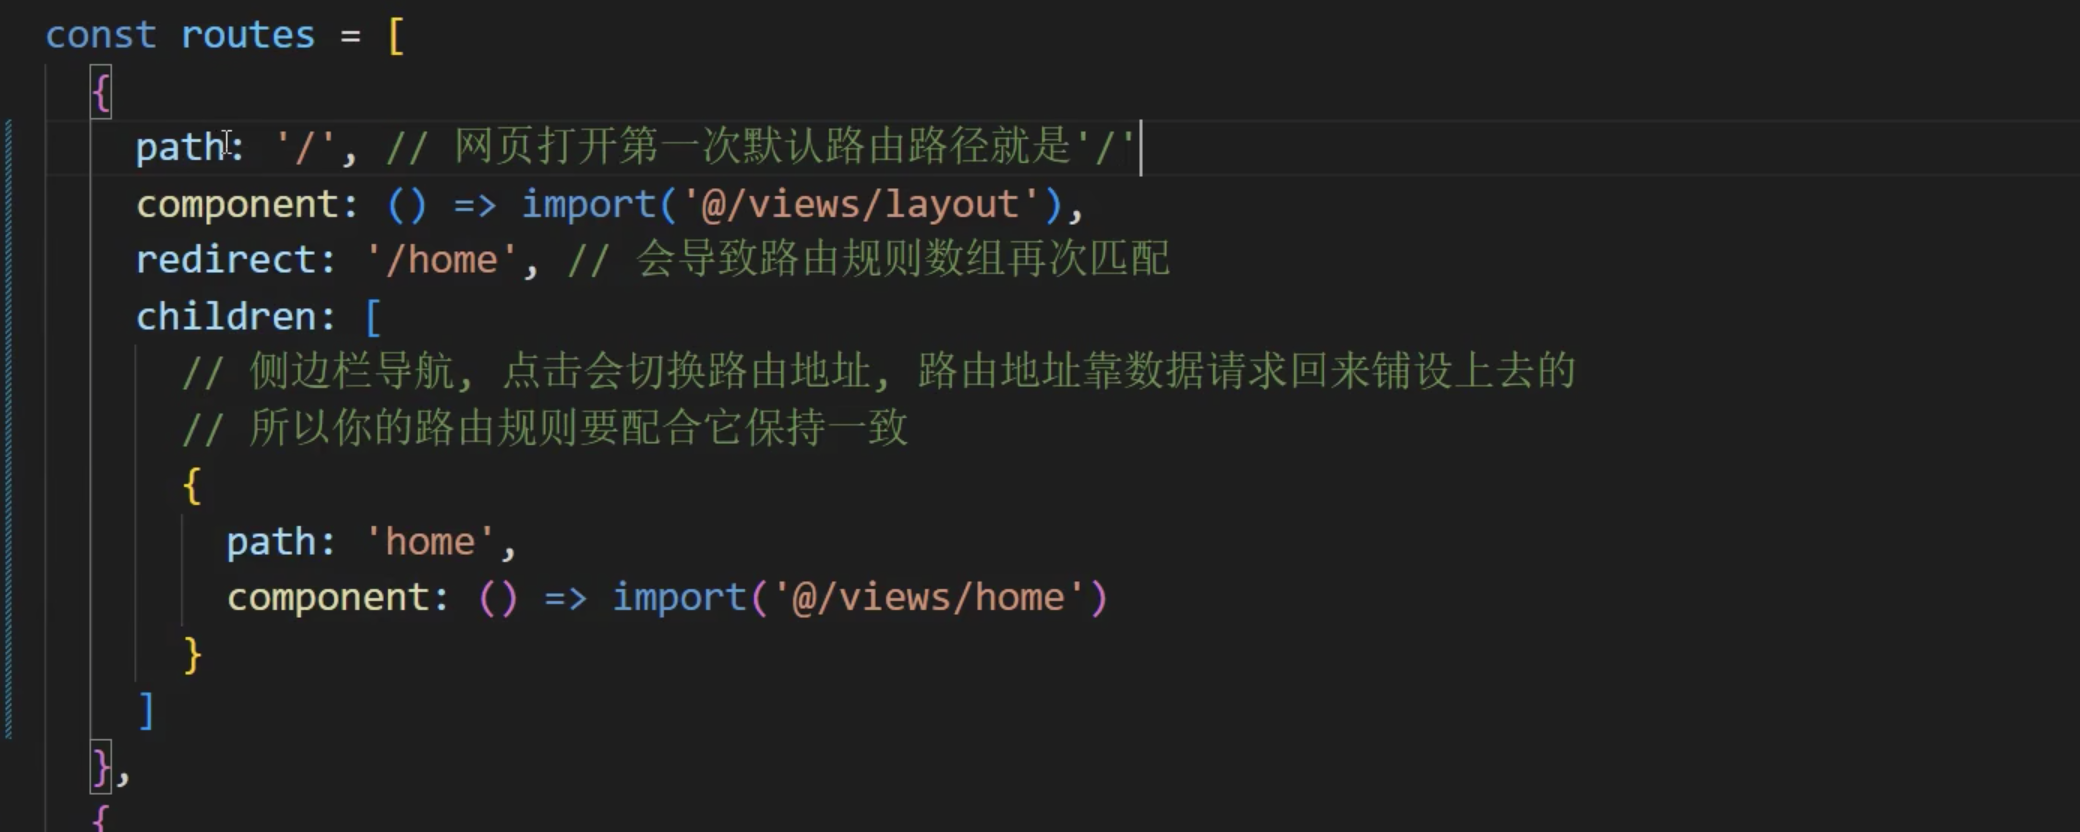
 {
    path: '/',
    component: () => import('@/views/layout'),
    redirect: '/home', // 默认显示首页的二级路由
    children: [
      {
        path: 'home',
        component: () => import('@/views/home')
      }
    ]
  },
/匹配了一级路由,/home 匹配了二级路由
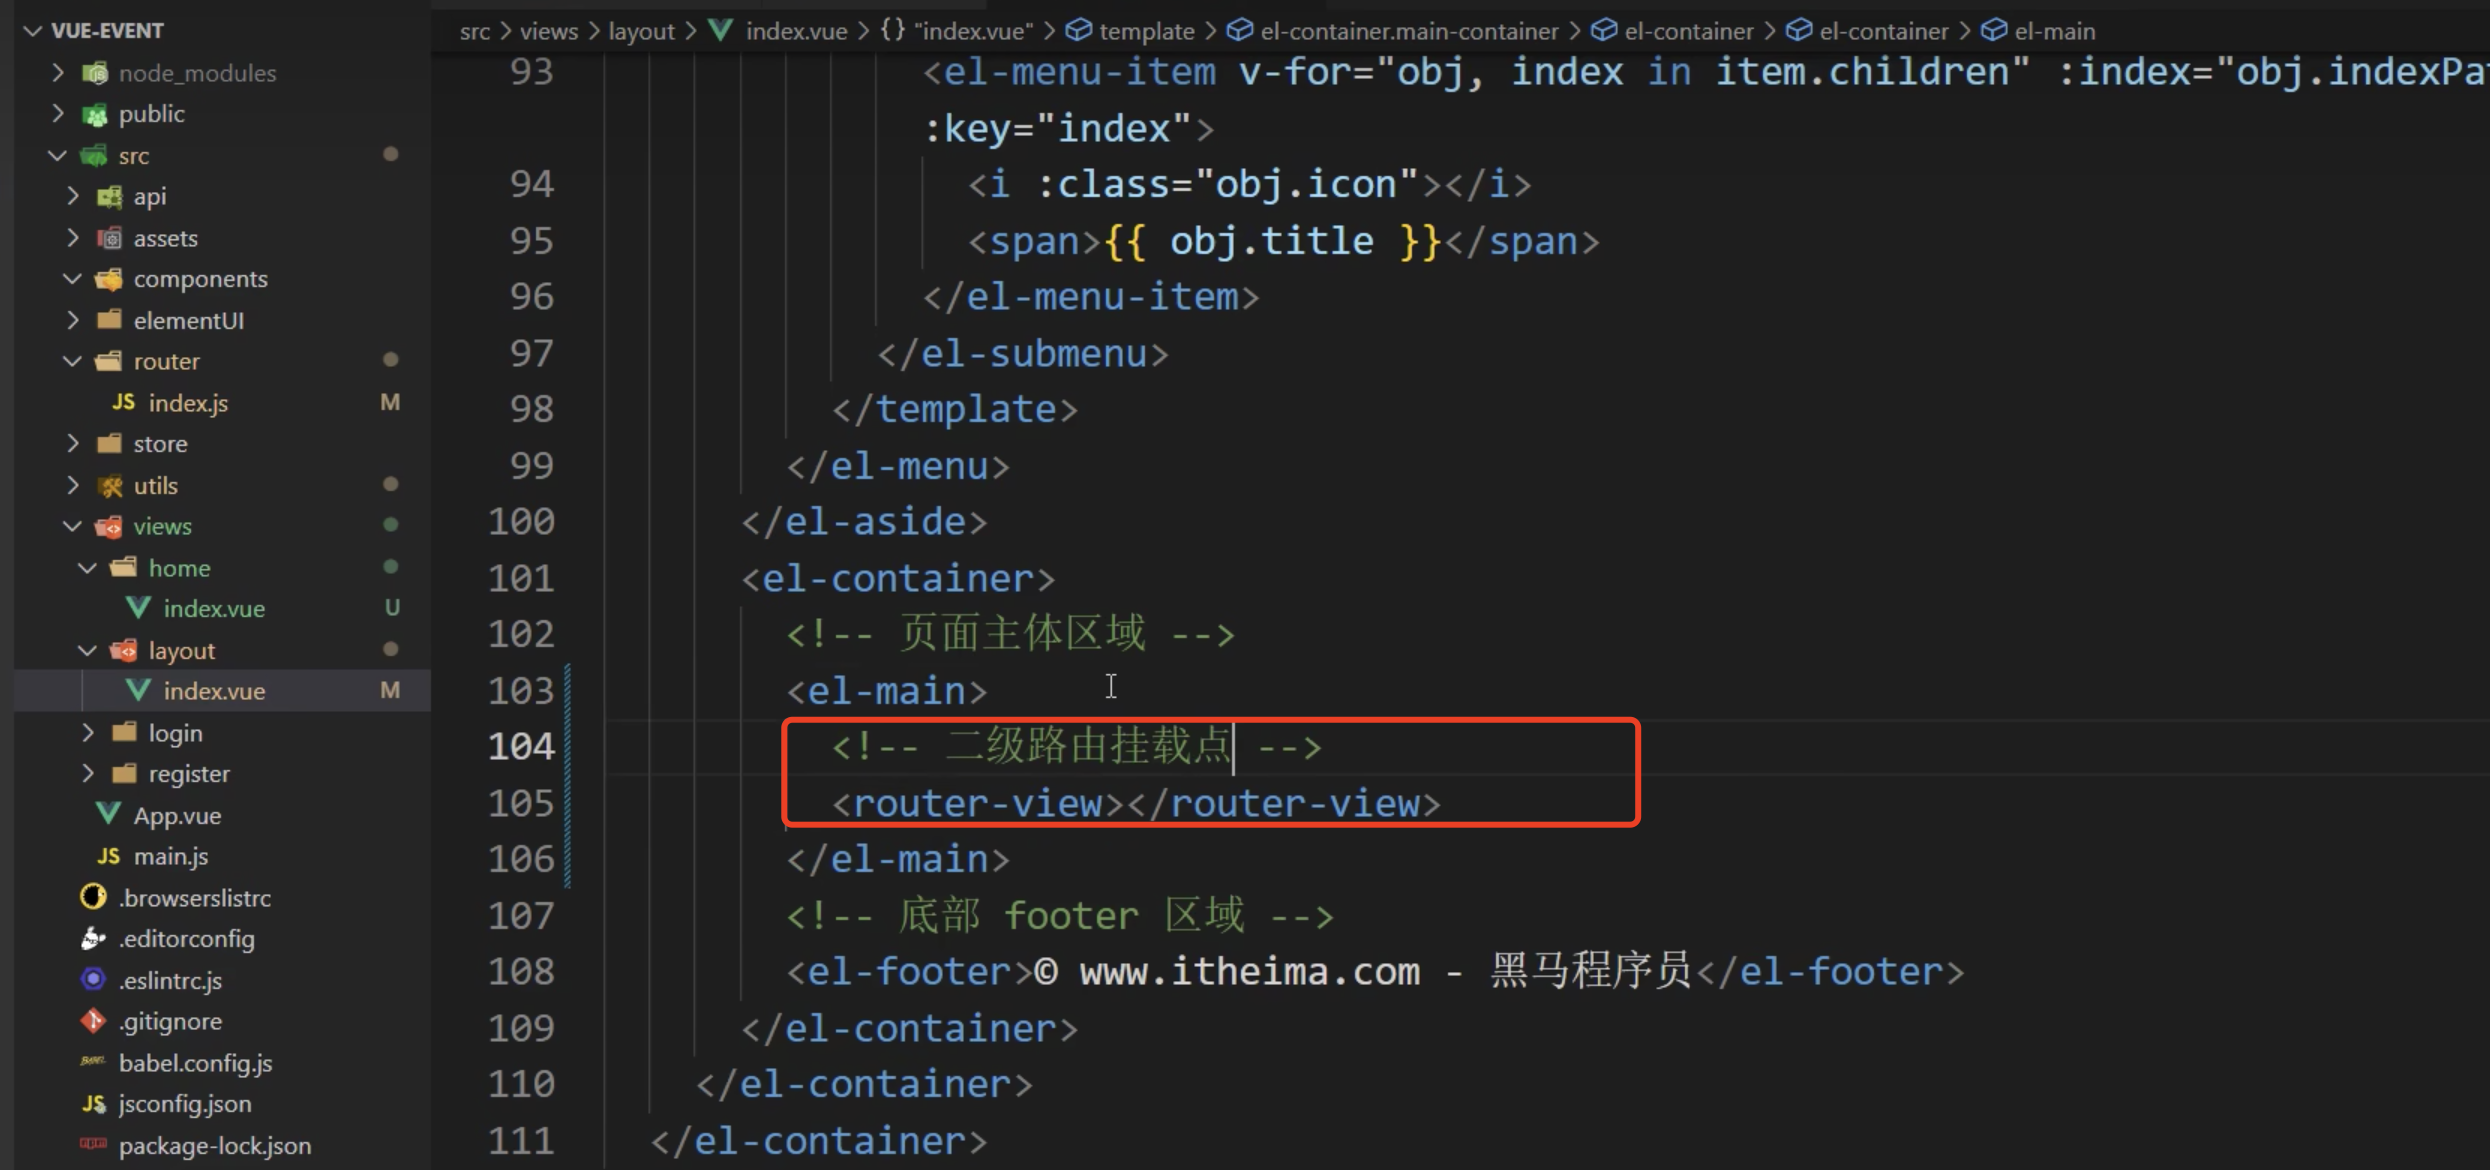
设置二级路由挂载点, 在src/views/layout/index.vue的el-main中

小结
二级路由如何设置?
答案
09首页-echarts使用
目标
在vue项目页面中, 使用echarts完成图表
讲解
找到echarts文档, 查看如何使用, 根据文档下载echarts包到当前项目中
yarn add echarts根据文档初始化echarts, 并完成面积图的使用
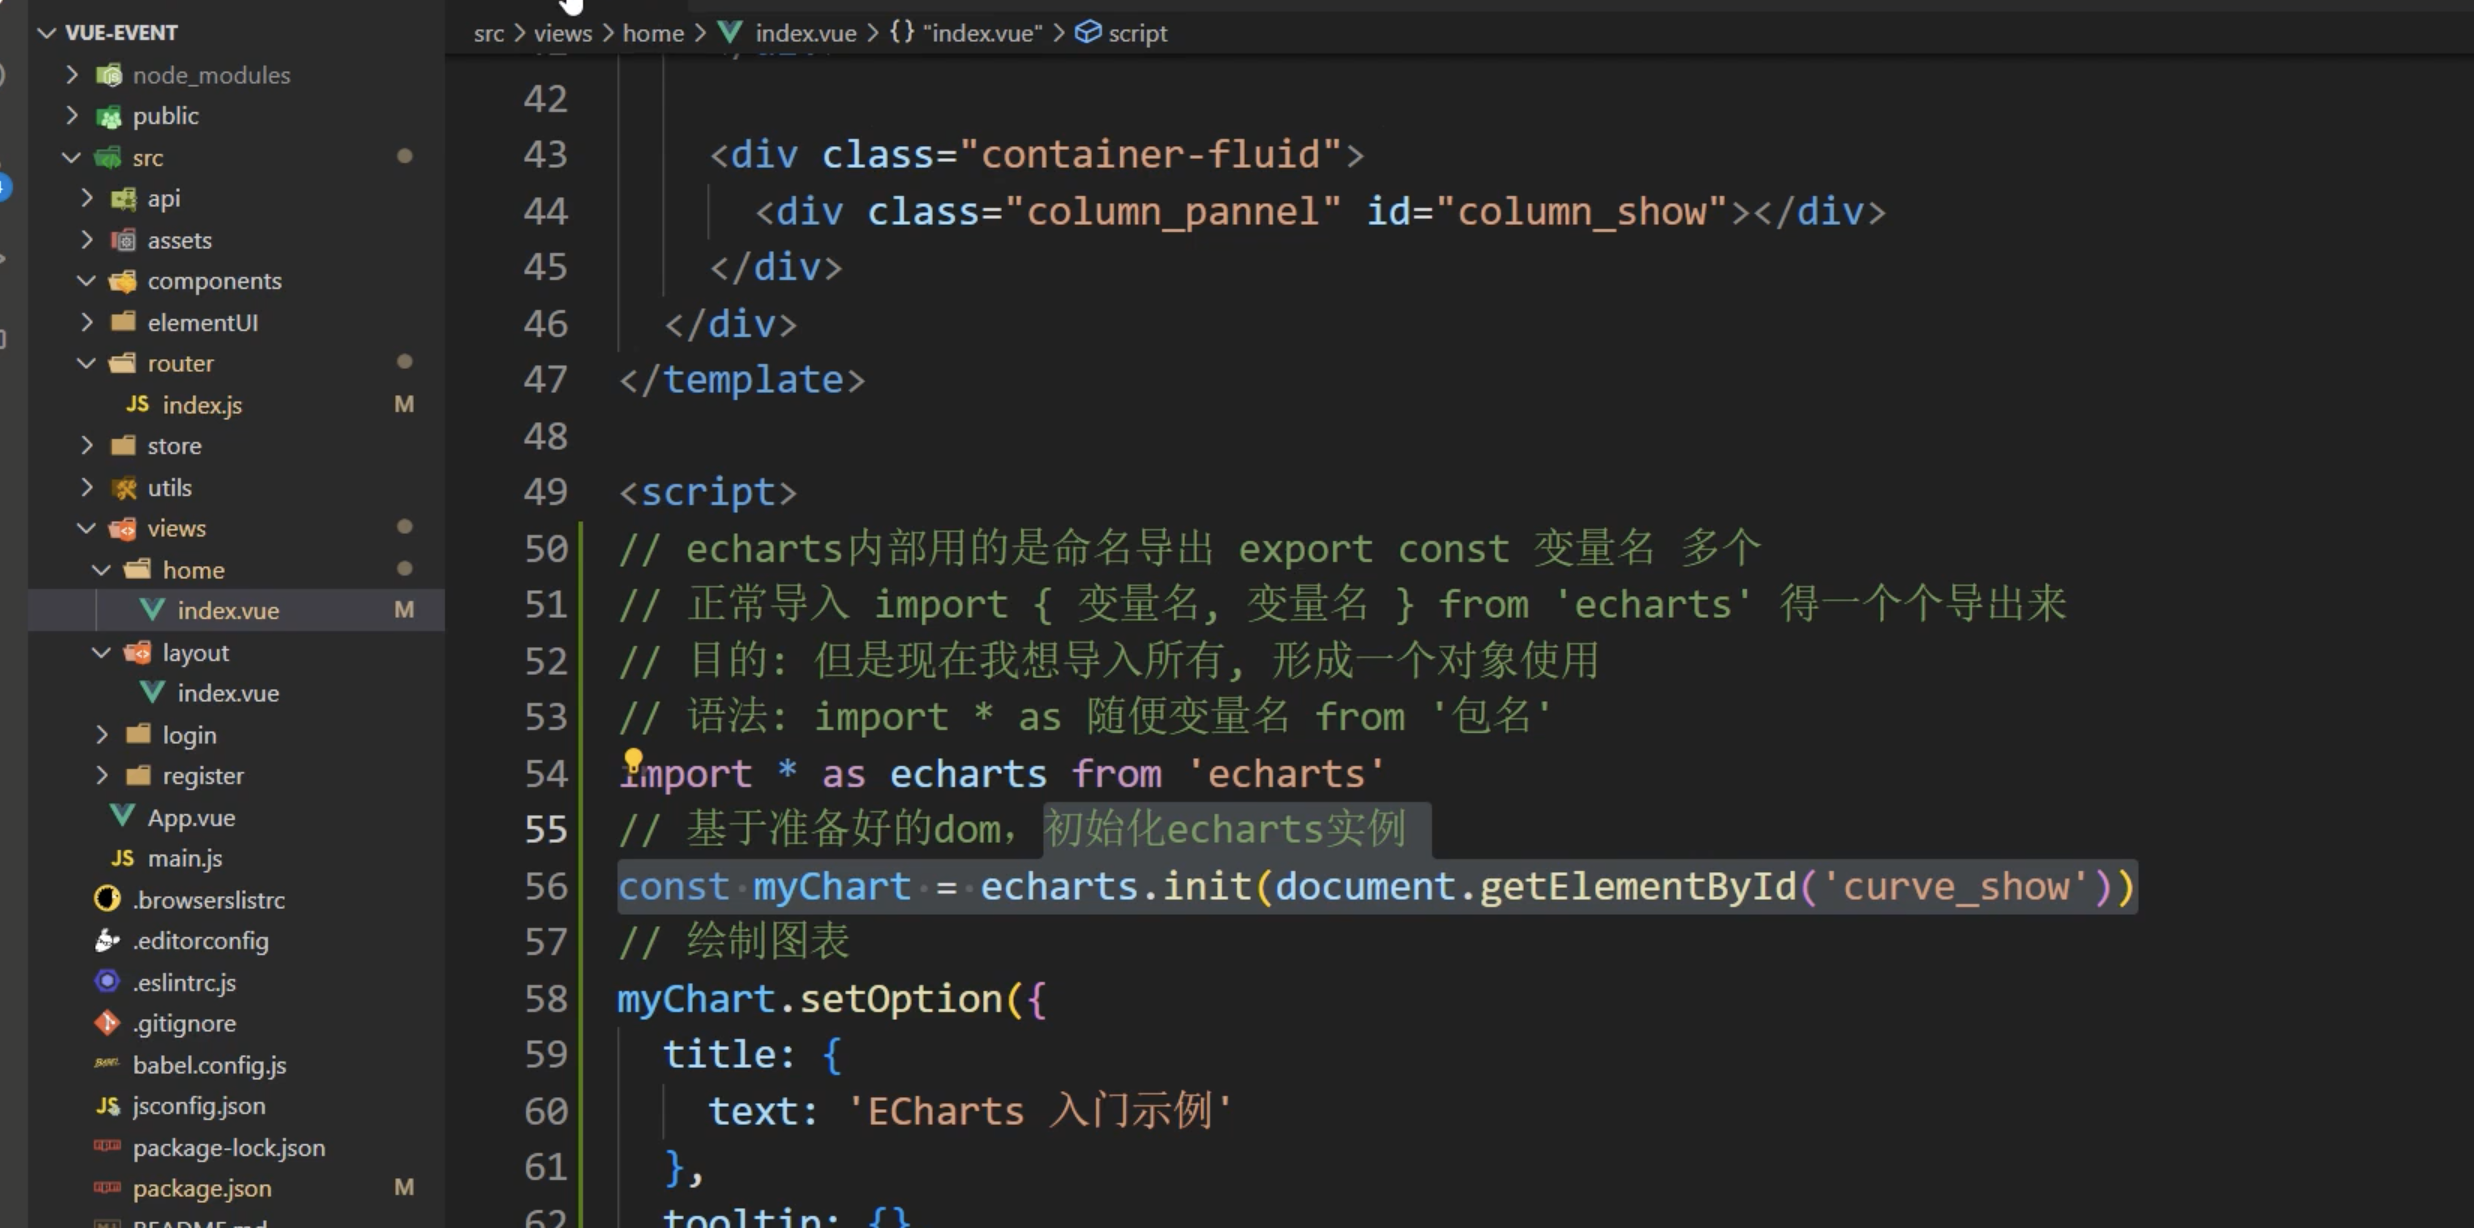
这样不起作用: 因为vue文件会被webpack预先执行,执行的时候会把js代码先执行, 执行到document ,getElementByid('curve_show '),真实的dom还没有这个id ,所以获取了个underfined . echarts 的init里边做了判断,发现不是dom标签,所以报错了。
在什么时候会确保在dom上了? 放在mounted 在挂在后进行调用
1 设置饼状图
// 模块内用命名导出的, 我把他们再收集起来形成对象, 放到echrats变量里
import * as echarts from 'echarts'
export default {
name: 'my-home',
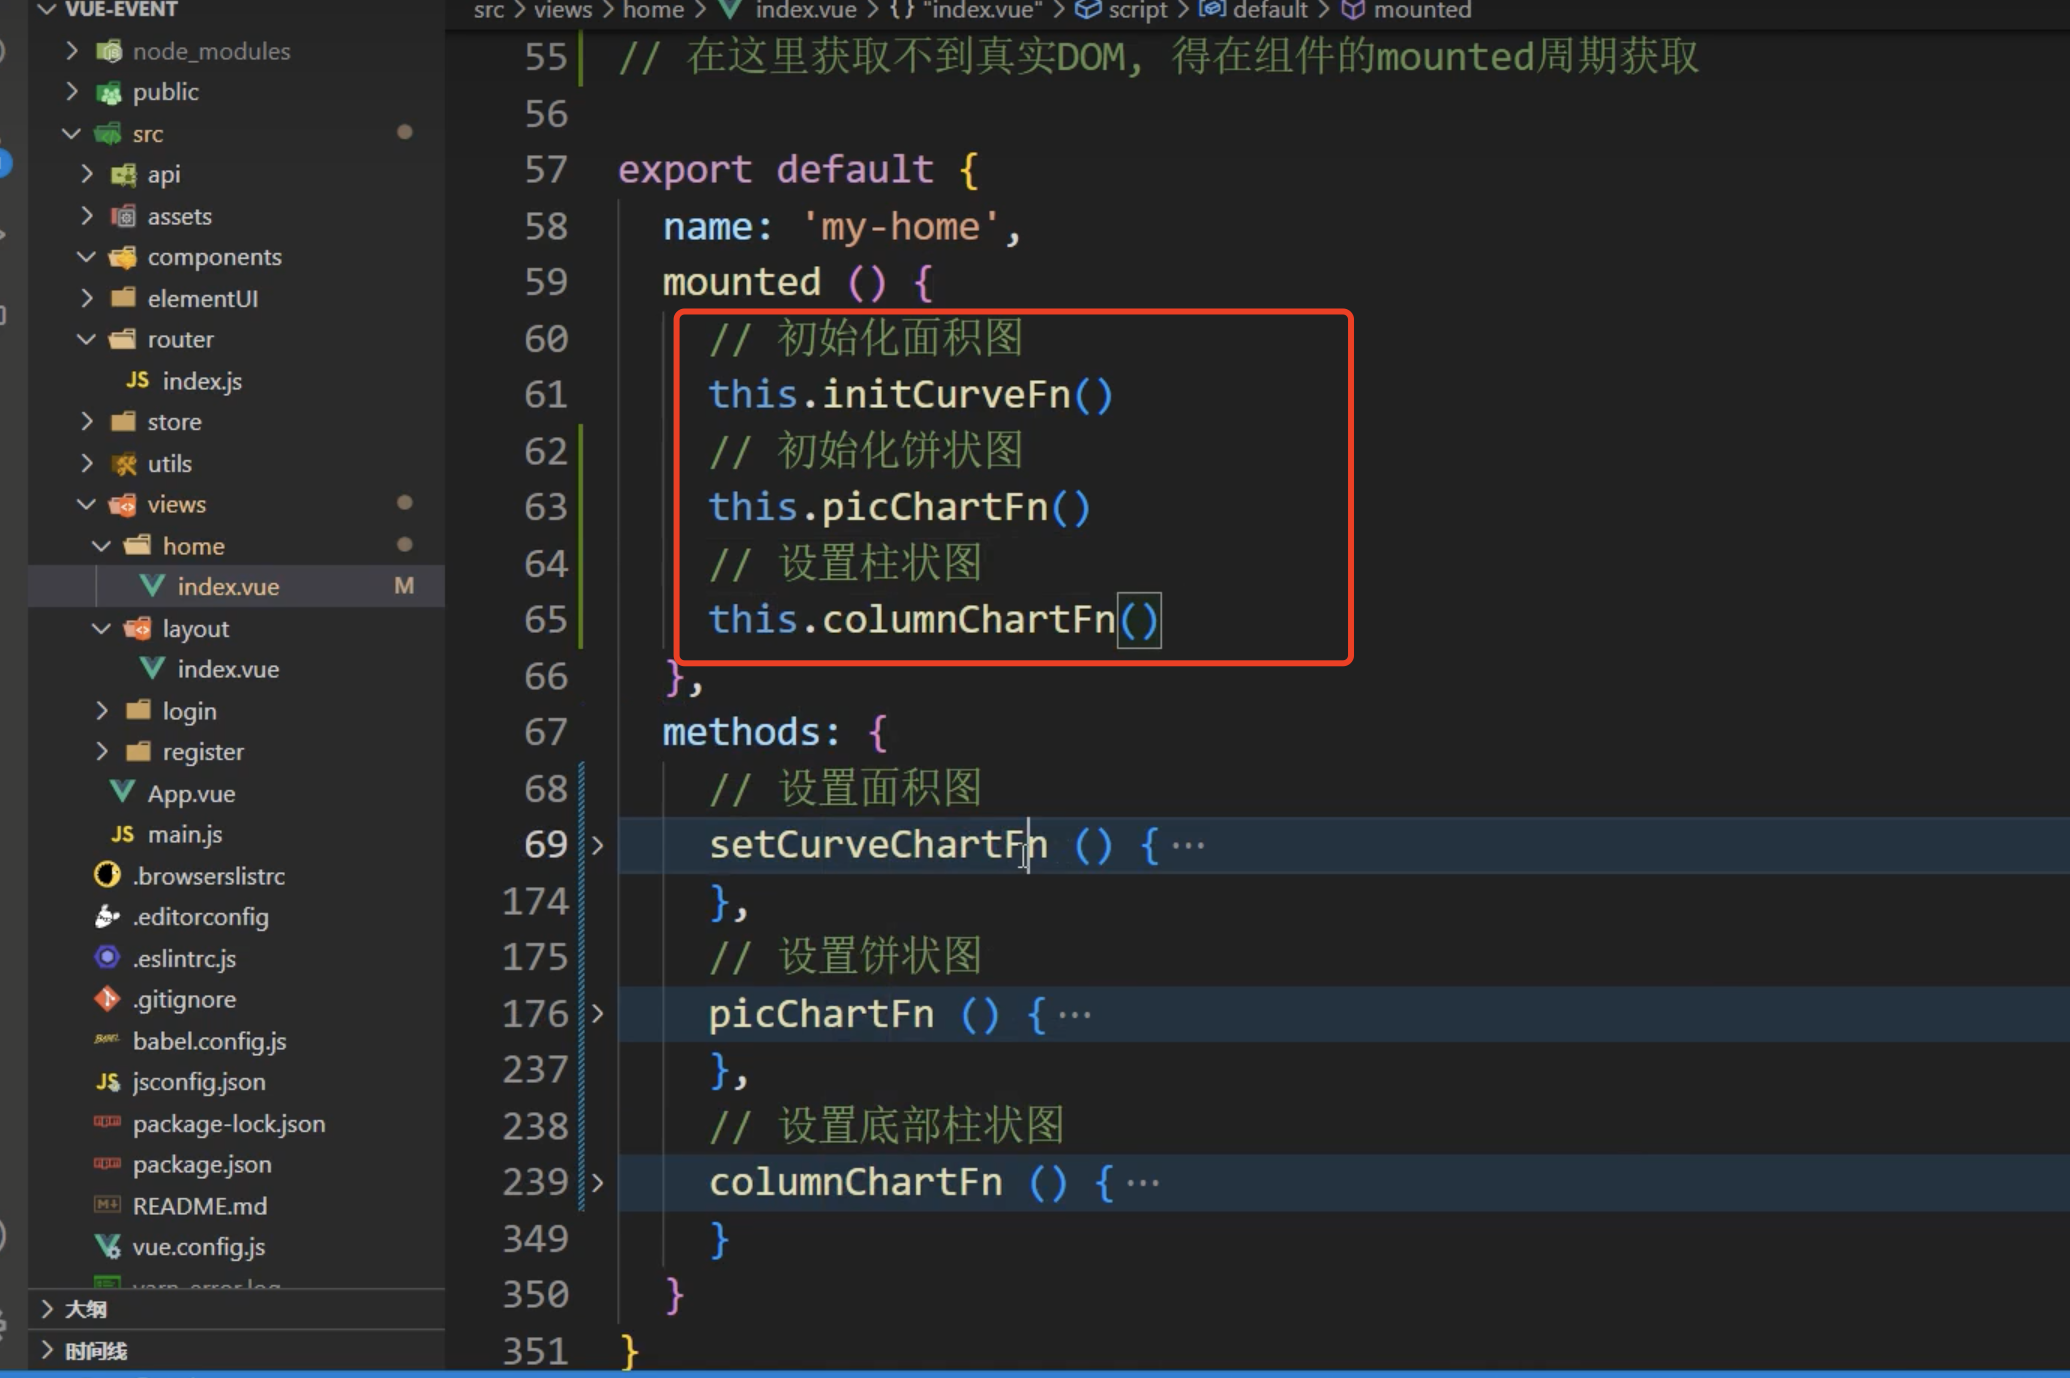
mounted () {
this.setCurveChartFn()
},
methods: {
// 设置面积图
setCurveChartFn () {
// 基于准备好的dom,初始化echarts实例
const curveChart = echarts.init(document.getElementById('curve_show'))
// 绘制面积图表
// 数据源(模拟后台返回的数据)
const aListAll = [
{ count: 36, date: '2019-04-13' },
{ count: 52, date: '2019-04-14' },
{ count: 78, date: '2019-04-15' },
{ count: 85, date: '2019-04-16' },
{ count: 65, date: '2019-04-17' },
{ count: 72, date: '2019-04-18' },
{ count: 88, date: '2019-04-19' },
{ count: 64, date: '2019-04-20' },
{ count: 72, date: '2019-04-21' },
{ count: 90, date: '2019-04-22' },
{ count: 96, date: '2019-04-23' },
{ count: 100, date: '2019-04-24' },
{ count: 102, date: '2019-04-25' },
{ count: 110, date: '2019-04-26' },
{ count: 123, date: '2019-04-27' },
{ count: 100, date: '2019-04-28' },
{ count: 132, date: '2019-04-29' },
{ count: 146, date: '2019-04-30' },
{ count: 200, date: '2019-05-01' },
{ count: 180, date: '2019-05-02' },
{ count: 163, date: '2019-05-03' },
{ count: 110, date: '2019-05-04' },
{ count: 80, date: '2019-05-05' },
{ count: 82, date: '2019-05-06' },
{ count: 70, date: '2019-05-07' },
{ count: 65, date: '2019-05-08' },
{ count: 54, date: '2019-05-09' },
{ count: 40, date: '2019-05-10' },
{ count: 45, date: '2019-05-11' },
{ count: 38, date: '2019-05-12' }
]
// 但是图标要求直接给数字的值, 所以要把对象的值取出来形成2个只有值的数组
const aCount = []
const aDate = []
for (let i = 0; i < aListAll.length; i++) {
aCount.push(aListAll[i].count)
aDate.push(aListAll[i].date)
}
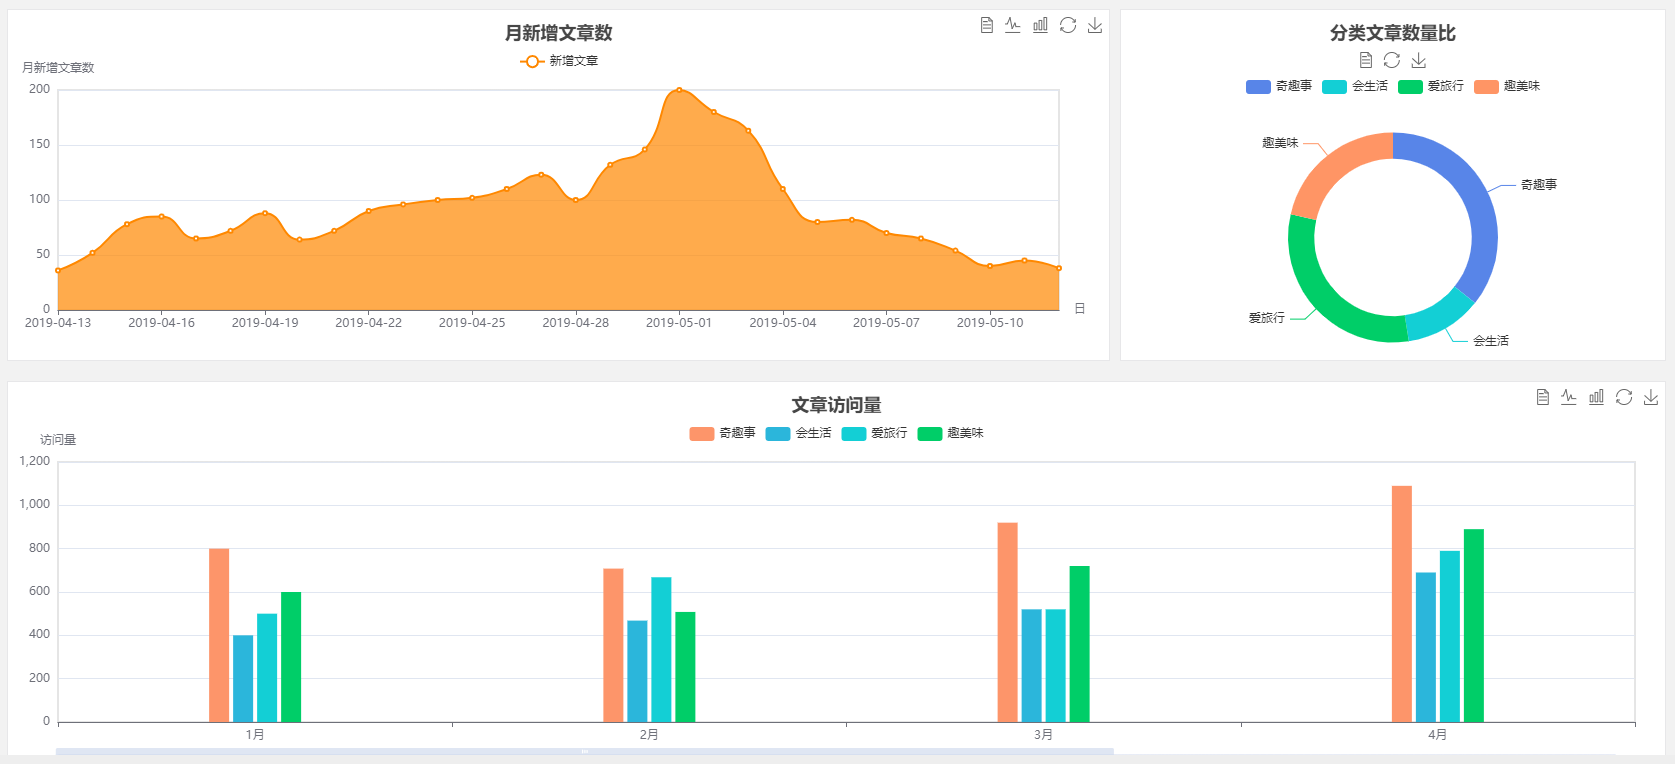
// 面积图的echarts配置项(参考文档复制)
const chartopt = {
title: {
text: '月新增文章数', // 标题
left: 'center', // 位置居中
top: '10' // 标题距离容器顶部px
},
tooltip: { // 提示框组件
trigger: 'axis' // 坐标轴触发(鼠标放在坐标轴就能出提示框)
},
legend: { // 图例组件(每种颜色的意思)
data: ['新增文章'], // 图例文字解释(要和series里name对应)
top: '40' // 距离容器顶部px
},
toolbox: { // 工具栏
show: true, // 要显示
feature: { // 各工具配置项
mark: { show: true }, // 辅助线开关
dataView: { show: true, readOnly: false }, // 数据视图工具,可以展现当前图表所用的数据,编辑后可以动态更新。
magicType: { show: true, type: ['line', 'bar'] }, // 动态类型切换
restore: { show: true }, // 配置项还原
saveAsImage: { show: true } // 点击保存下载图片
}
},
xAxis: [ // 水平轴显示
{
name: '日',
type: 'category',
boundaryGap: false, // 坐标轴两边留白策略 (不留白)
data: aDate // 水平轴上的数字数据 (时间)
}
],
yAxis: [ // 垂直轴显示
{
name: '月新增文章数',
type: 'value' // 以series里的data值做划分段
}
],
series: [ // 系列(控制图表类型和数据)
{
name: '新增文章',
type: 'line', // 折线图
smooth: true, // 是否平滑视觉引导线,默认不平滑,可以设置成 true 平滑显示
areaStyle: { type: 'default' }, // 区域填充样式。设置后显示成区域面积图。
itemStyle: { color: '#f80', lineStyle: { color: '#f80' } }, // 折线拐点标志的样式。
data: aCount // 真正数据源(用下标和x轴数组对应)
}
],
grid: { // 直角坐标系内绘图网格
show: true,
x: 50, // grid 组件离容器偏移量, 左侧
x2: 50, // 右侧
y: 80, // 上
height: 220 // 高度
}
}
curveChart.setOption(chartopt)
}
}
}设置饼状图
// 设置饼状图
    picChartFn () {
      const oPie = echarts.init(document.getElementById('pie_show'))
      const oPieopt = {
        title: {
          top: 10,
          text: '分类文章数量比',
          x: 'center'
        },
        tooltip: {
          trigger: 'item', // 在图形上才会触发提示
          formatter: '{a} <br/>{b} : {c} ({d}%)' // 提示的文字显示的格式
          // a: 系列名
          // b: 数据名
          // c: 数值
          // d: 百分比 (只有饼状图生效)
        },
        color: ['#5885e8', '#13cfd5', '#00ce68', '#ff9565'], // 系列颜色
        legend: { // 图例组件
          x: 'center',
          top: 65,
          data: ['奇趣事', '会生活', '爱旅行', '趣美味'] // 每个部分对应的数据名(要和series里name对应)
        },
        toolbox: { // 工具箱
          show: true,
          x: 'center',
          top: 35,
          feature: {
            mark: { show: true },
            dataView: { show: true, readOnly: false },
            magicType: {
              show: true,
              type: ['pie', 'funnel'],
              option: {
                funnel: {
                  x: '25%',
                  width: '50%',
                  funnelAlign: 'left',
                  max: 1548
                }
              }
            },
            restore: { show: true },
            saveAsImage: { show: true }
          }
        },
        series: [
          {
            name: '访问来源',
            type: 'pie',
            radius: ['45%', '60%'],
            center: ['50%', '65%'],
            data: [
              { value: 300, name: '奇趣事' },
              { value: 100, name: '会生活' },
              { value: 260, name: '爱旅行' },
              { value: 180, name: '趣美味' }
            ]
          }
        ]
      }
      oPie.setOption(oPieopt)
    }
设置底部柱状图
// 设置底部柱状图
    columnChartFn () {
      const oColumn = echarts.init(document.getElementById('column_show'))
      const oColumnopt = {
        title: {
          text: '文章访问量',
          left: 'center',
          top: '10'
        },
        tooltip: {
          trigger: 'axis'
        },
        legend: {
          data: ['奇趣事', '会生活', '爱旅行', '趣美味'],
          top: '40'
        },
        toolbox: {
          show: true,
          feature: {
            mark: { show: true },
            dataView: { show: true, readOnly: false },
            magicType: { show: true, type: ['line', 'bar'] },
            restore: { show: true },
            saveAsImage: { show: true }
          }
        },
        xAxis: [
          {
            type: 'category',
            data: ['1月', '2月', '3月', '4月', '5月']
          }
        ],
        yAxis: [
          {
            name: '访问量',
            type: 'value'
          }
        ],
        series: [
          {
            name: '奇趣事',
            type: 'bar',
            barWidth: 20,
            areaStyle: { type: 'default' },
            itemStyle: {
              color: '#fd956a'
            },
            data: [800, 708, 920, 1090, 1200]
          },
          {
            name: '会生活',
            type: 'bar',
            barWidth: 20,
            areaStyle: { type: 'default' },
            itemStyle: {
              color: '#2bb6db'
            },
            data: [400, 468, 520, 690, 800]
          },
          {
            name: '爱旅行',
            type: 'bar',
            barWidth: 20,
            areaStyle: { type: 'default' },
            itemStyle: {
              color: '#13cfd5'
            },
            data: [500, 668, 520, 790, 900]
          },
          {
            name: '趣美味',
            type: 'bar',
            barWidth: 20,
            areaStyle: { type: 'default' },
            itemStyle: {
              color: '#00ce68'
            },
            data: [600, 508, 720, 890, 1000]
          }
        ],
        grid: {
          show: true,
          x: 50,
          x2: 30,
          y: 80,
          height: 260
        },
        dataZoom: [ // 给x轴设置滚动条
          {
            start: 0, // 默认为0
            end: 100 - 1000 / 31, // 默认为100
            type: 'slider',
            show: true,
            xAxisIndex: [0],
            handleSize: 0, // 滑动条的 左右2个滑动条的大小
            height: 8, // 组件高度
            left: 45, // 左边的距离
            right: 50, // 右边的距离
            bottom: 26, // 右边的距离
            handleColor: '#ddd', // h滑动图标的颜色
            handleStyle: {
              borderColor: '#cacaca',
              borderWidth: '1',
              shadowBlur: 2,
              background: '#ddd',
              shadowColor: '#ddd'
            }
          }
        ]
      }
      oColumn.setOption(oColumnopt)
    }
小结
在Vue项目中如何使用图表?
答案


 6467
6467

 被折叠的 条评论
为什么被折叠?
被折叠的 条评论
为什么被折叠?
 到【灌水乐园】发言


