


前言
- 🔗 运行环境:python3
- 🚩 作者:K同学啊
- 📚 选自专栏:《Matplotlib教程》
- 🧿 优秀专栏:《Python入门100题》
- 🔥 推荐专栏:《小白入门深度学习》
- 🥇 精选专栏:《深度学习100例》
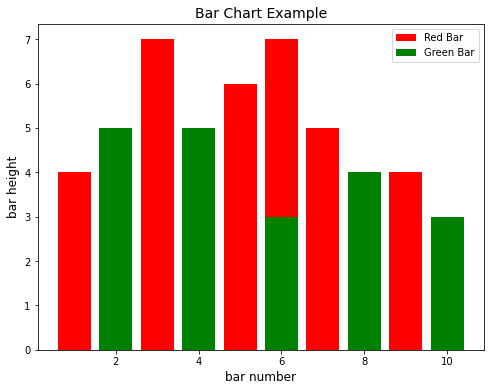
代码实现
import matplotlib.pyplot as plt

x1 = [1, 3, 4, 5, 6, 7, 9]
y1 = [4, 7, 1, 6, 7, 5, 4]

x2 = [2, 4, 6, 8, 10]
y2 = [5, 5, 3, 4, 3]

plt.figure(figsize=(8,6))
plt.bar(x1, y1, label="Red Bar", color='r')
plt.bar(x2, y2, label="Green Bar", color='g')

plt.xlabel("bar number", fontsize=12)
plt.ylabel("bar height", fontsize=12)

plt.title("Bar Chart Example",fontsize=14)
plt.legend()
plt.show()


 940
940

 被折叠的 条评论
为什么被折叠?
被折叠的 条评论
为什么被折叠?
 到【灌水乐园】发言


