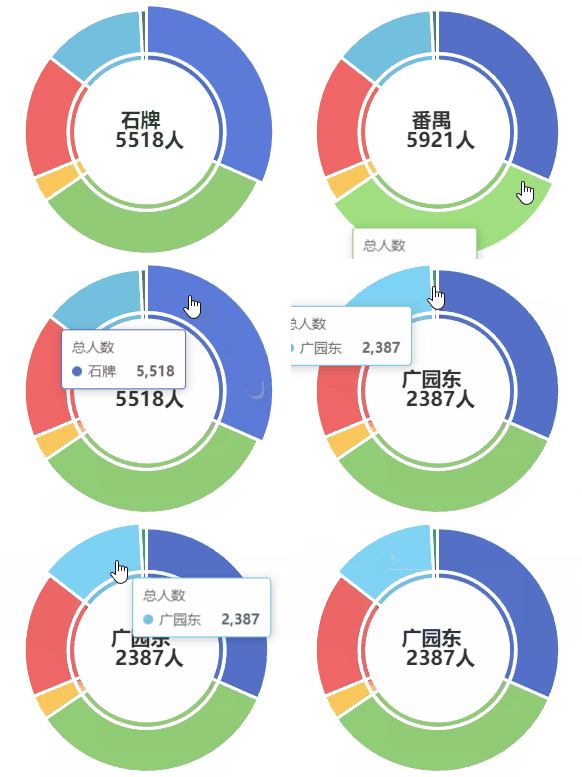
最近突然遇到一个需求,Echarts的双层环图在鼠标移出数据项后,需要继续保持数据项聚焦。这里简单记录一下最后Vue的组件实现过程。
一、效果图

二、双层环图的实现
双层环图怎么实现就简单略过了。实际就是两个同颜色同数据项的环图在同一个圆心位置,叠在一起。
//这是实现双层环图的series,用的vue,因为需求问题,很多配置项都改成了变量,从父组件传入
series: [
          {
            name: this.chartName,
            type: 'pie',
            center: this.center,
            radius: this.outerRadius,
            avoidLabelOverlap: false,
            minAngle: 3,
            itemStyle: {
              borderColor: '#fff',
              borderWidth: 3
            },
            label: {
              show: false,
              position: 'center',
              formatter: "{b} \r\n {c}人"
            },
            emphasis: {
              label: {
                show: true,
                fontSize: 20,
                fontWeight: 'bold',
              }
            },
            labelLine: {
              show: false
            },
            data: this.chartData
          },
          // // 内圈
          {
            type: 'pie',
            center: this.center,
            radius: this.innerRadius,
            silent: true, //取消高亮
            minAngle: 3,
            label: {show: false, position: 'center'},
            itemStyle: {
              borderColor: '#fff',
              borderWidth: 3
            },
            data: this.chartData,
          }
        ]
三、鼠标悬停
主要使用Echarts的API通过绑定mouseover以及mouseout事件,同时配合dispatchAction进行实现。附Echarts的文档简要说明。
| API | 参数 | 说明 |
| echartsInstance.dispatchAction | (payload: Object) | 触发图表行为,例如图例开关
注:在 ECharts 2.x 是通过 |
| echartsInstance.on | ( eventName: string, handler: Function, context?: Object ) ( eventName: string, query: string|Object, handler: Function, context?: Object ) | 绑定事件处理函数。 ECharts 中的事件有两种,一种是鼠标事件,在鼠标点击某个图形上会触发,还有一种是 调用 dispatchAction 后触发的事件。每个 action 都会有对应的事件,具体见 action 和 events 的文档。 如果事件是外部 dispatchAction 后触发,并且 action 中有 batch 属性触发批量的行为,则相应的响应事件参数里也会把属性都放在 batch 属性中。 |
//当检测到鼠标悬停事件,取消默认选中高亮
this.chart.on("mouseover", (e) => {
        if (e.seriesIndex === seriesIndex && e.dataIndex === dataIndex) {
          return;
        }
        this.chart.dispatchAction({
          type: "downplay",
          seriesIndex: seriesIndex,
          dataIndex: dataIndex,
        });
      });
//检测鼠标移出后显示之前默认高亮的那块
this.chart.on("mouseout", (e) => {
        dataIndex = e.dataIndex;
        seriesIndex = e.seriesIndex;
        this.chart.dispatchAction({
          type: "highlight",
          seriesIndex: e.seriesIndex,
          dataIndex: e.dataIndex,
        });
      });
四、完整组件代码
最后是这个组件完整代码
<template>
  <div :class="className" :style="{height:height,width:width}"/>
</template>

<script>
import * as echarts from 'echarts';

import resize from '../mixins/resize'

export default {
  mixins: [resize],
  props: {
    className: {
      type: String,
      default: 'chart'
    },
    //容器宽度
    width: {
      type: String,
      default: '100%'
    },
    //容器高度
    height: {
      type: String,
      default: '100%'
    },
    //图表名称
    chartName: {
      type: String,
      required: true
    },
    //图表数据
    chartData: {
      type: Array,
      required: true
    },
    //圆心位置
    center: {
      type: Array,
      default: () => ['50%', '50%']
    },
    //内环半径
    innerRadius: {
      type: Array,
      default: () => ['50.5%', '55.5%']
    },
    //外环半径
    outerRadius: {
      type: Array,
      default: () => ['56%', '87%']
    },
    //颜色
    color: {
      type: Array,
      default: () => ['#5470c6', '#91cc75', '#fac858', '#ee6666',
                      '#73c0de', '#3ba272', '#fc8452', '#9a60b4',
                      '#ea7ccc']
    },
    forceIndex: {
      type: Number,
      default: 0
    }
  },
  data() {
    return {
      chart: null,
      options: {
        tooltip: {
          trigger: 'item'
        },
        color: this.color,
        series: [
          {
            name: this.chartName,
            type: 'pie',
            center: this.center,
            radius: this.outerRadius,
            avoidLabelOverlap: false,
            minAngle: 3,
            itemStyle: {
              borderColor: '#fff',
              borderWidth: 3
            },
            label: {
              show: false,
              position: 'center',
              formatter: "{b} \r\n {c}人"
            },
            emphasis: {
              label: {
                show: true,
                fontSize: 20,
                fontWeight: 'bold',
              }
            },
            labelLine: {
              show: false
            },
            data: this.chartData
          },
          // // 内圈
          {
            type: 'pie',
            center: this.center,
            radius: this.innerRadius,
            silent: true, //取消高亮
            minAngle: 3,
            label: {show: false, position: 'center'},
            itemStyle: {
              borderColor: '#fff',
              borderWidth: 3
            },
            data: this.chartData,
          }
        ]
      }
    }
  },
  mounted() {
    this.$nextTick(() => {
      this.initChart()
    })
  },
  beforeDestroy() {
    if (!this.chart) {
      return
    }
    this.chart.dispose()
    this.chart = null
  },
  watch: {
    chartData: function (newVal, oldVal) {
      this.chart.clear();
      this.options.series[0].data = this.chartData;
      this.options.series[1].data = this.chartData;
      this.chart.setOption(this.options, true);
      this.chart.dispatchAction({
        type: "highlight",
        seriesIndex: 0,
        dataIndex: 0
      })
    }
  },
  methods: {
    initChart() {
      this.chart = echarts.init(this.$el)
      this.chart.setOption(this.options)
      let dataIndex = 0;
      let seriesIndex = 0;
      //默认高亮数据项
      this.chart.dispatchAction({
        type: "highlight",
        seriesIndex: 0,
        dataIndex: this.forceIndex - 1 < 0 ? 0 : this.forceIndex - 1
      })
      //当检测到鼠标悬停事件,取消之前高亮
      this.chart.on("mouseover", (e) => {
        if (e.seriesIndex === seriesIndex && e.dataIndex === dataIndex) {
          return;
        }
        this.chart.dispatchAction({
          type: "downplay",
          seriesIndex: seriesIndex,
          dataIndex: dataIndex,
        });
      });
      //检测鼠标移出后显示之前默认高亮的那块
      this.chart.on("mouseout", (e) => {
        dataIndex = e.dataIndex;
        seriesIndex = e.seriesIndex;
        this.chart.dispatchAction({
          type: "highlight",
          seriesIndex: e.seriesIndex,
          dataIndex: e.dataIndex,
        });
      });
    }
  }
}
</script>


 1116
1116

 被折叠的 条评论
为什么被折叠?


