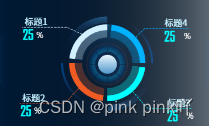
vue3+echarts实现带有间隔的双重环图

1.在template中定义

<div ref="chartRef" class="w-full h-[200px]"></div>

2.在js中完成对数据的处理


  const datalist = [
    {id: 1, name: '标题1', value: 25},
    {id: 2, name: '标题2', value: 25},
    {id: 3, name: '标题3', value: 25},
    {id: 4, name: '标题4', value: 25}
  ]
  let colorList = [
    "#D3F0FF",
    "#F05A23",
    "#00FFFF",
    "#00B2FF",
  ];
  const convertToRGBA = (color, opacity) => {
    const hex = color.replace('#', '');
    const r = parseInt(hex.substring(0, 2), 16);
    const g = parseInt(hex.substring(2, 4), 16);
    const b = parseInt(hex.substring(4, 6), 16);
    return `rgba(${r}, ${g}, ${b}, ${opacity})`;
};

  const colors = colorList.map(color => convertToRGBA(color, 0.3));
  let data = [];
  let data2 = []
  for (let i = 0; i < datalist.length; i++) {
    data.push(
      {
        value: datalist[i].value,
        name: datalist[i].name,
        itemStyle: {
          // shadowBlur: 20,
          color: colorList[i],
          // shadowColor: colorList[i],
        },
      },
      {
        value: 2,
        name: "",
        itemStyle: {
          label: {
            show: false,
          },
          labelLine: {
            show: false,
          },
          color: "rgba(0, 0, 0, 0)",
          borderColor: "rgba(0, 0, 0, 0)",
          borderWidth: 0,
        },
      }
    );
    data2.push(
      {
        value: datalist[i].value,
        name: datalist[i].name,
        itemStyle: {
          // shadowBlur: 20,
          color: colors[i],
          // shadowColor: colorList[i],
        },
      },
      {
        value: 2,
        name: "",
        itemStyle: {
          label: {
            show: false,
          },
          labelLine: {
            show: false,
          },
          color: "rgba(0, 0, 0, 0)",
          borderColor: "rgba(0, 0, 0, 0)",
          borderWidth: 0,
        },
      }
    );
    
  }

3.对圆环图进行配置

 const chartRef = ref()
  const pieChart = ref()

  function initCharts() {
    if (!pieChart.value)
        pieChart.value = markRaw(echarts.init(chartRef.value));
    else pieChart.value.clear();
    pieChart.value.setOption({
      tooltip: {
        show: true,
      },
      series: [
        {
          //外环大小
          type: 'pie',
          radius: ['58%', '68%'],
          center: ["51.5%", "41%"],
          z: 10,
          clockWise:false,
          label: {//对牵引线的内容进行自定义
            show: true,
            position: 'outer',
            align: 'left',
            clockWise:false,
            height:30,
            lineHeight: 10,
            formatter: function (params) {
              if (params.name !== "") {
                let data = datalist;
                let total = 0;
                let tarValue;
                for (let i = 0; i < data.length; i++) {
                  total += data[i].value;
                  if (data[i].name == params.name) {
                    tarValue = data[i].value;
                  }
                }
                let v = tarValue;
                let per = getPercent(v, total, 1);
                return [
                  `{a|${params.name}}\n\n` + `{c|${per}}` + `{d|%}  `,
                ];
              } else {
                return "";
              }
            },
            rich: {
              a: {
                fontSize: 16,
                color: '#c5f1ff',
                fontWeight: 400,
                fontFamily: 'Regular'
              },
              c: {
                color: '#00ffff', 
                fontSize: 24,
                fontWeight: 600,
                fontFamily: 'AGENCYR',
                padding: [10, 0, 0 , 0]
              },
              d: {
                color: '#fff', 
                fontSize: 14,
                fontWeight: 400,
                padding: [10, 0 ,0 ,5]
              }
              },
            borderWidth:10,
            padding: [0, -50],
          },
        labelLine: {
          show: true,
          length: 40,
          length2: 80,
          smooth: 0,
          lineStyle: {
            type: 'dashed'
          }
        },
          emphasis: {
            label: {
              show: true,
              fontSize: "14",
            },
          },
          data: data,
        },
        {
           //不透明的圆环的设置
          name:'',
          radius: ['45%','68%'],
          center: ["51.5%", "41%"],
          type:'pie',
          gap: 1.71,
          clockWise:false,
          itemStyle: {
            normal: {
              color: function (params) {
                return colorList[params.dataIndex % colorList.length] + "40";
              },
            }
          },
          label: {
            normal: {
              show:false
            },
            emphasis: {
              show:false
            }
          },
          labelLine: {
            normal: {
              show:false
            },
            emphasis: {
              label: {
                show: true,
                fontSize: "14",
              },
            },
          },
          animation:true,
          tooltip: {
            show:true
          },
          silent: true,
          data: data2
        }
      ],
    });
  }
  onMounted(() => {
    initCharts()
  })

最后就能实现双重的圆环图效果

  • 12
    点赞
  • 0
    收藏
    觉得还不错? 一键收藏
  • 0
    评论
以下是使用 Vue3 和 Echarts 实现的示例代码: 1. 安装 Echarts:`npm install echarts` 2. 引入 Echarts: ```javascript import echarts from "echarts"; import "echarts/lib/chart/pie"; import "echarts/lib/component/title"; import "echarts/lib/component/tooltip"; import "echarts/lib/component/legend"; ``` 3. 在 Vue3 组件中使用 Echarts: ```vue <template> <div ref="chart" style="height: 400px;"></div> </template> <script> import echarts from "echarts"; import "echarts/lib/chart/pie"; import "echarts/lib/component/title"; import "echarts/lib/component/tooltip"; import "echarts/lib/component/legend"; export default { mounted() { // 基于准备好的dom,初始化echarts实例 var myChart = echarts.init(this.$refs.chart); // 指定表的配置项和数据 var option = { title: { text: "饼示例", left: "center", }, tooltip: { trigger: "item", formatter: "{a} <br/>{b}: {c} ({d}%)", }, legend: { orient: "vertical", left: "left", data: ["直接访问", "邮件营销", "联盟广告", "视频广告", "搜索引擎"], }, series: [ { name: "访问来源", type: "pie", radius: ["50%", "70%"], avoidLabelOverlap: false, label: { show: false, position: "center", }, emphasis: { label: { show: true, fontSize: "30", fontWeight: "bold", }, }, labelLine: { show: false, }, data: [ { value: 335, name: "直接访问" }, { value: 310, name: "邮件营销" }, { value: 234, name: "联盟广告" }, { value: 135, name: "视频广告" }, { value: 1548, name: "搜索引擎" }, ], }, ], }; // 使用刚指定的配置项和数据显示表。 myChart.setOption(option); }, }; </script> ``` 在上面的示例代码中,我们在 `mounted` 钩子函数中初始化了一个 Echarts 实例,并使用 `setOption` 方法将表的配置项和数据传递给 Echarts 实例,从而显示出饼。 其中,`ref` 属性指定了表所在的 DOM 元素,`title` 属性设置了表标题,`legend` 属性设置了例,`series` 属性设置了饼的数据和样式。 如果需要修改饼的样式或数据,只需要更改 `option` 对象的属性即可。

“相关推荐”对你有帮助么?

  • 非常没帮助
  • 没帮助
  • 一般
  • 有帮助
  • 非常有帮助
提交
评论
添加红包

请填写红包祝福语或标题

红包个数最小为10个

红包金额最低5元

当前余额3.43前往充值 >
需支付:10.00
成就一亿技术人!
领取后你会自动成为博主和红包主的粉丝 规则
hope_wisdom
发出的红包
实付
使用余额支付
点击重新获取
扫码支付
钱包余额 0

抵扣说明:

1.余额是钱包充值的虚拟货币,按照1:1的比例进行支付金额的抵扣。
2.余额无法直接购买下载,可以购买VIP、付费专栏及课程。

余额充值