


效果
在超过图表的最大值后,X轴会自动向右边移动
LiveCharts是一个比较漂亮的WPF图表控件,在数据发生变化后,还可以设置相对于的动画效果,但也有自己的缺点,比如数据量过大,可能会非常的卡,有一次,我在写柱状图时,将几个柱子的值设置成15000,结果整整卡了几十秒,在使用时还是需要注意的。
官方网站:点击跳转
开源代码:点击跳转
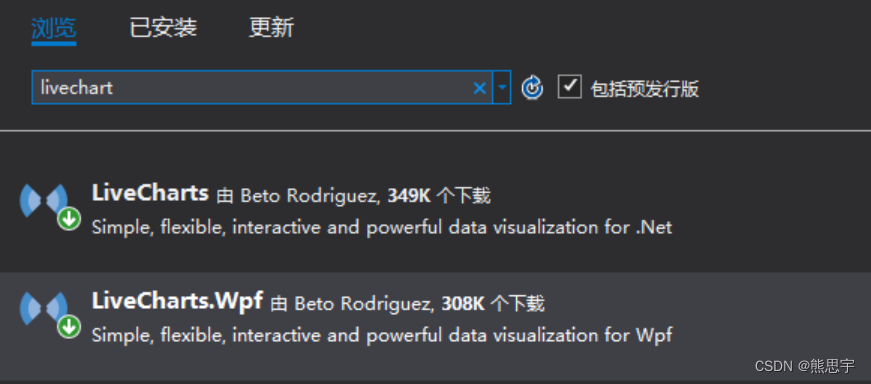
安装 LiveChart:
在NuGet中直接搜索 LiveChart,选择 LiveCharts.Wpf
在使用的界面当中引用LiveChart.Wpf的类库
xmlns:lvc="clr-namespace:LiveCharts.Wpf;assembly=LiveCharts.Wpf"如果之前就没有使用过LiveChart,可以用下面的小案例看看效果。
以直方图、折线图为例, 都属于 CartesianChart 下的一种 Series 类型, 例如折线图,如下:
<lvc:CartesianChart>
<lvc:CartesianChart.Series>
      <!--设置Series的类型为 Line 类型, 该类型提供了一些折线图的实现-->
    <lvc:LineSeries/>
</lvc:CartesianChart.Series>
</lvc:CartesianChart>
LinSeries 绑定数据设定Values即可, 可以看到Values单词带s,则代表这是一种复数集合类型,继承于 IChartValues,所以最终绑定的数据符合 ChartValues 即可,下图绑定了为数字类型的集合:
<lvc:CartesianChart>
 <lvc:CartesianChart.Series>
     <!--设置Series的类型为 Line 类型, 该类型提供了一些折线图的实现-->
     <lvc:LineSeries Values="1,2,3,4,5,6"/>
     <lvc:LineSeries Values="2,4,6,8,10,12"/>
 </lvc:CartesianChart.Series>
</lvc:CartesianChart>
这里是 LiveChart 一些简单的使用方法,下面是用绑定数据的方式进行显示,在工作中,尽量使用数据绑定的方式,更适合项目的维护。
前端
<Window x:Class="WpfApplication7.MainWindow"
        xmlns="http://schemas.microsoft.com/winfx/2006/xaml/presentation"
        xmlns:x="http://schemas.microsoft.com/winfx/2006/xaml"
        xmlns:lvc="clr-namespace:LiveCharts.Wpf;assembly=LiveCharts.Wpf"
        Title="MainWindow" Width="700" Height="400" Loaded="Window_Loaded" >
    <Grid>
        <Grid.RowDefinitions>
            <RowDefinition Height="50"/>
            <RowDefinition Height="*"/>
        </Grid.RowDefinitions>

        <Grid Grid.Row="0" Background="AntiqueWhite">
            <Button Content="测试"  Margin="0,10,0,0" HorizontalAlignment="Left" VerticalAlignment="Top" Width="75" Click="Button_Click"/>
        </Grid>
        <Grid Grid.Row="1">
            <lvc:CartesianChart Series="{Binding LineSeriesCollection}" LegendLocation="Right">
                <lvc:CartesianChart.AxisX>
                    <lvc:Axis LabelFormatter="{Binding CustomFormatterX}"  MaxValue="{Binding AxisXMax}" MinValue="{Binding AxisXMin}">
                        <lvc:Axis.Separator>
                            <lvc:Separator Step="1" />
                        </lvc:Axis.Separator>
                    </lvc:Axis>
                </lvc:CartesianChart.AxisX>

                <lvc:CartesianChart.AxisY>
                    <lvc:Axis LabelFormatter="{Binding CustomFormatterY}" MaxValue="{Binding AxisYMax}" MinValue="{Binding AxisYMin}">
                    </lvc:Axis>
                </lvc:CartesianChart.AxisY>

            </lvc:CartesianChart>
        </Grid>
    </Grid>
</Window>
后端
先定义一个数据更新的类 ViewModelBase
using System;
using System.Collections.Generic;
using System.Linq;
using System.Text;
using System.Threading.Tasks;

namespace WpfApplication7
{
    /// <summary>
    /// 实现了属性更改通知的基类
    /// </summary>
    public class ViewModelBase : System.ComponentModel.INotifyPropertyChanged
    {
        public virtual event System.ComponentModel.PropertyChangedEventHandler PropertyChanged;

        /// <summary>
        /// 属性值变化时发生
        /// </summary>
        /// <param name="propertyName"></param>
        protected virtual void OnPropertyChanged(string propertyName)
        {
            if (this.PropertyChanged != null)
                this.PropertyChanged(this, new System.ComponentModel.PropertyChangedEventArgs(propertyName));
        }

        /// <summary>
        /// 属性值变化时发生
        /// </summary>
        /// <param name="propertyName"></param>
        protected virtual void OnPropertyChanged<T>(System.Linq.Expressions.Expression<Func<T>> propertyExpression)
        {
            var propertyName = (propertyExpression.Body as System.Linq.Expressions.MemberExpression).Member.Name;
            this.OnPropertyChanged(propertyName);
        }
    }
}关于数据刷新可以参考我之前的帖子:点击跳转
后端代码
using LiveCharts;
using LiveCharts.Wpf;
using System;
using System.Collections.Generic;
using System.Linq;
using System.Text;
using System.Threading.Tasks;
using System.Windows;
using System.Windows.Controls;
using System.Windows.Data;
using System.Windows.Documents;
using System.Windows.Input;
using System.Windows.Media;
using System.Windows.Media.Imaging;
using System.Windows.Navigation;
using System.Windows.Shapes;

namespace WpfApplication7
{
    /// <summary>
    /// MainWindow.xaml 的交互逻辑
    /// </summary>
    public partial class MainWindow : Window
    {
        private Mode Modes = new Mode();

        public MainWindow()
        {
            InitializeComponent();
        }

        private void Window_Loaded(object sender, RoutedEventArgs e)
        {
            this.DataContext = Modes;
        }

        private void Button_Click(object sender, RoutedEventArgs e)
        {
            Modes.OnClick();
        }
    }


    public class Mode : ViewModelBase
    {
        public SeriesCollection LineSeriesCollection { get; set; }

        private double axisXMax;
        public double AxisXMax
        {
            get { return axisXMax; }
            set { axisXMax = value; this.OnPropertyChanged("AxisXMax"); }
        }

        private double axisXMin;
        public double AxisXMin
        {
            get { return axisXMin; }
            set { axisXMin = value; this.OnPropertyChanged("AxisXMin"); }
        }

        private double axisYMax;
        public double AxisYMax
        {
            get { return axisYMax; }
            set { axisYMax = value; this.OnPropertyChanged("AxisYMax"); }
        }
        private double axisYMin;
        public double AxisYMin
        {
            get { return axisYMin; }
            set { axisYMin = value; this.OnPropertyChanged("AxisYMin"); }
        }

        private Random Randoms = new Random();

        public Func<double, string> CustomFormatterX { get; set; }
        public Func<double, string> CustomFormatterY { get; set; }


        //绑定的X轴数据
        private ChartValues<double> ValueList { get; set; }

        //表中最大容纳个数
        private int TabelShowCount = 10;


        private string CustomFormattersX(double val)
        {
            return string.Format("{0}天", val);
        }

        private string CustomFormattersY(double val)
        {
            return string.Format("{0}公斤", val);
        }


        public void OnClick()
        {
            int yValue = Randoms.Next(2, 1000);

            //向图表中添加数据
            ValueList.Add(yValue);

            //确保Y轴曲线不会超过图表
            int maxY = (int)ValueList.Max();
            AxisYMax = maxY + 30;

            //Y轴保持数据居中(曲线会上下晃动)
            //int minY = ValueList.Count == 1 ? 0 : (int)ValueList.Min();
            //AxisYMin = minY - 10;

            //y轴的设置
            if (ValueList.Count > TabelShowCount)
            {
                AxisXMax = ValueList.Count - 1;
                AxisXMin = ValueList.Count - TabelShowCount;
            }

            //这里如果移除数组,图表曲线会原地起伏,就没有X轴移动的动画效果了
            //if (ValueList.Count > 20)
            //{
            //    ValueList.RemoveAt(0);
            //}
        }

        public Mode()
        {
            AxisXMax = 10;
            AxisXMin = 0;
            AxisYMax = 10;
            AxisYMin = 0;

            ValueList = new ChartValues<double>();
            LineSeriesCollection = new SeriesCollection();

            CustomFormatterX = CustomFormattersX;
            CustomFormatterY = CustomFormattersY;

            LineSeries lineseries = new LineSeries();
            lineseries.DataLabels = true;
            lineseries.Values = ValueList;
            LineSeriesCollection.Add(lineseries);
        }
    }
}
运行后一直点击测试按钮,就可以看到效果了。
源码下载地址:点击下载
写作不易,如果这个帖子对你有用,欢迎关注 + 点赞 + 留言,谢谢
end


 826
826


 被折叠的 条评论
为什么被折叠?
被折叠的 条评论
为什么被折叠?
 到【灌水乐园】发言


