


 这篇博客深入研究了Happywhale比赛中的数据集,包括不同物种的不平衡分布、鲸鱼与海豚的对比、图像尺寸与类别之间的关系,以及训练集与测试集的宽度和高度分布。通过可视化工具,作者展示了数据的初步特征和潜在的预处理步骤。
[pytorch] Kaggle大型数据集 数据分析+可视化
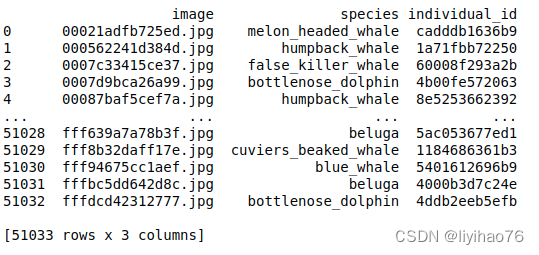
比赛中的数据包含来自 28 个不同研究机构的 30 个不同物种(鲸鱼和海豚)的 15,000 多只独特个体海洋哺乳动物的51033张图像。比赛要求是对测试集个体id的分类。
kaggle 比赛数据详情及数据集下载:Happywhale - Whale and Dolphin Identification
项目代码:Happywhale: Data Distribution
参数
import os
from glob import glob
from tqdm.notebook import tqdm
import numpy as np
import math
import random
import pandas as pd
import matplotlib.pyplot as plt
import plotly.express as px
import cv2
import imagesize

import torch
import torch.nn as nn
import torch.nn.functional as F
from torch.utils.data import DataLoader, Dataset
import timm
try:
    from cuml import TSNE, UMAP # if gpu is ON
except:
    from sklearn.manifold import TSNE # for cpu
import wandb
import IPython.display as ipd
class CFG:
    seed          = 42
    base_path     = './happy-whale-and-dolphin'
    embed_path    = './happywhale-embedding-dataset' # `None` for creating embeddings otherwise load
    ckpt_path     = './happy-whale-and-dolphin/checkpoint/tf_efficientnet_b0_aa-827b6e33.pth' # checkpoint for finetuned model by debarshichanda
    num_samples   = None #  None for all samples
    device        = torch.device("cuda:0" if torch.cuda.is_available() else "cpu")
    competition   = 'happywhale'
    _wandb_kernel = 'awsaf49'
# 可再现性 Reproducibility
def seed_torch(seed_value):
    random.seed(seed_value) # Python
    np.random.seed(seed_value) # cpu vars
    torch.manual_seed(seed_value) # cpu  vars
    if torch.cuda.is_available():
        torch.cuda.manual_seed(seed_value)
        torch.cuda.manual_seed_all(seed_value) # gpu vars
    if torch.backends.cudnn.is_available:
        torch.backends.cudnn.deterministic = True
        torch.backends.cudnn.benchmark = False
    print('# SEEDING DONE')
seed_torch(CFG.seed)
meta data 原数据
增加路径信息
df = pd.read_csv(f'{CFG.base_path}/train.csv')  # 读取训练文件 现在df中只有图片名字
df['image_path'] = CFG.base_path+'/train_images/'+df['image'] # df后面加上一列 图片的相对路径
df['split'] = 'Train' # 再加上一列 代表训练集

test_df = pd.read_csv(f'{CFG.base_path}/sample_submission.csv')
test_df['image_path'] = CFG.base_path+'/test_images/'+test_df['image']
test_df['split'] = 'Test'

print('Train Images: {:,} | Test Images: {:,}'.format(len(df), len(test_df)))
# Train Images: 51,033 | Test Images: 27,956
将数据分成两大类,修正物种标签错误
# 将 beluga、globis 转换为 wales 以获取 2 类标签。
# 根据物种中是否含有鲸鱼或海豚,从而将数据划分为两大类 将其结果保存到class列中
# convert beluga, globis to whales
df.loc[df.species.str.contains('beluga'), 'species'] = 'beluga_whale'
df.loc[df.species.str.contains('globis'), 'species'] = 'short_finned_pilot_whale'
df.loc[df.species.str.contains('pilot_whale'), 'species'] = 'short_finned_pilot_whale'
df['class'] = df.species.map(lambda x: 'whale' if 'whale' in x else 'dolphin')

# # 数据修复
# fix duplicate labels
# https://www.kaggle.com/c/happy-whale-and-dolphin/discussion/304633
df['species'] = df['species'].str.replace('bottlenose_dolpin','bottlenose_dolphin')
df['species'] = df['species'].str.replace('kiler_whale','killer_whale')
获取图像大小的函数
# imagesize 它解析图像文件的头并返回图像大小
def get_imgsize(row):
    row['width'], row['height'] = imagesize.get(row['image_path'])
    return row
产生新的数据文件(包含各种信息)
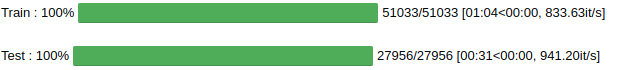
# Train
tqdm.pandas(desc='Train ')
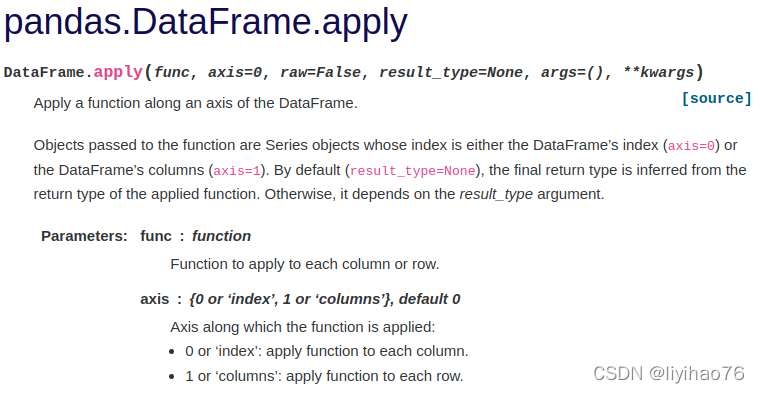
df = df.progress_apply(get_imgsize, axis=1)
df.to_csv('train.csv', index=False)
# Test
tqdm.pandas(desc='Test ')
test_df = test_df.progress_apply(get_imgsize, axis=1)
test_df.to_csv('test.csv',index=False)
运行结果
axis = 1 or ‘columns’: apply function to each row.
新的数据文件

探索性数据分析(EDA)
Different Species
不同物种之间的数量存在不平衡
data = df.species.value_counts().reset_index()
fig = px.bar(data, x='index', y='species', color='species',title='Species', text_auto=True)
fig.update_traces(textfont_size=12, textangle=0, textposition="outside", cliponaxis=False)
fig.show()

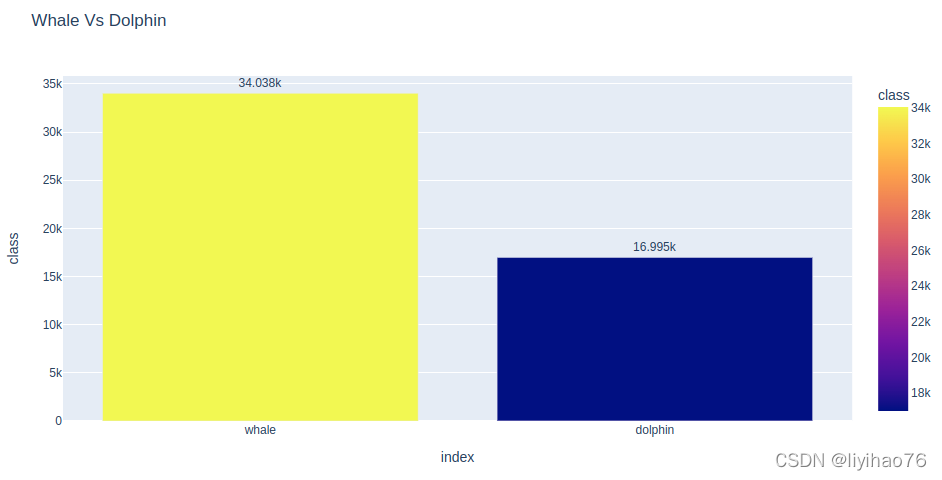
Dolphin Vs Whale
鲸鱼和海豚的比较,鲸鱼的样本更多
data = df['class'].value_counts().reset_index()
fig = px.bar(data, x='index', y='class', color='class', title='Whale Vs Dolphin', text_auto=True)
fig.update_traces(textfont_size=12, textangle=0, textposition="outside", cliponaxis=False)
fig.show()
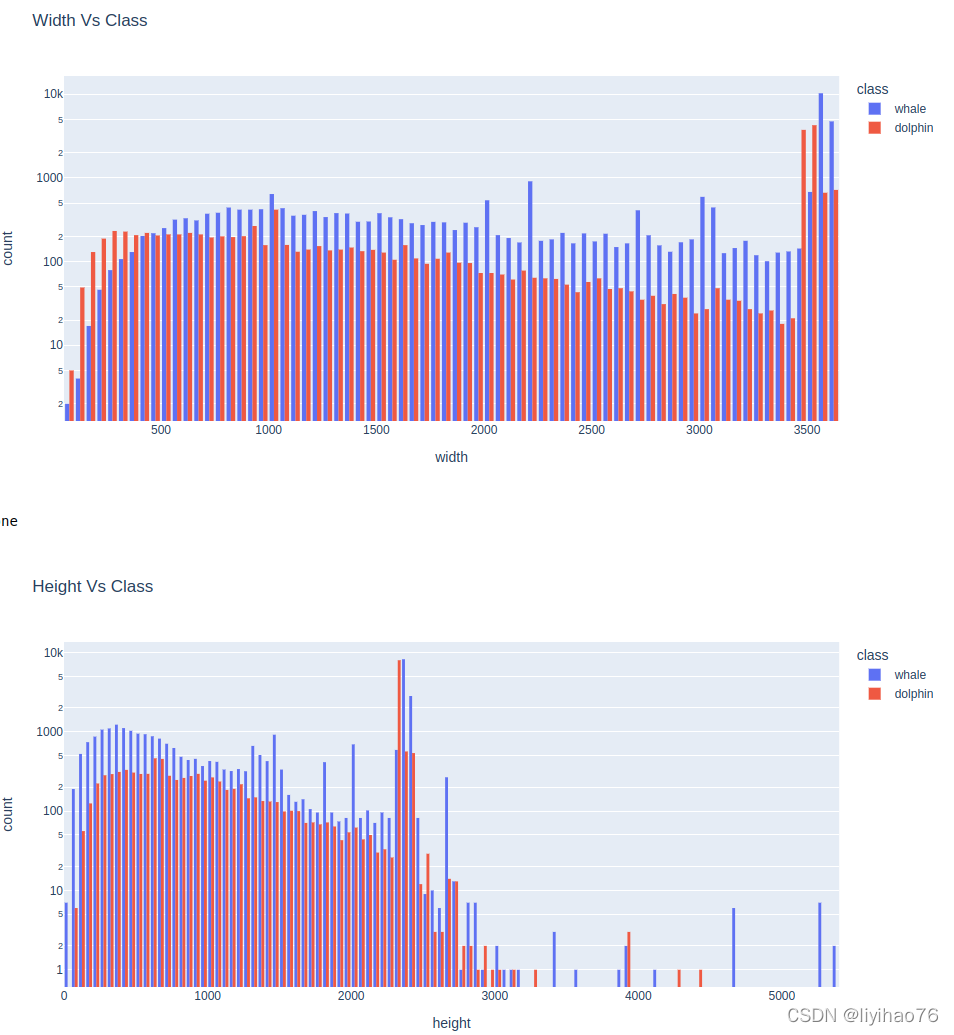
ImageSize Vs Class
可以看出,Whale 和 Dolphin 的 ImageSize 分布是相似的,除了一些高度情况。
fig = px.histogram(df,
                   x="width",
                   color="class",
                   barmode='group',
                   log_y=True,
                   title='Width Vs Class')
display(fig.show())

fig = px.histogram(df,
                   x="height",
                   color="class",
                   barmode='group',
                   log_y=True,
                   title='Height Vs Class')
display(fig.show())
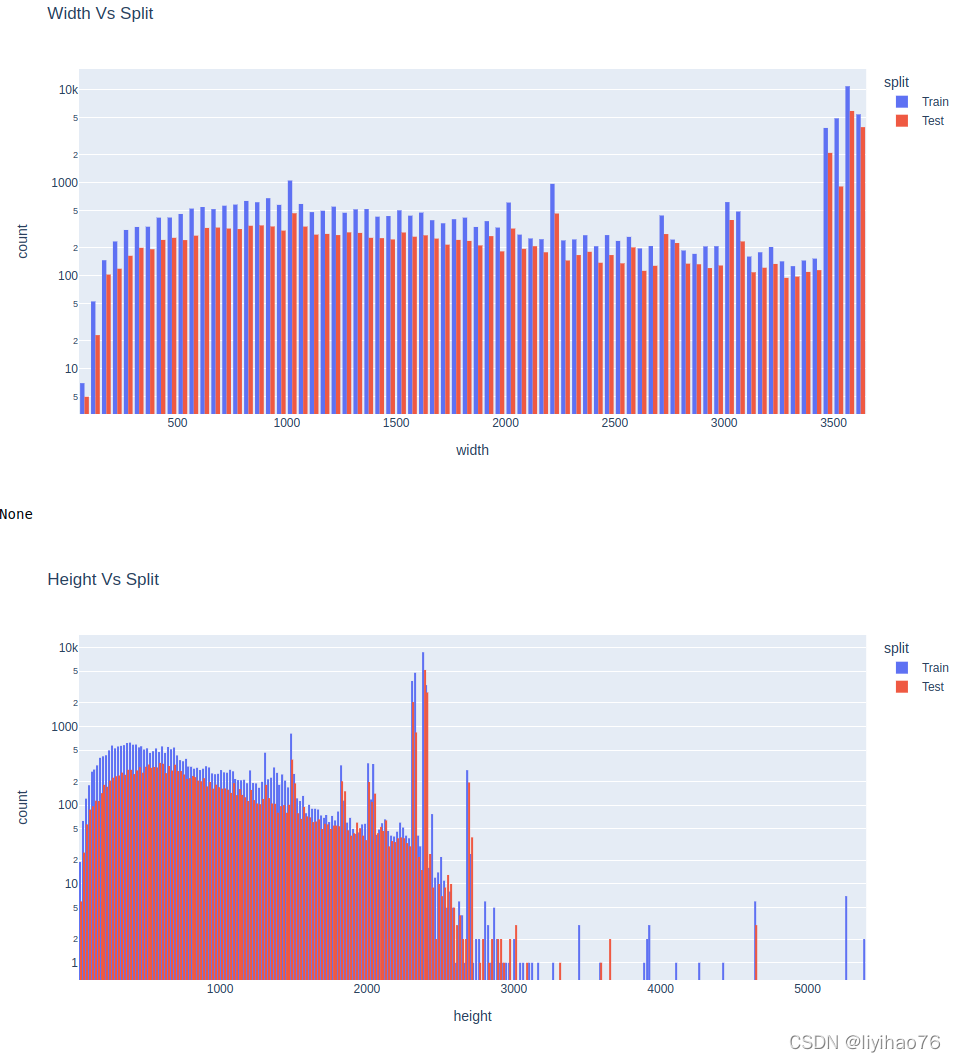
ImageSize Vs Split(Train/Test)
可以注意到,训练数据和测试数据的宽度分布看起来非常相似。 所以,我们可以随意的地调整大小。
对于高度,我们有一些不同。
fig = px.histogram(pd.concat([df, test_df]),
                   x="width",
                   color="split",
                   barmode='group',
                   log_y=True,
                   title='Width Vs Split');
display(fig.show())

fig = px.histogram(pd.concat([df, test_df]),
                   x="height",
                   color="split",
                   barmode='group',
                   log_y=True,
                   title='Height Vs Split');
display(fig.show())
数据可视化
读取数据:1.继承dataset类,重写3个函数。每次产生一个数据 2.使用dataloader每次产生batch_size个数据。
def load_image(path):
    img = cv2.imread(path)
    img = cv2.cvtColor(img, cv2.COLOR_BGR2RGB)
    return img

class ImageDataset(Dataset):
    def __init__(self,
                 path,
                 target=None,
                 input_shape=(128, 256),
                 transform=None,
                 channel_first=True,
                ):
        super(ImageDataset, self).__init__()
        self.path = path
        self.target = target
        self.input_shape = input_shape
        self.transform = transform
        self.channel_first = channel_first
    def __len__(self):
        return len(self.path)

    def __getitem__(self, idx):
        img = load_image(self.path[idx])
        img = cv2.resize(img, dsize=self.input_shape)
        if self.transform is not None:
            img = self.transform(image=img)["image"]
        if self.channel_first:
            img = img.transpose((2, 0, 1))
        if self.target is not None:
            target = self.target[idx]
            return img, target
        else:
            return img

def get_dataset(path, target=None, batch_size=32, input_shape=(224, 224)):
    dataset = ImageDataset(path=path,
                           target=target,
                           input_shape=input_shape,
                          )

    dataloader = DataLoader(
        dataset,
        batch_size=batch_size,
        num_workers=2,
        shuffle=False,
        pin_memory=True,
    )
    return dataloader

train_loader = get_dataset(path=df.image_path.tolist(),
                       target=df.species.tolist(),
                       input_shape=(224,224),
                      )
test_loader = get_dataset(path=test_df.image_path.tolist(),
                       target=None,
                       input_shape=(224,224),
                      )
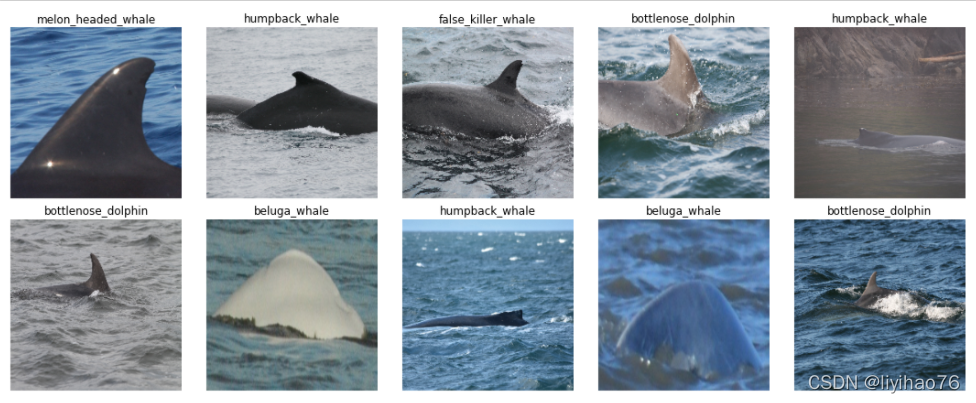
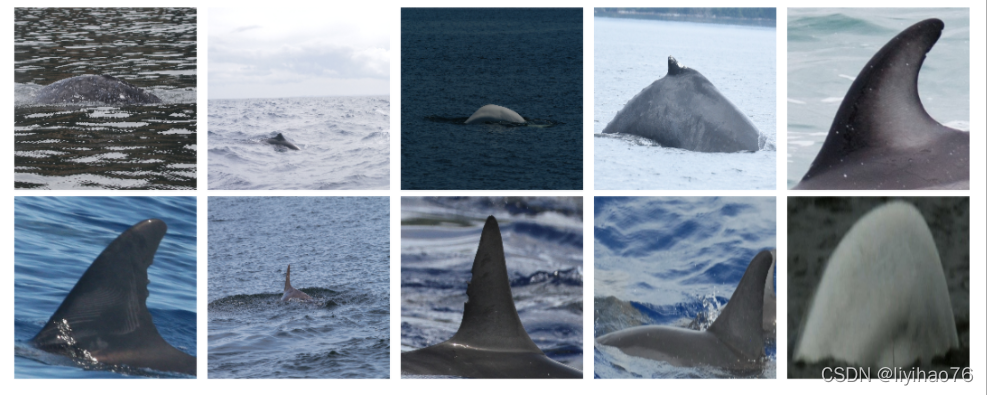
观察训练集图像
def plot_batch(batch, row=2, col=2, channel_first=True):
    if isinstance(batch, tuple) or isinstance(batch, list):
        imgs, tars = batch
    else:
        imgs, tars = batch, None
    plt.figure(figsize=(col*3, row*3))
    for i in range(row*col):
        plt.subplot(row, col, i+1)
        img = imgs[i].numpy()
        if channel_first:
            img = img.transpose((1, 2, 0))
        plt.imshow(img)#plt.imshow((img * 255).astype(np.uint8)) 如果0-1的话
        if tars is not None:
            plt.title(tars[i])
        plt.axis('off')
    plt.tight_layout()
    plt.show()

def gen_colors(n=10):
    cmap   = plt.get_cmap('rainbow')
    colors = [cmap(i) for i in np.linspace(0, 1, n + 2)]
    colors = [(c[2] * 255, c[1] * 255, c[0] * 255) for c in colors]
    return colors
batch = iter(train_loader).next()
plot_batch(batch, row=2, col=5)
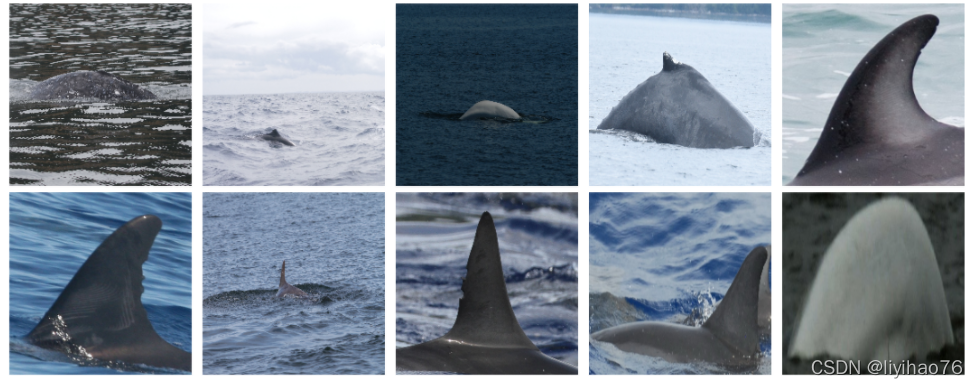
测试集图像
batch = iter(test_loader).next()
plot_batch(batch, row=2, col=5)


 2167
2167

 被折叠的 条评论
为什么被折叠?
被折叠的 条评论
为什么被折叠?
 到【灌水乐园】发言


