


brew直接安装:
brew install prometheusprometheus默认配置,:
global:
  scrape_interval: 15s

scrape_configs:
  - job_name: "prometheus"
    static_configs:
    - targets: ["localhost:9090"]
启动:
prometheus --config.file=/usr/local/etc/prometheus.yml浏览器9090端口打开:
localhost:9090页面样式,可以输入查看指标数据:

安装Grafana
brew install grafana运行Grafana
brew services start grafana浏览器访问http://localhost:3000就可以看到Grafana页面
默认密码 admin/admin
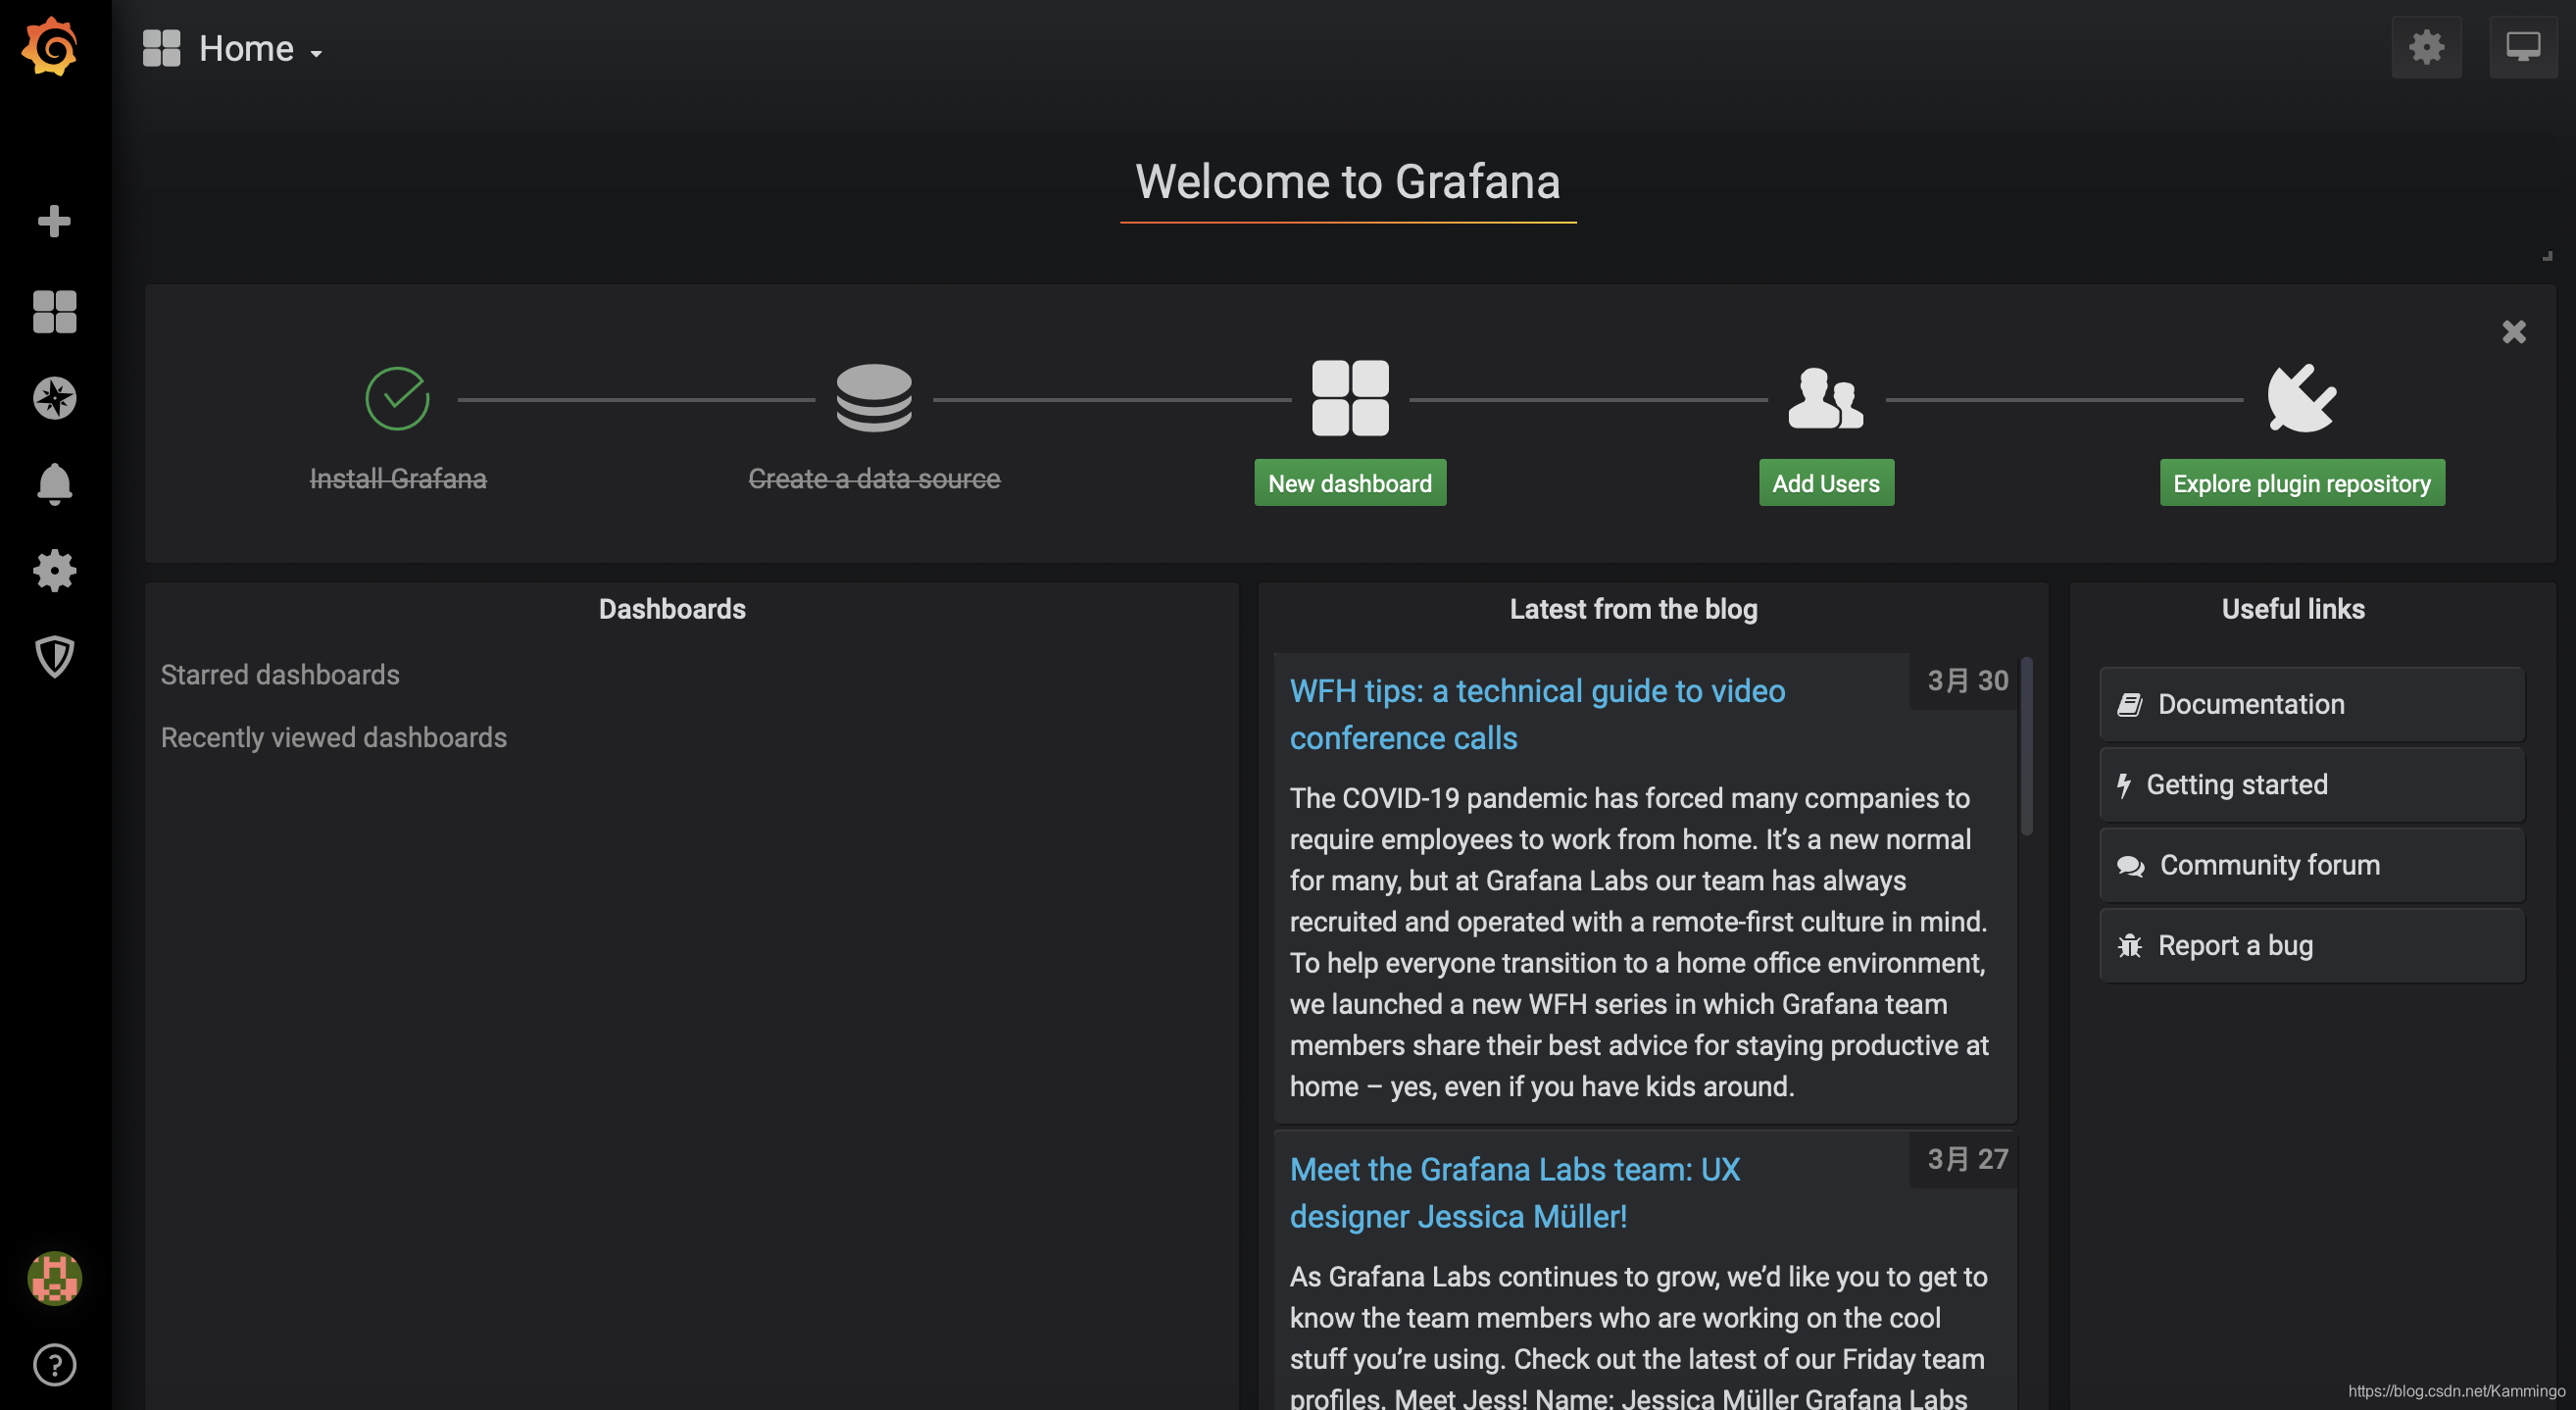
创建数据图形
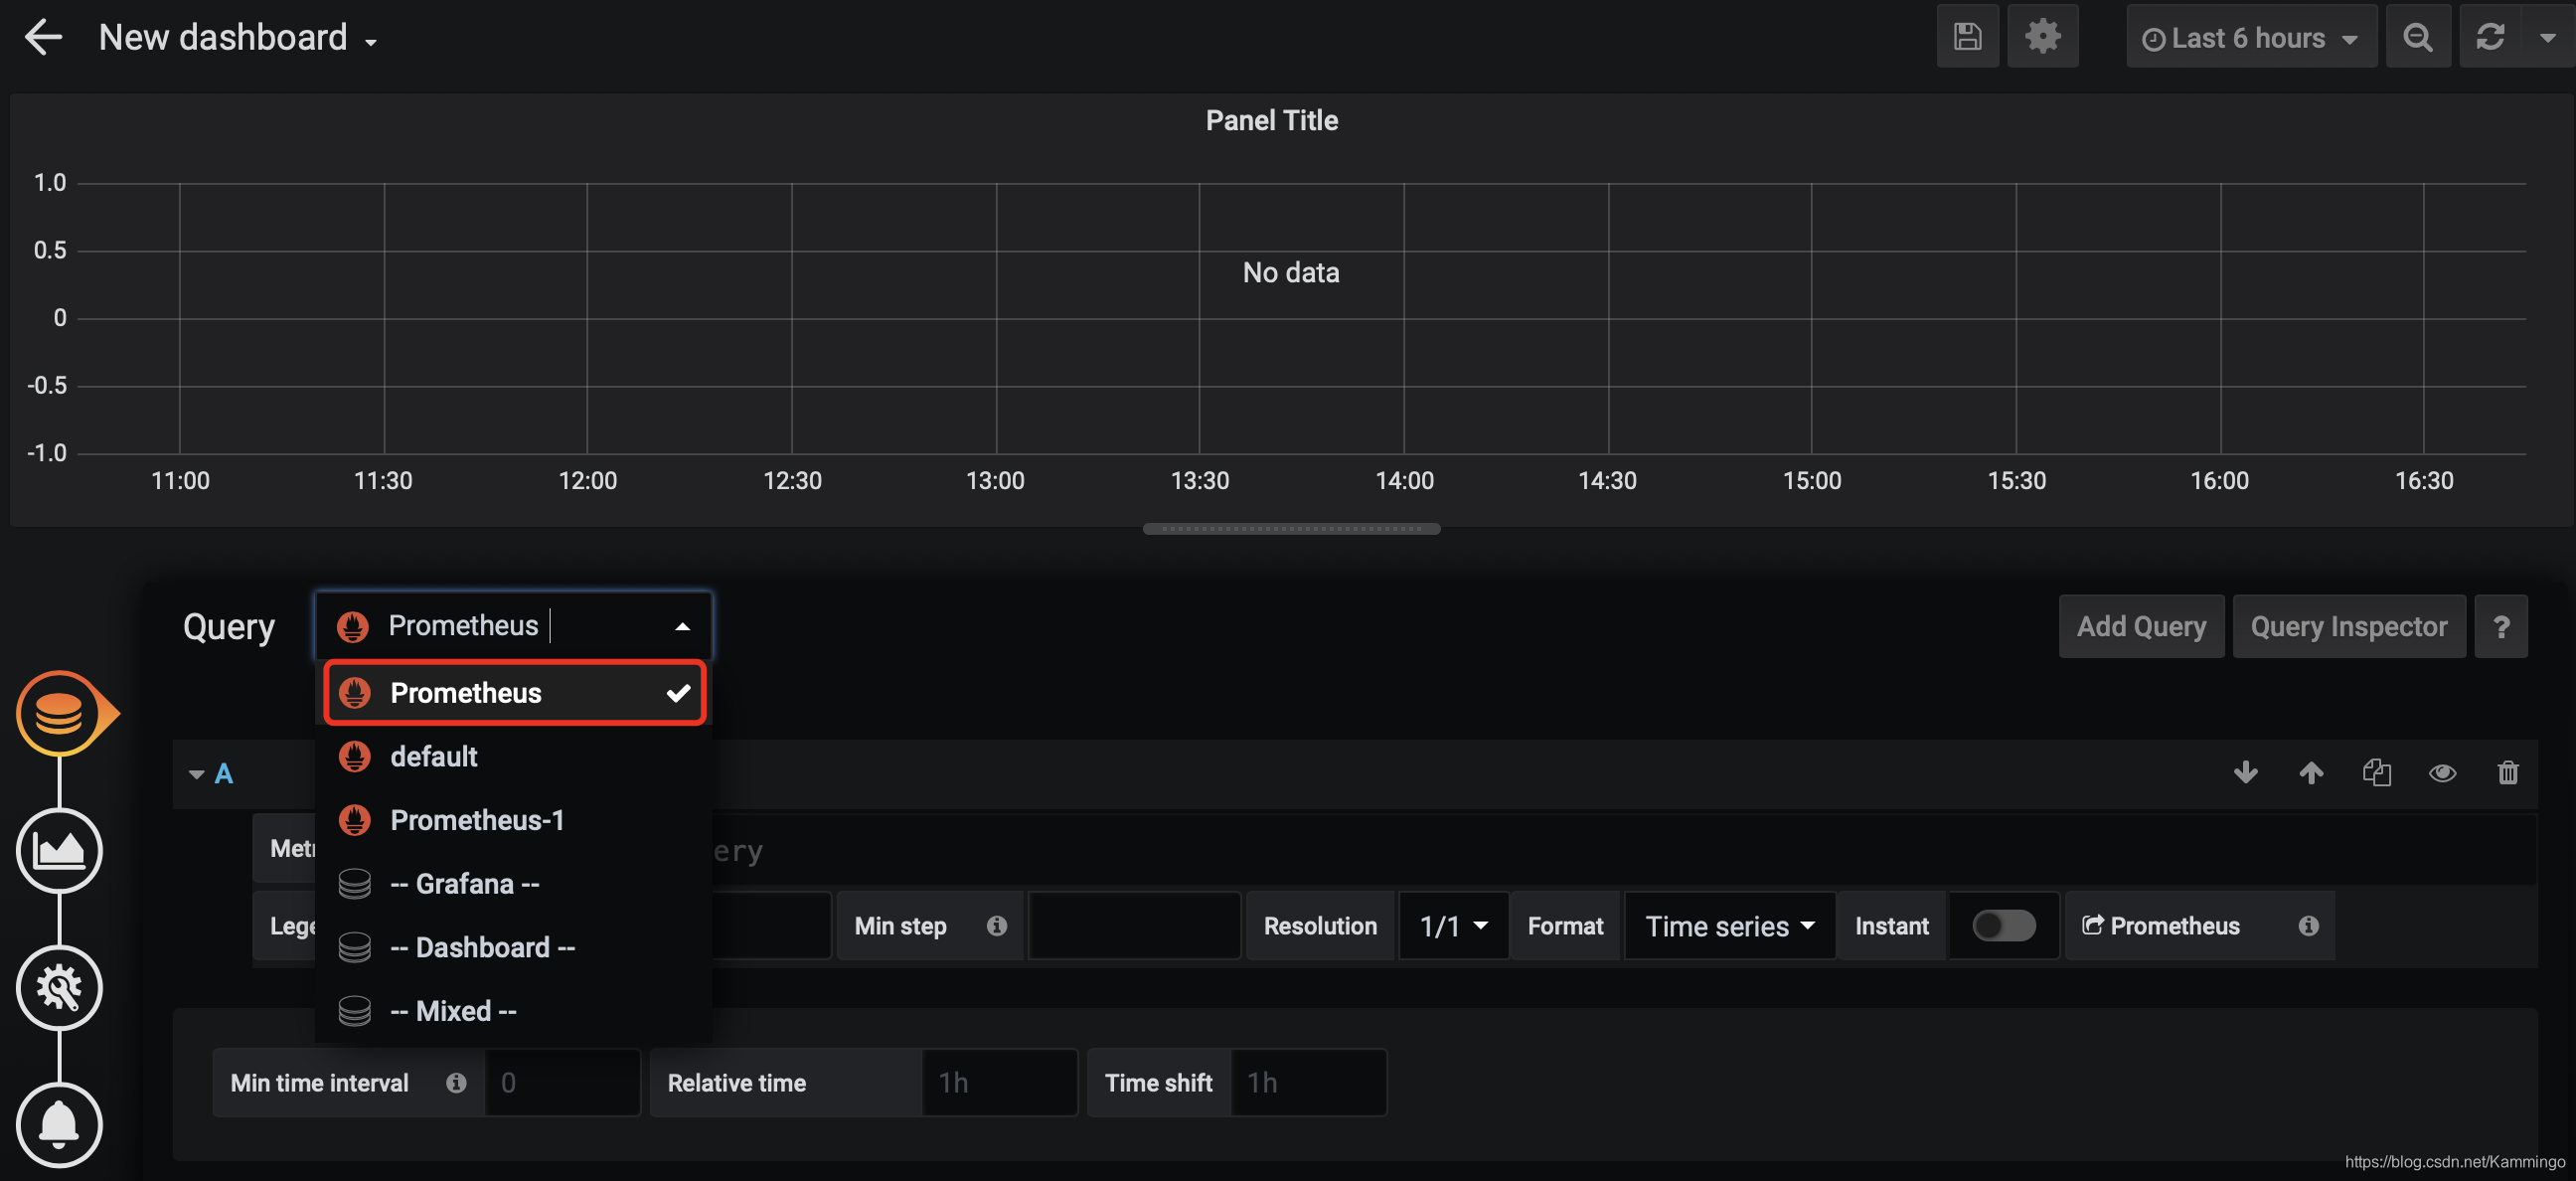
选择监控数据来源
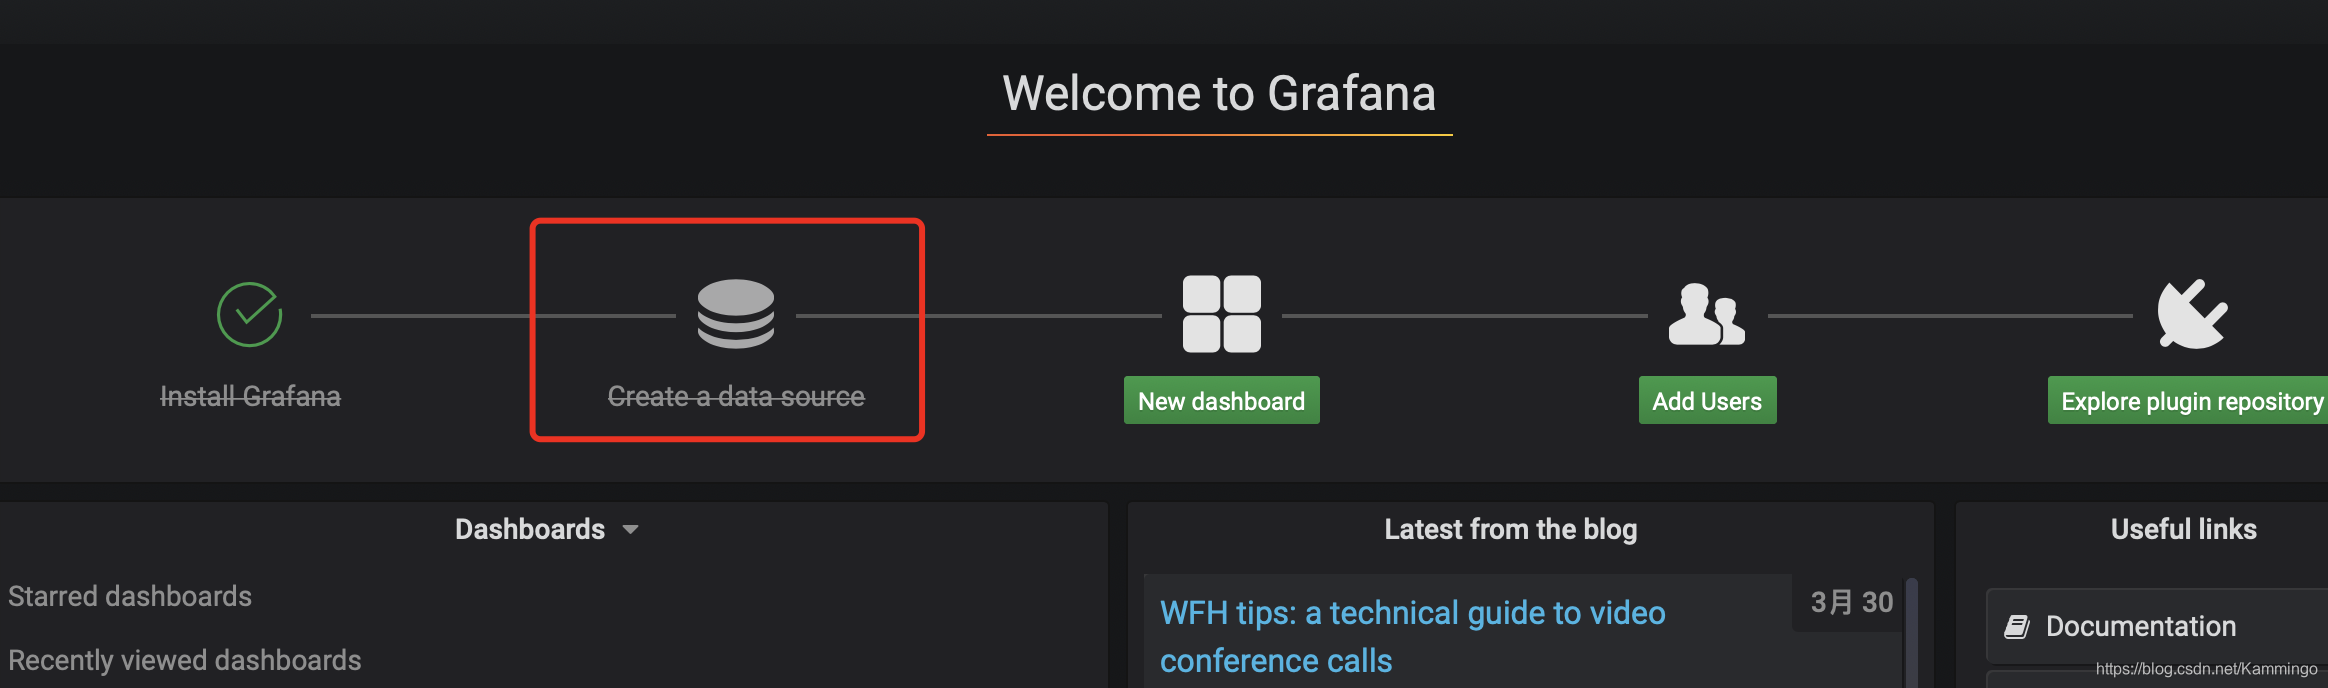
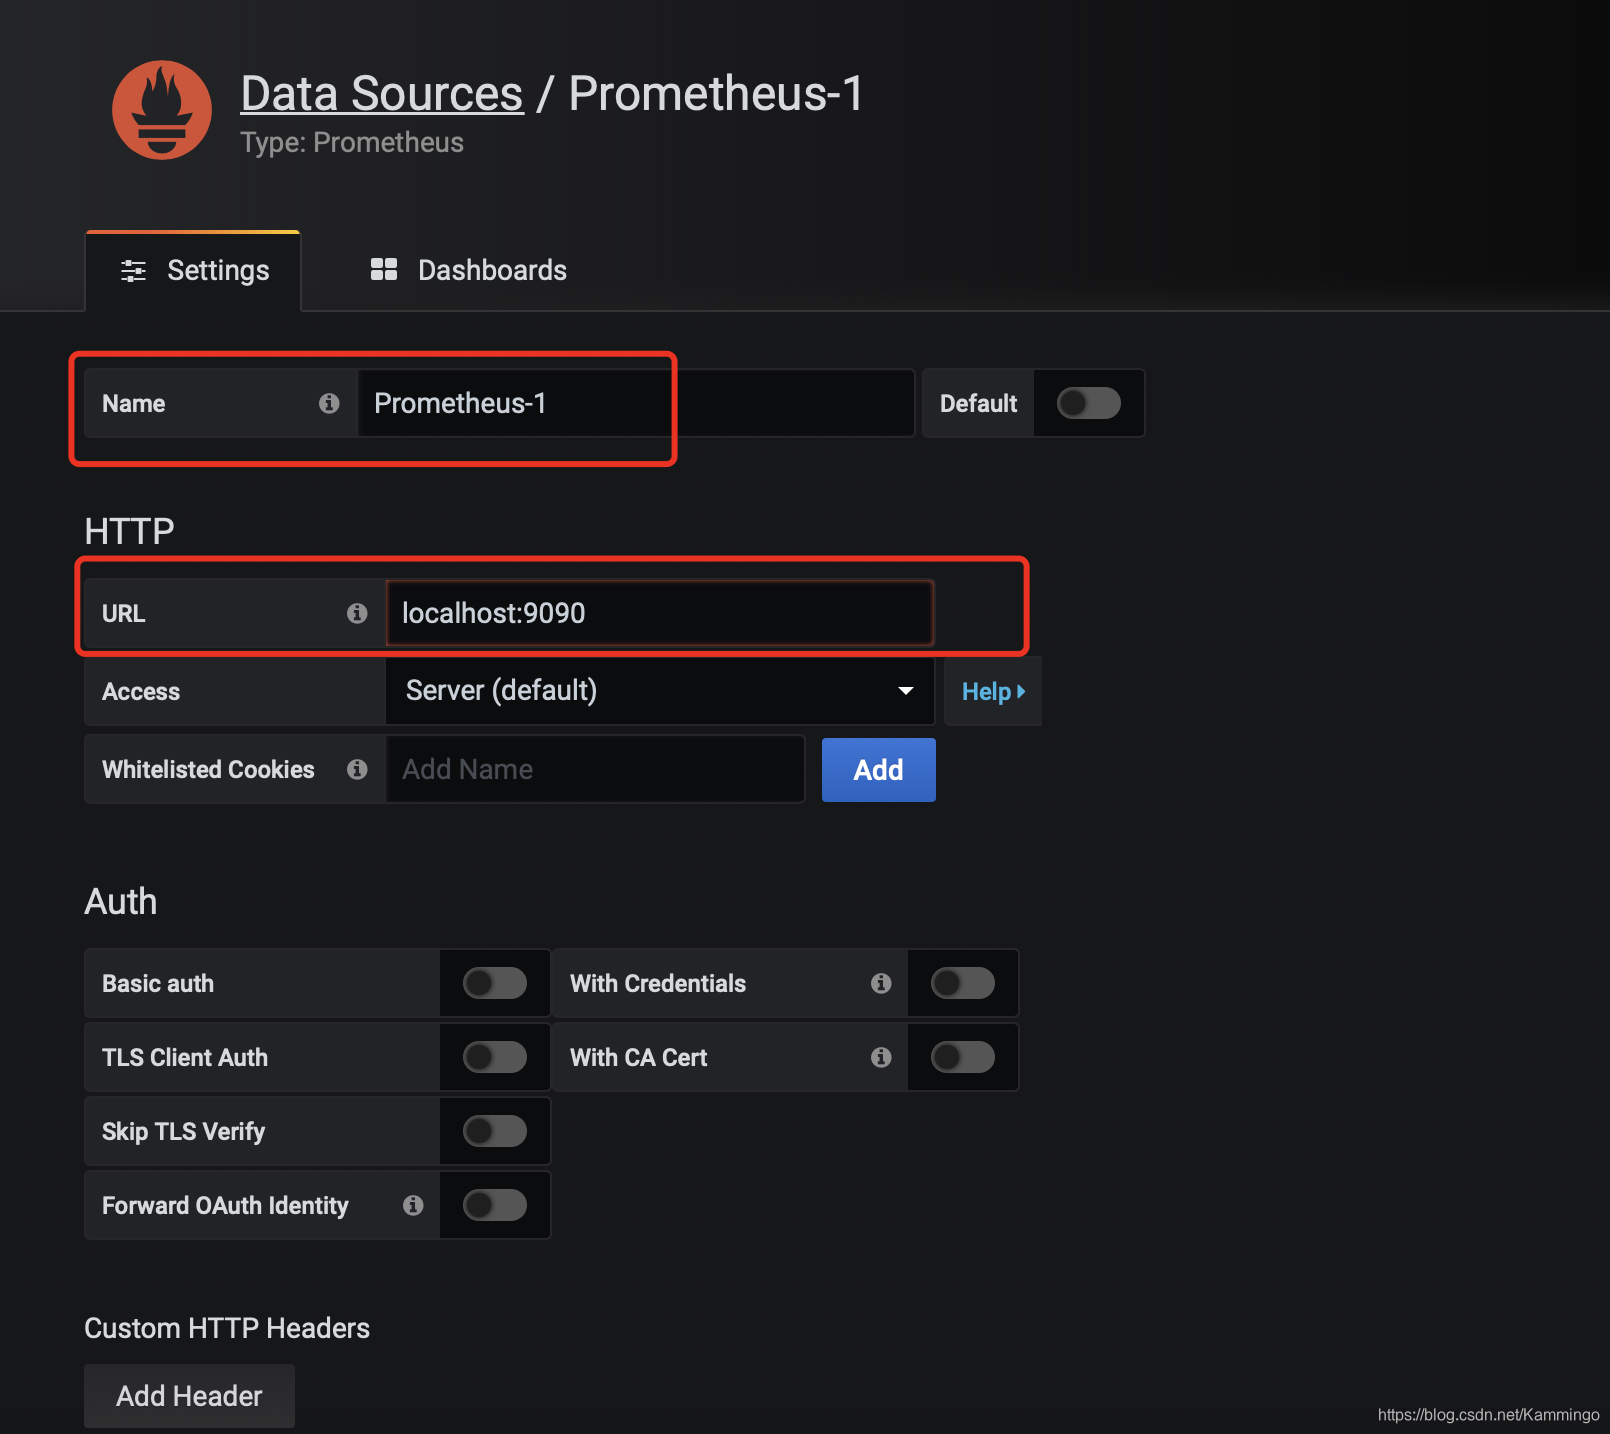
这里创建的是prometheus

定义监控名、url
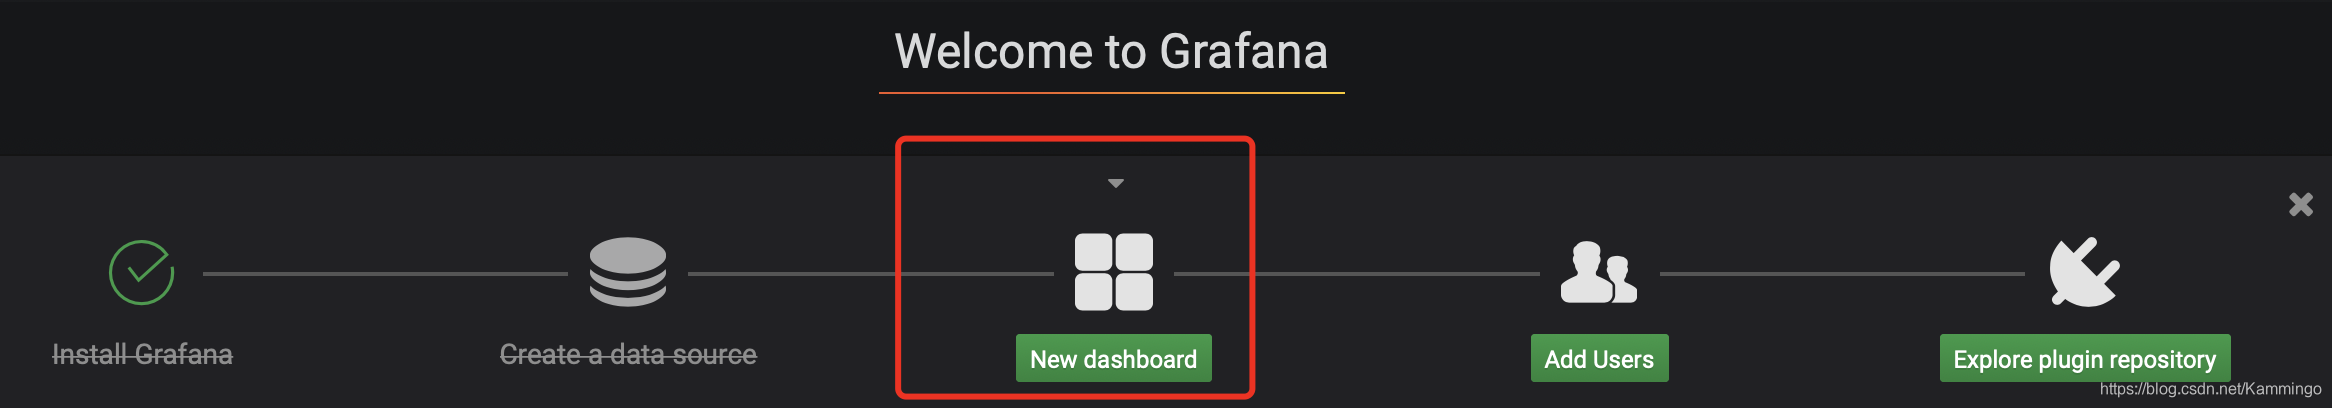
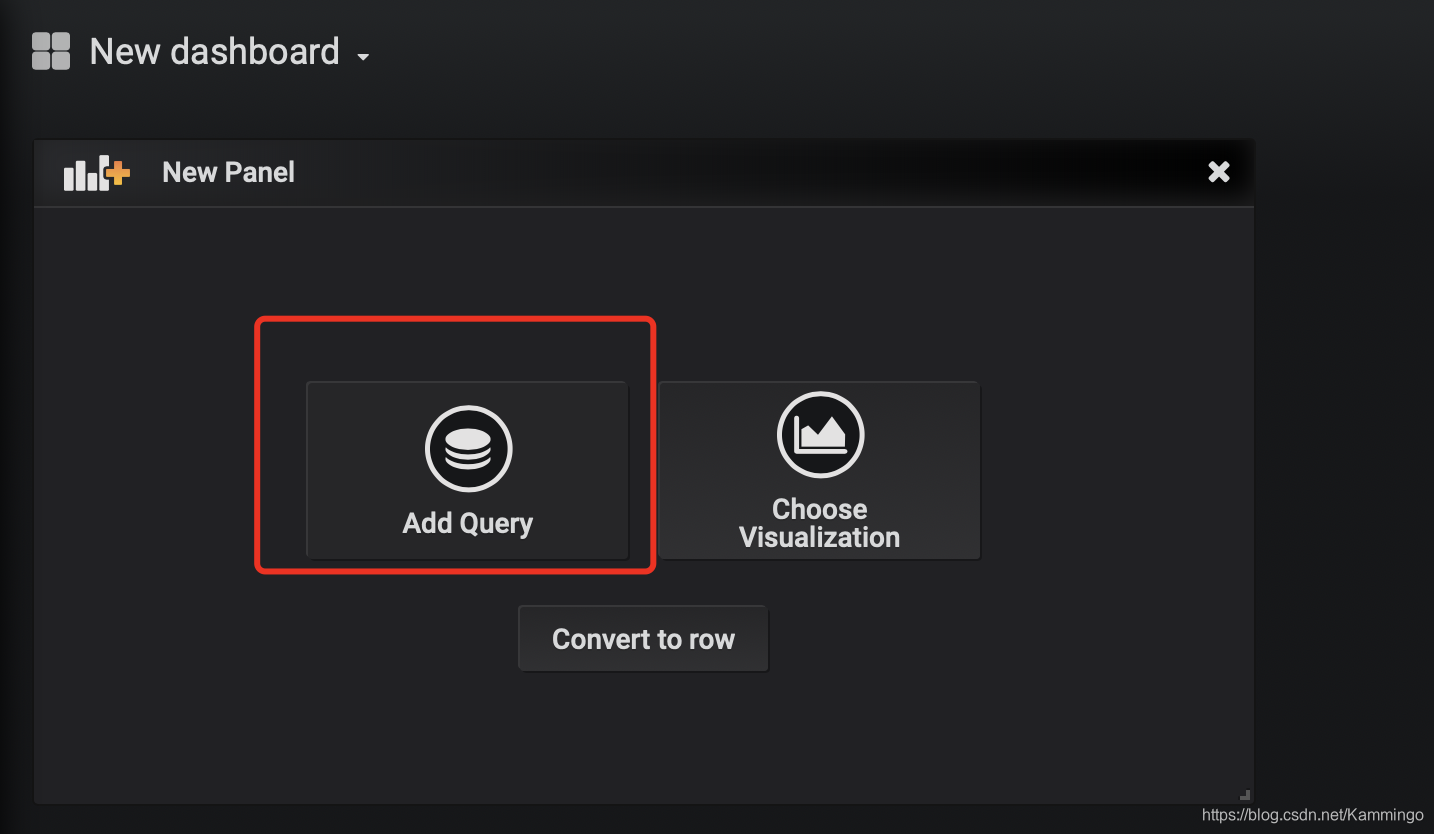
添加图形
选择被监控名
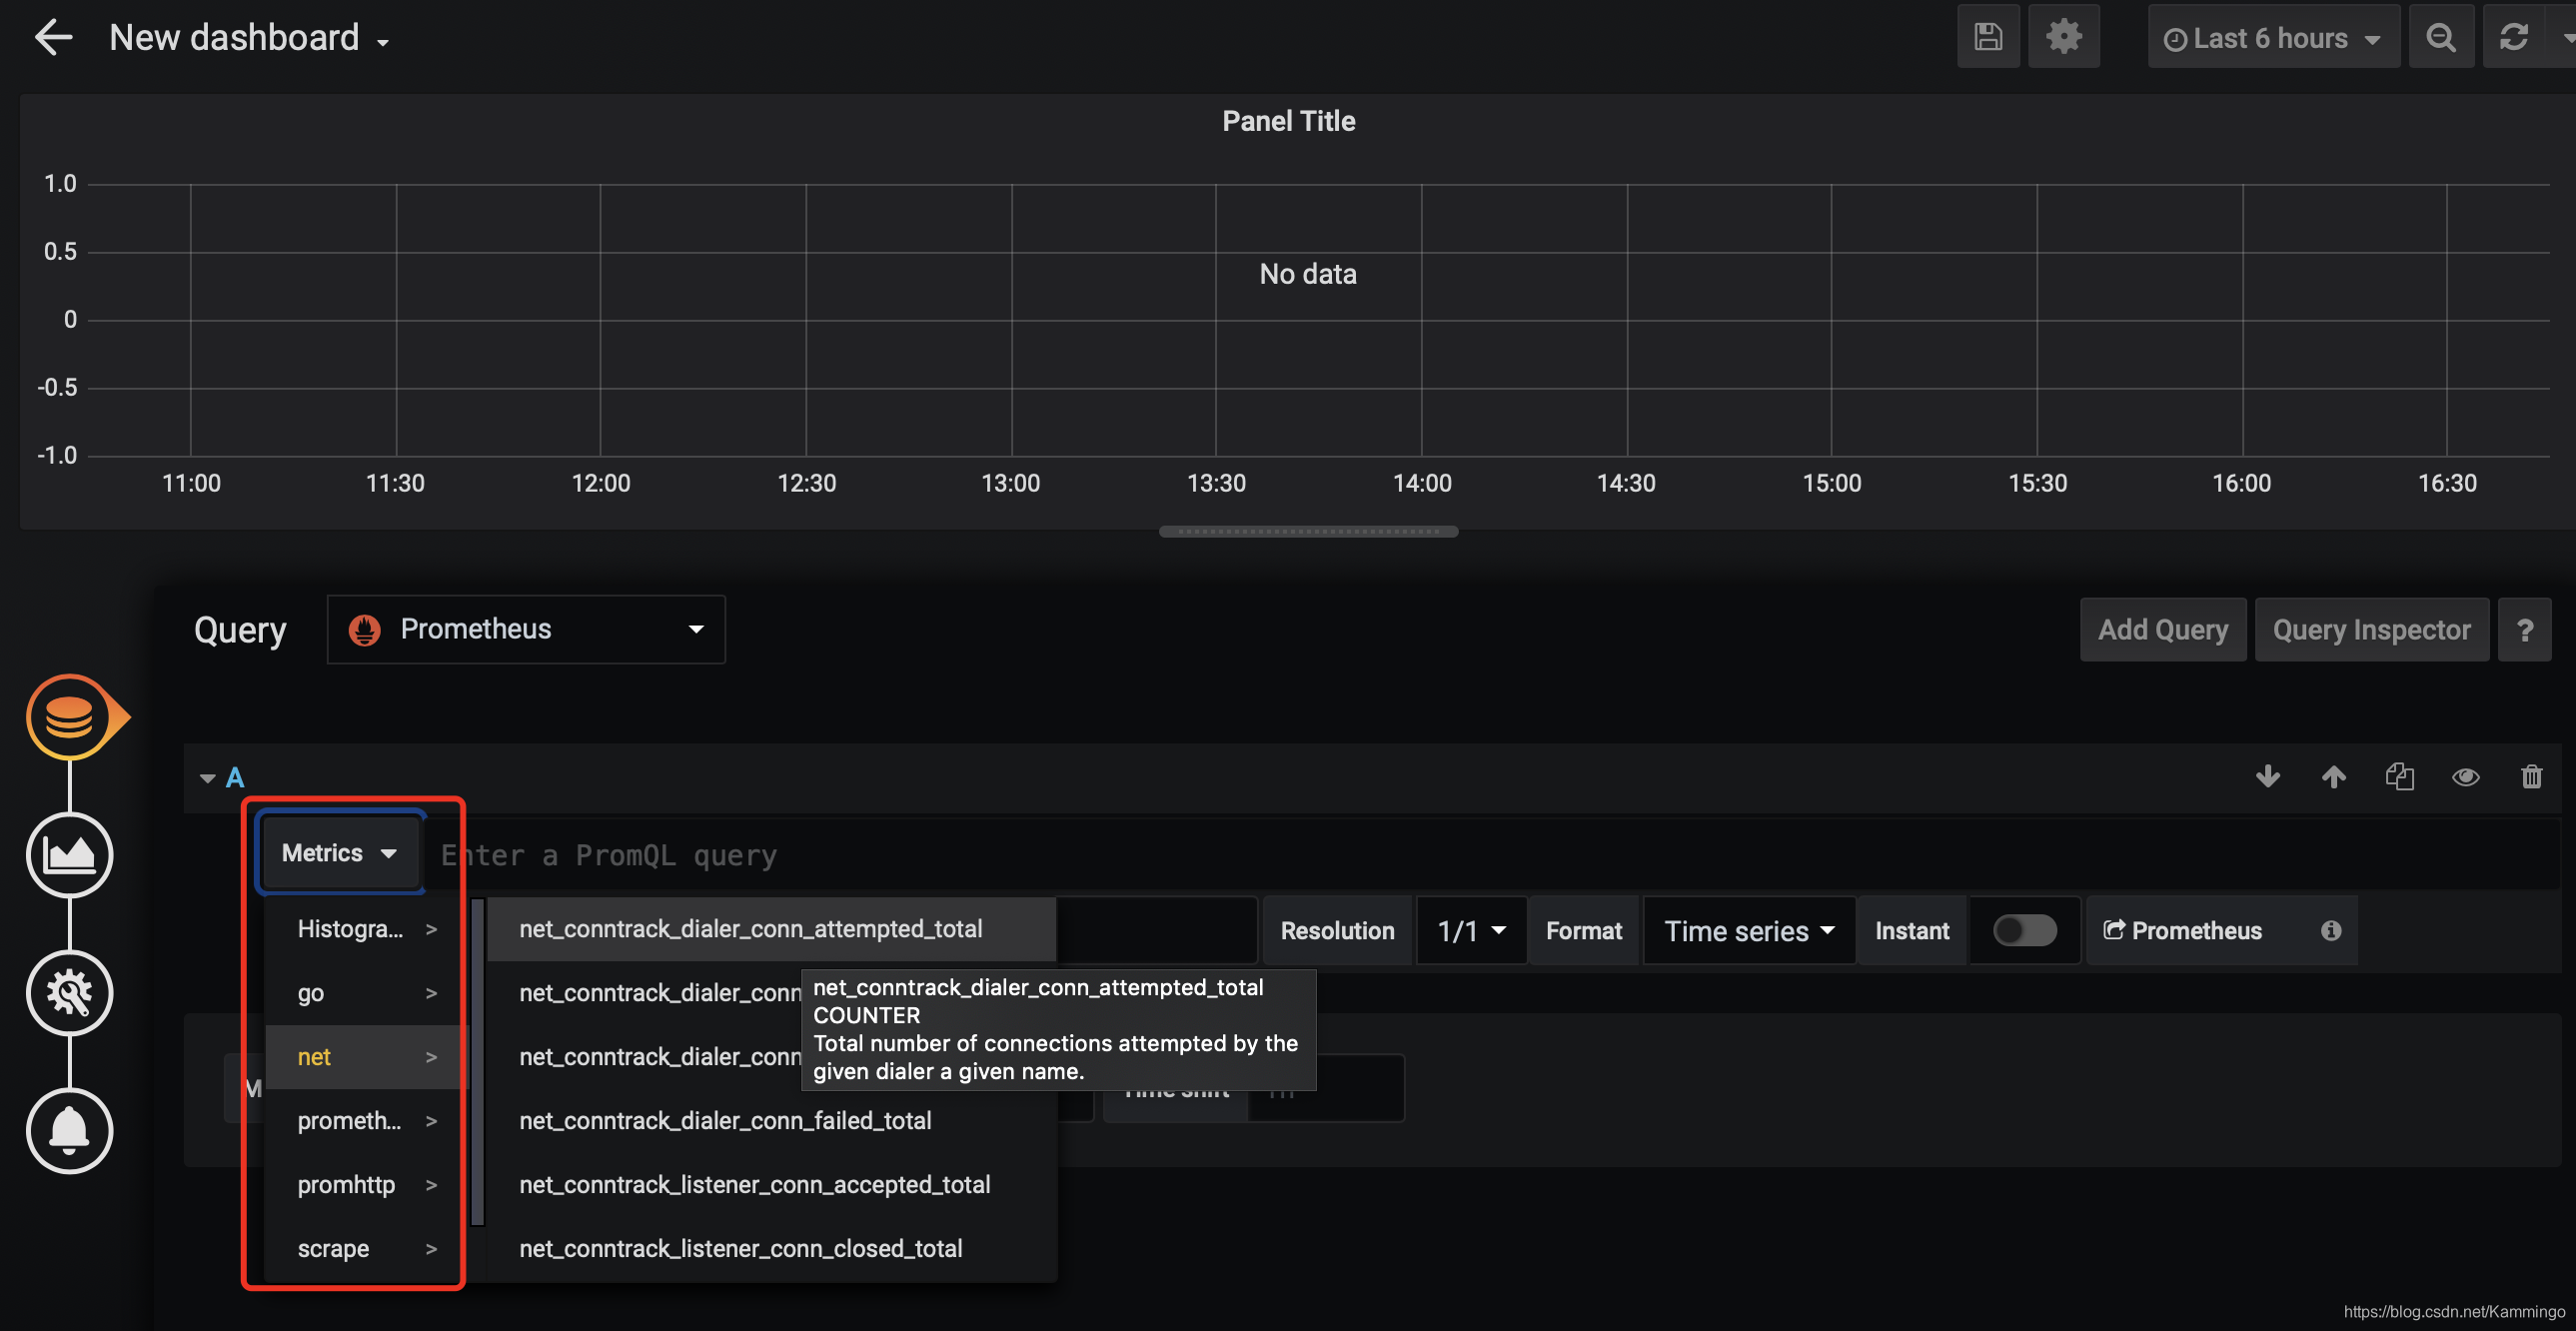
选择监控项
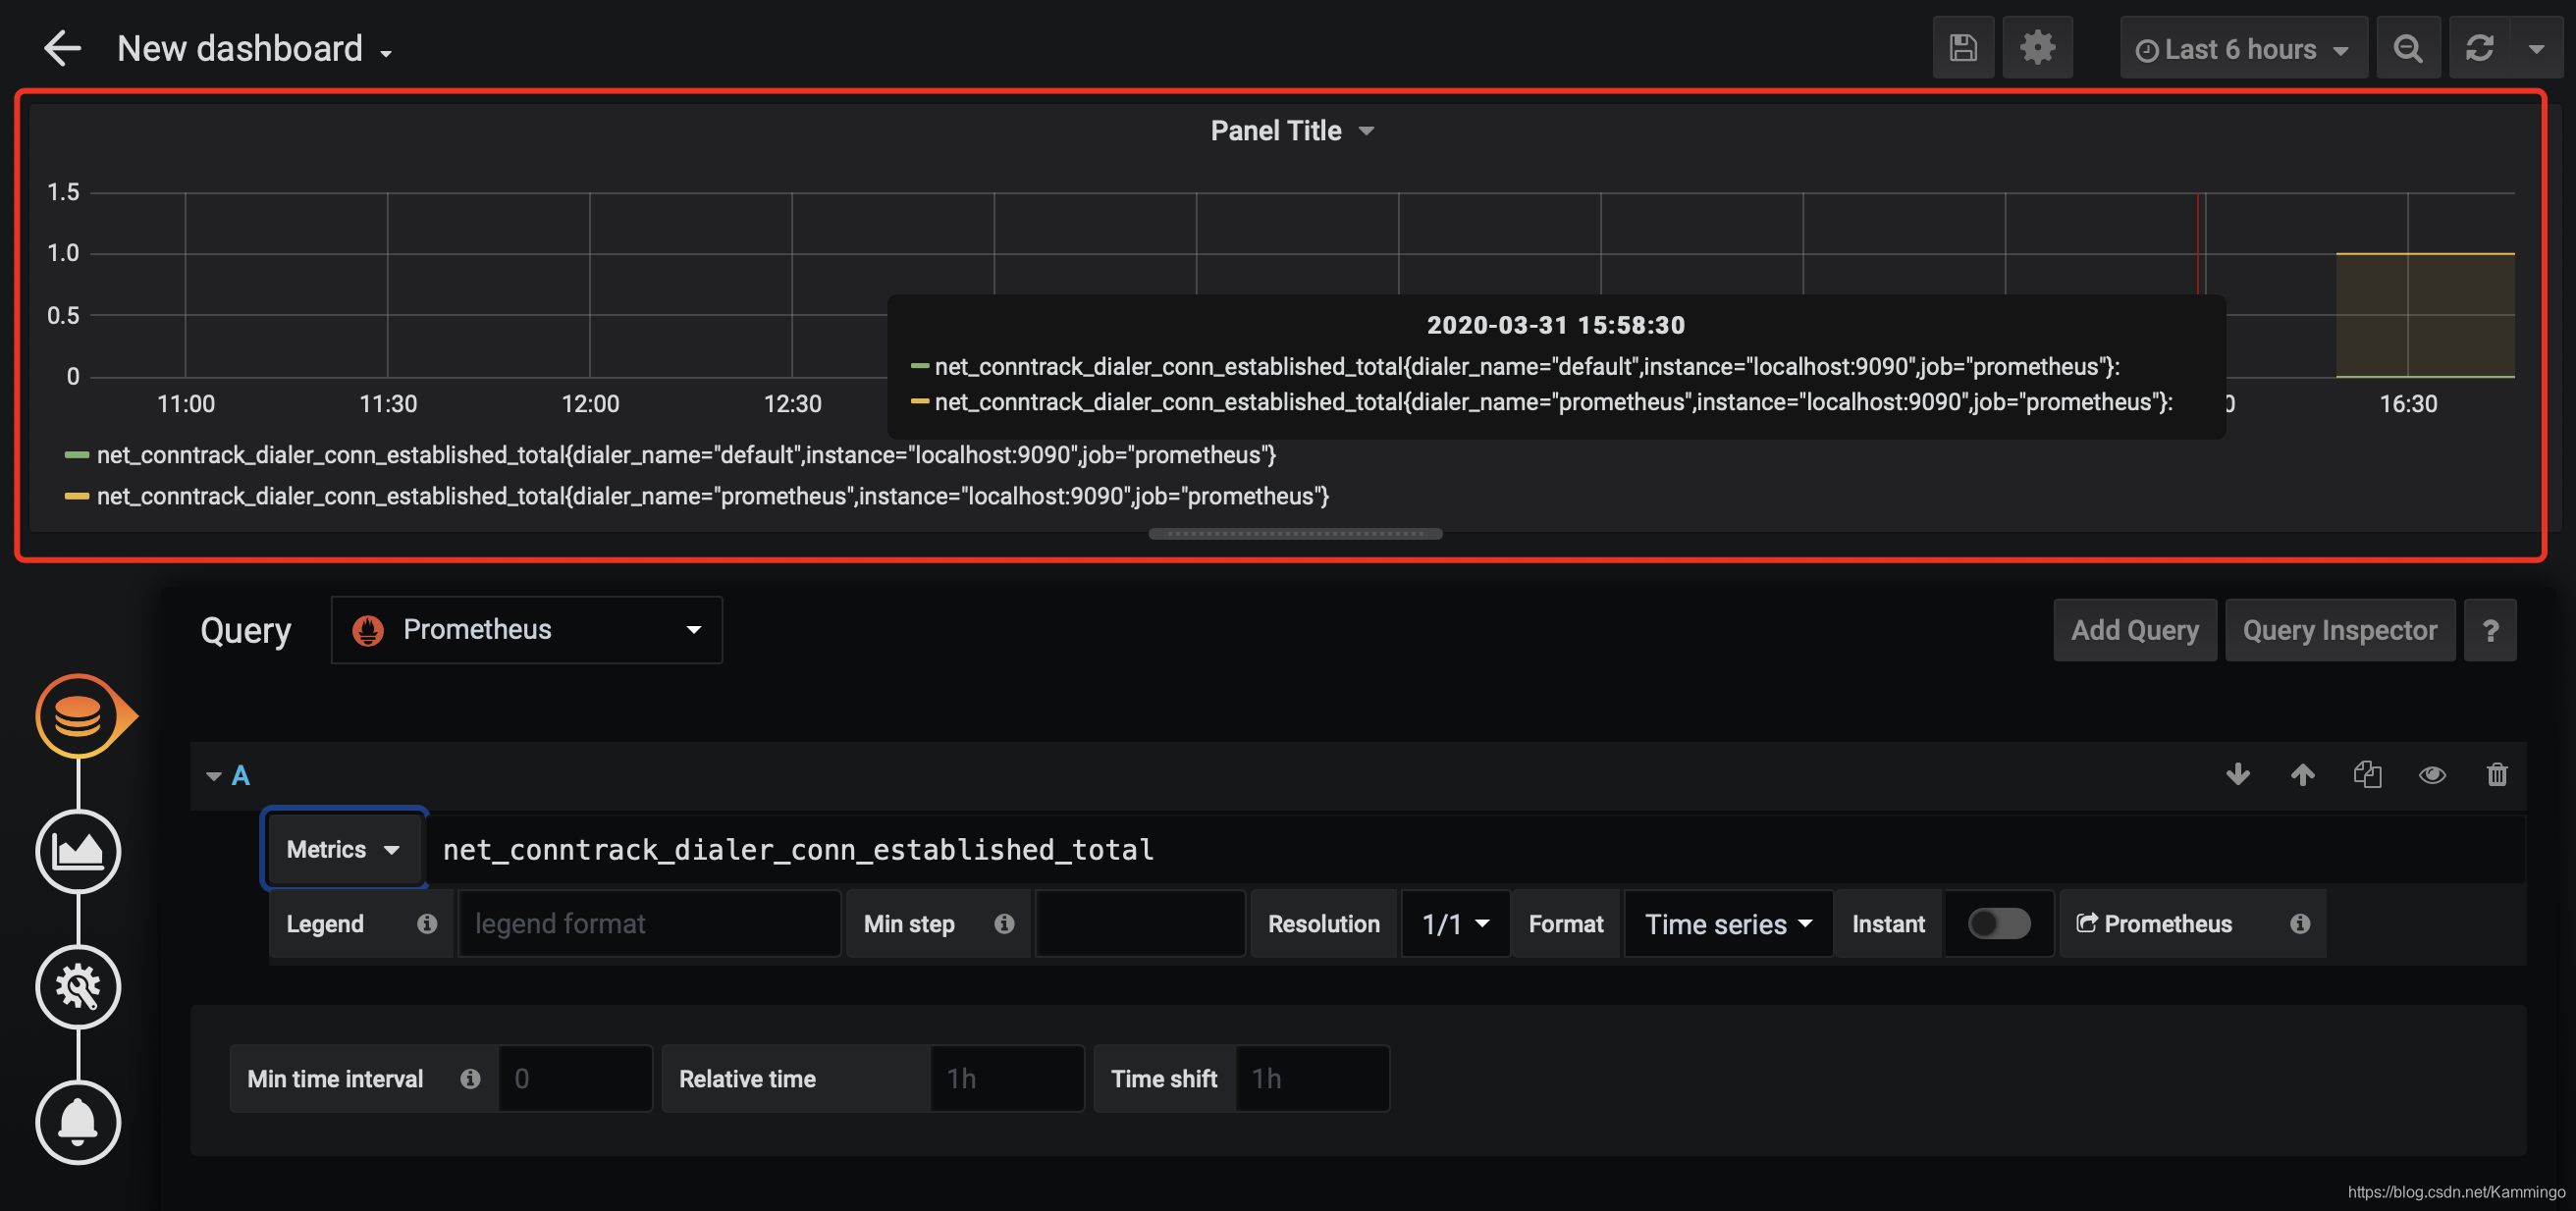
展示监控数据


 1641
1641


 被折叠的 条评论
为什么被折叠?
被折叠的 条评论
为什么被折叠?
 到【灌水乐园】发言


