


 本文详细介绍了地图API的各种功能,包括经纬度加解密、经纬度类、地图类、覆盖物类、聚合类、主动绘制图形类、图形编辑类、图形点类、轨迹线类、右键菜单类、工具类等。通过示例代码展示了如何实例化、操作和事件监听,涵盖了从基础的添加、删除、移动覆盖物,到复杂的图形编辑和实时轨迹绘制等功能。
在线地图文档:WMap 地图文档
目录
-1、GPS(经纬度加解密类)
注:国内经纬度是需要GPS类来对WGS转GCJ坐标系处理的(无论是高德或是其他地图,都是需要这步进行转化,因为这是国内GCJ坐标系限制)
const point = [116.482301, 39.99639]
const encPoint = new WMap.GPS().gcj_encrypt(point[0], point[1]) // 加密后数据
const decPoint = new WMap.GPS().gcj_decrypt(encPoint.lng, encPoint.lat) // 解密后数据
// 注意GPS类转化的时候,所属方法第一参数为纬度,第二参数为经度,除此以外,本地图其他地方都是先经度后纬度

方法详解:
gcj_encrypt(wgsLon, wgsLat) // WGS-84 to GCJ-02
gcj_decrypt(gcjLon, gcjLat) // GCJ-02 to WGS-84
0、LngLat (经纬度类)
注: 本地图所有传入经纬度都必须先用GPS类转成国内的经纬度,然后再由LngLat类转换再使用,下列所有类的例子中都没有用GPS类先进行转换,你可以在自己使用时加上即可
const lngLat = new WMap.LngLat(116.477648,39.997149)

注: 本地图所有传入经纬度都必须先用经纬度类转换再使用
// 默认地图使用的是'EPSG:3857'坐标系, 传入的值是 'EPSG:4326'坐标系

// 参数详解
lng: number // 经度
lat: number // 纬度

// 输出

{
    this.olat: number // 'EPSG:3857' 下纬度
	this.olng: number // 'EPSG:3857' 下经度
	this.lat: number // 传入的纬度
	this.lng: number // 传入的经度
}

// 方法详解
fromLonLat(coordinate: {lng: number, lat: number}, projection: string = 'EPSG:3857') // 经纬度坐标转换 EPSG:4326 - 投影的坐标 projection
toLonLat(coordinate: {lng: number, lat: number}, projection: string = 'EPSG:3857') // 投影的坐标 projection  - 经纬度坐标转换 EPSG:4326
getLng() // 获取传入经度
getLat() // 获取传入纬度
offset(x: number, y: number) // 当前经纬度坐标值经度移动w,纬度移动s,得到新的坐标, 经度向右移为正值,纬度向上移为正值,单位为米
distance(lnglat: {lng: number, lat: number}) // 当前经纬度和传入经纬度或者经纬度数组连线之间的地面距离,单位为米
outOfChina(lat: number, lng: number) // 判断坐标是否在中国以外
1、Map (地图类)
const map = new WMap.Map(target, options)

// 参数详解
target:'map', // 默认绑定dom
options:{
    center: new WMap.LngLat(97.848297, 35.49053), //地图中心
    zoom: 6, //地图缩放层级
    minZoom: 0, // 最小可缩放层级
    maxZoom: 18, // 最大可缩放层级
    doubleClickZoom: false, // 是否双击放大
    zoomShow: true, // 是否显示缩放控件
    rotateShow: false, // 是否显示旋转复位控件
    fullScreen: true, // 是否显示全屏控件
    maxExtent: false, // 是否限制地图可拖动范围
    mouseMoveExtent: boundingExtent([ // 默认展示的范围
	    [55.923433618652325, 3.359091468750009],
	    [171.31664592155698, 81.65358702968221]
    ])
    name: 'amap', // 底图默认为高德, 也可使用天地图 'tianditu'
    token: 'xxx' // 底图为天地图时需要token,请自行在官方申请
}

// 方法详解
map.getCenter() // 获取地图的中心位置
map.getMaxZoom() // 获取地图设置的最大缩放
map.getMinZoom() // 获取地图设置的最小缩放
map.updateSize() // 强制更新地图视口大小
map.getCoordinateFromPixel() // 获取当前点击坐标点
map.getPixelFromCoordinate() // 获取当前经纬度坐标像素点
map.getZoom() // 获取当前层级
map.setZoom(zoom: number) // 设置当前层级
map.setCenter(coord: Array[number], zoom: number = 0) // 设置地图中心
map.panTo(coord: Array[number]) // 定位到目标位置
map.setBaseLayer(layerName: string = standard) // satellite 卫星地图图层, standard 标准地图图层, heatmap 热力图层
map.add(markers: Array[Marker] | Marker | INFOWINDOW | ContextMenu | POLYLINE, layerName: string = Map-vector-layer) // 添加 单个或者多个覆盖物(包括但不限于覆盖物,信息框,右键菜单,轨迹线) 到指定图层
map.remove(markers: Array[Marker] | Marker | INFOWINDOW | ContextMenu | POLYLINE, layerName: string = Map-vector-layer) // 指定图层移除 单个或者多个覆盖物(包括但不限于覆盖物,信息框,右键菜单,轨迹线)
map.setFitView() // 地图自动适应所有覆盖物或矢量图形, 以达到最佳视窗
map.setZoomOut(zoomNum: number = 1) // 地图缩小
map.setZoomIn(zoomNum: number = 1) // 地图放大
map.removeGraph(draw: VectorGraph) // 移除交互图形
map.addGraph(draw: VectorGraph) // 添加交互图形
map.getInteractions() // 获取所有交互图形
map.clear() // 清除地图上的各种类型覆盖物(包括不限于聚合/普通覆盖物/矢量图形/历史轨迹)
map.getMarkerById(id) // 获取聚合下单个覆盖物
map.calculateCenter(Array[Marker]) // 计算覆盖物集群的中心点坐标
map.setBaseMap(mapName: 'amap', token?: 'xxx') // 动态设置图层集合 高德setBaseMap('amap'), 天地图setBaseMap('tianditu', token)
map.getBaseMap() // 获取当前正在显示的底图图层
map.addLayer(layer) // 添加图层
map.getMarkerClusterer() // 获取聚合图层
map.setMarkerClusterer() // 设置聚合图层
map.setTop() // 设置置顶
map.setBlur(blur: number) // 设置blur模糊范围
map.setRadius(radius: number) // 设置radius半径大小
map.removeLayer(layerName: string) // 图层移除
// 支持事件
['complete', 'moveend', 'click', 'dblclick', 'contextmenu', 'moving', 'pointermove']

map.on('click', function (e) {
	// e 为地图对象
    // e.lngLat 当前点击坐标点对象
})
示例:
1、点击地图,添加覆盖物:
例图:

代码:
map.on('click', e => {
	const marker = new WMap.Marker({
		map,
		position: e.coordinate,
		content: buildContent()
	})
    // marker弹跳动画效果
	marker.setAnimation('WMAP_ANIMATION_BOUNCE')
	window.animationMarkerTimer = setTimeout(function () {
		marker.setAnimation('WMAP_ANIMATION_NONE')
	}, 1000)
})
2、点击地图,右键操作(右键菜单类有示例)
3、地图内覆盖物集群自适应(视窗自适应调到能够显示所有覆盖物的层级)
例图:

代码:
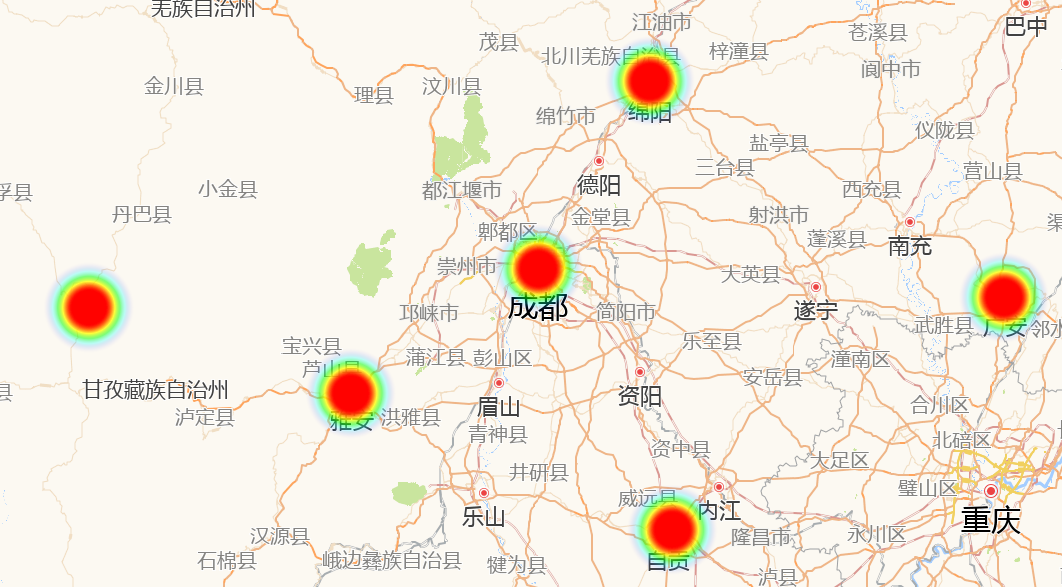
map.setFitView()4、添加热力图
// html
<div style="padding:20px;text-align: left;font-size: 18px;">
<label for="radius">
半径大小:
<input id="radius" type="range" min="1" max="50" step="1" value="20" />
</label>
<label for="blur">
模糊范围:
<input id="blur" type="range" min="1" max="50" step="1" value="15" />
</label>
</div>
<div>
<button id="addHeatLayer">添加热力图层</button>
<button id="removeHeatLayer">移除热力图层</button>
<button id="addMarker">添加覆盖物</button>
<button id="removeMarker">移除覆盖物</button>
</div>
// js
blur &&
(blur.onchange = e => {
console.log(e.target.value, parseInt(blur.value, 10));
map.setBlur(parseInt(e.target.value, 10))
})
radius &&
(radius.onchange = e => {
console.log(e.target.value, parseInt(radius.value, 10));
map.setRadius(parseInt(e.target.value, 10))
})
addHeatLayer.addEventListener('click', () => {
map.setBaseLayer('heatmap');
})
removeHeatLayer.addEventListener('click', () => {
map.removeLayer('heatmap');
})
addMarker.addEventListener('click', () => {
markers.forEach(item => {
const marker = new WMap.Marker({
position: [item.lng, item.lat]
})
markersList.push(marker);
})
map.add(markersList, 'heatmap');
})
removeMarker.addEventListener('click', () => {
map.remove(markersList, 'heatmap');
})2、Marker(覆盖物类)
const marker = new WMap.Marker(options)

// 参数详解:
options: {
    // 通用参数
    map?: null, // 是否直接渲染到地图上, 加上此参数,就不用map.add(marker)
    id: null, // 覆盖物id
	position: [0, 0], // 坐标经纬度
	angle: 0, //角度
	offset: [0, 0], //偏移量
	zIndex: 3, // 矢量图形层级
	extData: {}, // 自定义数据

    // 自定义配置下参数
    content: '', // 自定义html内容

    // 常规配置下参数
    icon: '', // 显示图片,有默认
	rotateWithView: true, // 是否跟随视图旋转
	angle: 0, // 图片旋转角度
	font: 'normal 12px sans-serif',
	label: '',
	fontSize: '12px',
	fontFamily: 'sans-serif',
	fontWeight: 'normal',
	fontColor: '#000',
	placement: 'point', // 默认为point
	labelBgColor: '#fff',
	borderColor: '#000', // 边框颜色
	borderWidth: '1', // 边框宽度
	textBaseline: 'bottom', // t  似乎无效
	textAlign: 'centrer', //文本对齐方式 ,似乎无效,设置会让文本消失
	labelXOffset: 0, // 水平文本偏移量
	labelYOffset: -30, // 垂直文本偏移量
	padding: [5, 5, 5, 5]
}

// 注: Marker分为两种模式,传了content就是自定义配置,不传就是默认的常规配置,
区别就是前者继承将继承于Overlay基类, 后者继承于Feature基类

// 方法详解:
marker.getId() // 获取id
marker.getExtentData() // 获取自定义信息
marker.getPosition() // 获取 Marker 坐标
marker.getOffset() // 获取Marker 偏移

//常规模式
marker.setExtentData(extData: Object) // 设置自定义信息
marker.setAngle(angle: number = 0) // 设置 Marker 角度
marker.setPosition(position: Array[number]) // 设置 Marker 坐标
marker.setId(id: number) // 设置id
marker.move(polyline: Polyline, curPath: 坐标点) // 覆盖物在实时轨迹下的移动

// 自定义模式
marker.setTop() // 置顶
marker.setElement() // 设置 content / html
marker.getContent() // 获取 content str
marker.setPosition(position: Array[number]) // 设置 Marker 坐标
marker.setAnimation(animationName: any) // 设置 Marker 弹跳动画
marker.setOpacity(opacity: number = 1) 设置样式 透明度
marker.setAngle(angle:number = 0) // 设置 Marker 角度

// 支持事件
marker.on('click', e => {
    // e.type 事件类型
    // e.target dom对象
    console.log(e.target.getExtentData()) // 初始化Marker时有extData则获取,无则返回undefined
})
注意:
1、在使用聚合时:目前在大数据量下请使用常规模式来实例化Marker,以提升聚合下初始化加载性能,小数据量比如几千个覆盖物则用哪个模式都可以
2、本Marker类中的方法是基础通用的,和轨迹类中配合使用的Marker方法为特有方法,请在轨迹类中查看
示例:
1、常规模式 默认实例Marker
例图:

代码:
new WMap.Marker({
	map: map,
	position: [104.04885959297181, 46.59148906549072]
})
2、Marker的添加与删除
代码:
// 添加marker
1、map.add(marker1, marker2, marker3, marker4)
2、map.add([marker1, marker2, marker3, marker4])
3、map.add(marker1) map.add(marker2) map.add(marker3) map.add(marker4)

// 删除marker
1、map.remove(marker1, marker2, marker3, marker4)
2、map.remove([marker1, marker2, marker3, marker4])
3、map.remove(marker1) map.add(marker2) map.add(marker3) map.add(marker4)
3、点击marker实现置顶
例图:

代码:
marker1.on('click', function (ev) {
		marker1.setTop()
	})

marker2.on('click', function (ev) {
		marker2.setTop()
	})
4、(官方推荐写法)常规模式 icon + label字符串 + 图标的旋转动画 (这个可用可不用)
例图:

代码:
// 矢量图标
const marker = new WMap.Marker({
	map: map,
	fontSize: '12px',
	fontFamily: 'sans-serif',
	fontWeight: 'normal',
	fontColor: '#000',
	placement: 'point', // 默认为point
	labelBgColor: '#FFF', // 背景颜色
	borderColor: '#000', // 边框颜色
	borderWidth: '1', // 边框宽度
	textBaseline: 'bottom', // t  似乎无效
	textAlign: 'centrer', //文本对齐方式 ,似乎无效,设置会让文本消失
	labelXOffset: 0, // 水平文本偏移量
	labelYOffset: -30, // 垂直文本偏移量
	padding: [5, 5, 5, 5],
	// 上面为默认配置
	position: [127.40002638117096, 44.034284373652795],
	icon: 'https://webapi.amap.com/images/car.png',
	offset: [-26, -13],
	label: '矢量图标: 旋转不停',
	labelYOffset: -42,
	padding: [5, 5, 5, 5],
	labelBgColor: 'skyblue', // 背景颜色
	angle: -90
})

//旋转不停
setInterval(() => {
	const angle = marker && marker.getAngle() + 90
	marker && marker.setAngle(angle)
}, 1000)
5、marker增加弹跳动画
代码:
//设置弹跳动画
setAnimationDom.onclick = function () {
	marker1.setAnimation()
	marker1.setAnimation('WMAP_ANIMATION_BOUNCE')
	setTimeout(function () {
		marker1.setAnimation('WMAP_ANIMATION_NONE')
	}, 1000)
}
6、 自定义模式下 icon + label对象(在有需求为 显示/隐藏 车牌号时可以使用本实例)
例图:

代码:
const marker1 = new WMap.Marker({
	map: map,
	position: new WMap.LngLat(111.75027560859681, 40.81268047174071),
	icon: onlineImg,
	offset: [-40, -40],
	label: {
		content: buildMarkerContent(),
		offset: [-40, -60]
	},
	extData: {
		lpn: '川A123456789',
		colName: '黄色',
		id: '113123'
	}
})

// 点击车辆显示车牌(核心为 setLabel方法)
marker1.on('click', e => {
  const extData = e.target.getExtentData()
  e.target.setLabel({
    content: buildMarkerContent(extData),
    offset: [-40, -60]
  })
})
7、自定义模式 icon + label对象
例图:

代码:
const marker2 = new WMap.Marker({
	map: map,
	position: new WMap.LngLat(116.12283420234681, 43.93279765924071),
	icon: 'https://webapi.amap.com/images/car.png',
	offset: [-26, -13],
	angle: 180,
	label: {
		content: `<div class='info'> icon +  label 实例化 marker</div>`,
		offset: [-132, -50]
	}
})
8、自定义模式 content + label对象(第一代写法,数据量小的时候可以用,数据量大建议使用常规模式)
例图:

代码:
const marker3 = new WMap.Marker({
	map: map,
	position: new WMap.LngLat(122.14334201484681, 43.51531719049071),
	content: `<img src="https://webapi.amap.com/images/car.png" alt="" style="vertical-align:middle;">`,
	offset: [-40, -40],
	label: {
		content: `<div class='info' style='text-align: right;'>content + label 实例化 marker</div>`,
		offset: [-132, -74]
	}
})
3、MarkerCluster(聚合类)
const markerClusterer = new WMap.MarkerCluster(map, markers)
// 参数详解:
map: Map, // 地图实例对象
markers: Array[Marker] // 覆盖物群体

针对聚合类中的Marker配置
options: {
    zIndex: 3, // 覆盖物的叠加顺序
	noClusterZoom: 18, // 在zoom及以上不聚合
	distance: 40, // 要素将聚集在一起的距离(以像素为单位)
	minDistance: 30, //  簇之间的最小距离(以像素为单位)
	showViewExtent: true, // 只展示可视区域 Marker
	zoomOnClick: true, // 是否点击展开 Cluster
    averageCenter: false, // 聚合点的图标位置是否是所有聚合内点的中心点。默认为否
    styles: Array[clustererStyle] // 自定义1-10 ,11-100,101-1000,10001- 聚合物的样式
}

clustererStyle: {
    url, offset, angle, textColor, textSize, textWeight // 常用的url 就是指各个聚合层级下的显示图片,不设置则使用默认的
}

// 方法详解:
markerClusterer.setZoomOnClick(flag) // flag 为 true, 则点击聚合展开, 默认为false, 点击聚合不展开
markerClusterer.getMaxZoom() // 获取地图设置的最大放大
markerClusterer.getDistance() // 获取聚合的距离
markerClusterer.setDistance(distance: number) // 设置聚合物距离
markerClusterer.getMinDistance() // 获取聚合物的最小间距
markerClusterer.setMinDistance(distance: number) // 设置聚合物的最小间距
markerClusterer.getMarkers() // 获取聚合类的所有基础Marker集合
markerClusterer.setMarkers(markers: Array[Marker]) // 将Marker集合添加到聚合(覆盖性添加Marker)
markerClusterer.add(Marker) // 添加Marker
markerClusterer.remove(Marker) // 删除Marker
markerClusterer.clearMarkers() // 清空 Markers

// 支持事件
['click', 'dblclick', 'contextmenu']
示例:
1、实例化聚合类
例图:

代码:
// 方法一: 初始化聚合类实例时
for (let i = 1; i <= 200; i++) {
	let coordinates = [111.07 + Math.random(), 30.07 + Math.random()]
	let marker = new WMap.Marker({
	    fontColor: '#fff',
        borderColor: '#0000005e', // 边框颜色
        labelBgColor: '#0000005e', // 背景颜色
        offset: [-35, -80],
        labelYOffset: -90,
        padding: [5, 3, 5, 5],
		position: coordinates ,
        icon: 'xxx.jpg',
		offset: [-16, -16],
        label: `${i}`
	})
	markers.push(marker)

	marker.on('click', e => {
		console.log('自定义信息数据', e.target.getExtentData())
	})
}

const markerCluster = new WMap.MarkerCluster(map, marker, {
	noClusterZoom: 18, // 在zoom及以上不聚合
	distance: 40, // 要素将聚集在一起的距离(以像素为单位)
	minDistance: 30, //  簇之间的最小距离(以像素为单位)
	showViewExtent: true, // 只展示可视区域 Marker
	zoomOnClick: true, // 是否点击展开 Cluster
	averageCenter: false // 聚合点的图标位置是否是所有聚合内点的中心点。默认为否
})


markerCluster.on('click', w => {
	console.log(w)
})

// 方法二: 当实例存在时, 想要重置聚合里面所有的Marker
let tmpMarkers = []
for (let i = 1; i <= 200; i++) {
  let coordinates = [120.0 + Math.random(), 30.0 + Math.random()]

  let marker = new WMap.Marker({
    position: coordinates,
    offset: [-30, -20],
    content: buildContent()
  })
  tmpMarkers.push(marker)

  marker.on('click', e => {
    console.log('Markers---click--------', e)
  })
}
markerClusterer.setMarkers(tmpMarkers)
2、聚合的点击
代码:
markerClusterer.on('click', function (ev) {
	console.log('markerClusterer-------')
})
4、VectorGraph (主动绘制图形类)
const graph = new WMap.VectorGraph(map, options = {})

// 参数详解:
map: 地图实例对象
options: { // 样式参数 会影响整个矢量图层(className为'VectorLayer'图层)
    fillColor: 'rgba(37,241,239,0.2)', // 填充颜色
    strokeColor: '#264df6', // 笔触颜色
    strokeWidth: 2, // 笔触宽度
    lineCap: 'round', // 线帽样式 butt、round、 或square
    lineJoin: 'round', // 	线连接样式 bevel、round、 或miter
    imageRadius: 7, // 点样式半径大小
    imageFill: '#264df6', // 点样式填充颜色
}

// 方法详解:
graph.activate(graphName: string) // 激活矢量图绘制(graphName共五种, 分别为Point, Line, Circle, Polygon, Rectangle, 对应画哪种图形)
graph.deactivate() // 失活矢量图绘制(终止绘图)
// option 为专属于该图形的样式, 不会影响到整个图层, extData 为自定义数据
graph.getExtData() // 获取 自定义数据
graph.clearVector() // 清除图层上的数据源(矢量图形)

// 支持事件:
['done']
示例
1、初始化五种图形
例图:

代码:
// 主动绘制
let graph = new WMap.VectorGraph(map)
graph.on("done", (e) => {
  console.log(e, '绘制完')
})
2、删除主动绘制的图形
代码:
let target
// 主动绘制
let graph = new WMap.VectorGraph(map)
graph.on('done', (e) => {
  target = e.target
})

map.remove(target)
5、 GraphEdit (图形编辑类)
const edit = new WMap.GraphEdit(map)

// 参数详解:
map: 地图实例对象

// 方法详解
edit.open() // 开启编辑
edit.close() // 结束编辑

// 事件支持
['modifyend']
示例:
1、图形编辑
例图:

代码:
let startEdit = document.querySelector('#startEdit') // 开始编辑
let endEdit = document.querySelector('#endEdit') // 结束编辑
let edit = null
startEdit.onclick = () => {
  edit = new WMap.GraphEdit(map)
  edit.open()
  edit.on('modifyend', e => {
    console.log(e)
  })
}
endEdit.onclick = () => {
  edit.close()
}
2、删除正在编辑的图形
代码:
let edit = new WMap.GraphEdit(map)
  edit.open()
  edit.on('modifyend', e => {
    target= e.target
  })
// 删除当前主动绘制或者编辑的图形
map.remove(target)
6、Point (图形 点类)
let point = new WMap.Point({
  map: map,
  center: new WMap.LngLat(116.479662,39.996956),
  extData: {'name': '点'}
})

// 左键单击
point.on('click', e => {
  console.log(e.target.getExtData())
})
// 右键单击
point.on('contextmenu', e => {
  console.log(e.target.getExtData())
})
// 左键双击
point.on('dblclick', e => {
  console.log(e.target.getExtData())
})

// 参数详解
map: 直接传入地图实例, 若不填写此参数, 则可以 map.add 进行添加
center: 经纬度位置
extData: 自定义数据

// 方法详解
point.show() // 地图上显示点
point.hide() // 地图上隐藏点
point.getExtData() // 获取自定义数据
7、Line (图形 线类)
let line= new WMap.Line({
  map: map,
  path: [new WMap.LngLat(116.477648,39.997149),new WMap.LngLat(116.480078, 39.996506)],
  extData:{'name': '线'}
})

// 左键单击
line.on('click', e => {
  console.log(e.target.getExtData())
})
// 右键单击
line.on('contextmenu', e => {
  console.log(e.target.getExtData())
})
// 左键双击
line.on('dblclick', e => {
  console.log(e.target.getExtData())
})

// 参数详解
map: 直接传入地图实例, 无不填写此参数, 则可以map.add 进行添加
path: 经纬度数组
extData: 自定义数据

// 方法详解
line.show() // 地图上显示线
line.hide() // 地图上隐藏线
line.getExtData() // 获取自定义数据
line.setPath() // 主动改变线段
8、Circle (图形 圆形类)
const circle = new WMap.Circle({
  map: map,
  center: new WMap.LngLat(116.47614550262452, 39.99763225396728),
  radius: 81.7,
  extData:{'name': '圆'},
  option: { // 自定义样式参数
    fillColor: '#264df6', // 填充颜色
    strokeColor: '#264df6', // 笔触颜色
    strokeWidth: 2, // 笔触宽度
    lineCap: 'round', // 线帽样式 butt、round、 或square
    lineJoin: 'round', // 	线连接样式 bevel、round、 或miter
    imageRadius: 7, // 点样式半径大小
    imageFill: '#264df6' // 点样式填充颜色
  }
})

// 左键单击
circle.on('click', e => {
  console.log(e.target.getExtData())
})
// 右键单击
circle.on('contextmenu', e => {
  console.log(e.target.getExtData())
})
// 左键双击
circle.on('dblclick', e => {
  console.log(e.target.getExtData())
})

// 参数详解:
map: 直接传入地图实例, 无不填写此参数, 则可以map.add 进行添加
center: 经纬度位置
radius: 半径长度
extData: 自定义数据

// 方法详解
circle.show() // 地图上显示圆形
circle.hide() // 地图上隐藏圆形
circle.getExtData() // 获取自定义数据
9、Polygon (图形 多边形类)
const polygon = new WMap.Polygon({
  map: map,
  path: [new WMap.LngLat(116.47699844509125, 39.9982652552948), new WMap.LngLat(116.47721838623048, 39.997278202377316), new WMap.LngLat(116.47869360118867, 39.99738549073791), new WMap.LngLat(116.47857558399201, 39.9979058392868), new WMap.LngLat(116.47837710052491, 39.99842618783569)],
  extData: {'name': '多边形'},
  option: { // 自定义样式参数
    fillColor: '#264df6', // 填充颜色
    strokeColor: '#264df6', // 笔触颜色
    strokeWidth: 2, // 笔触宽度
    lineCap: 'round', // 线帽样式 butt、round、 或square
    lineJoin: 'round', // 	线连接样式 bevel、round、 或miter
    imageRadius: 7, // 点样式半径大小
    imageFill: '#264df6' // 点样式填充颜色
  }
})

// 左键单击
polygon.on('click', e => {
  console.log(e.target.getExtData())
})
// 右键单击
polygon.on('contextmenu', e => {
  console.log(e.target.getExtData())
})
// 左键双击
polygon.on('dblclick', e => {
  console.log(e.target.getExtData())
})

// 参数详解:
map: 直接传入地图实例, 无不填写此参数, 则可以map.add 进行添加
path: 经纬度数组
extData: 自定义数据

// 方法详解
polygon.show() // 地图上显示多边形
polygon.hide() // 地图上隐藏多边形
polygon.getExtData() // 获取自定义数据
10、Rectangle (图形 矩形类)
const rectangle = new WMap.Rectangle({
  map: map,
  path: [new WMap.LngLat(116.48053896099091,39.99640916665649), new WMap.LngLat(116.48225557476044, 39.99715482076263)],
  extData: {'name': '矩形'},
  option: { // 自定义样式参数
    fillColor: '#264df6', // 填充颜色
    strokeColor: '#264df6', // 笔触颜色
    strokeWidth: 2, // 笔触宽度
    lineCap: 'round', // 线帽样式 butt、round、 或square
    lineJoin: 'round', // 	线连接样式 bevel、round、 或miter
    imageRadius: 7, // 点样式半径大小
    imageFill: '#264df6' // 点样式填充颜色
  }
})
// 左键单击
rectangle.on('click', e => {
  console.log(e.target.getExtData())
})
// 右键单击
rectangle.on('contextmenu', e => {
  console.log(e.target.getExtData())
})
// 左键双击
rectangle.on('dblclick', e => {
  console.log(e.target.getExtData())
})

// 参数详解:
map: 直接传入地图实例, 无不填写此参数, 则可以map.add 进行添加
path: 经纬度数组
extData: 自定义数据

// 方法详解
rectangle.show() // 地图上显示多边形
rectangle.hide() // 地图上隐藏多边形
rectangle.getExtData() // 获取自定义数据
11、InfoWindow(信息框类)
// 实例化信息框类有多种方式
// 方式1 常规模式
let Single1 = new WMap.InfoWindow({
	title: '标记点',
	content: '这是一个标记点喔',
	offset: [0, 0],
	width: 200,
	height: 100
})

// 方式2 自定义模式之传入DOM
let Single2 = new WMap.InfoWindow({
    content: document.querySelector('#single'),
	offset: [0, 0],
	width: 200,
	height: 100
})

// 方式3 自定义模式之传入html字符串
let Single = new WMap.InfoWindow({
	content: `<div>123</div>`,
	offset: [0, 0],
	width: 200,
	height: 100
})

// 参数详解: (我是根据传入的content来判断是那种方式的)
content: (string | HTMLDivElement | HtmlString)
title: string = 'JCMap 信息框' // 常规模式下默认标题
offset: Array[number] = [0, 0] // 第二偏移
position: string = 'top-left' // 第一偏移
width = 200 // 默认信息框总宽度 box-sizing: border-box
height = 100 // 默认信息框总高度 box-sizing: border-box

// 支持事件
['click', 'dblclick', 'contextmenu']
示例
1、信息框实例并绑定对应的Marker
1.1、常规信息框
例图:

代码:
let Single = new WMap.InfoWindow({
	title: '标记点',
	content: '这是一个标记点喔',
	offset: [0, 0],
	width: 200,
	height: 100
})
1.2、自定义信息框之dom
例图:

代码:
let Single = new WMap.InfoWindow({
	content: document.querySelector('#single'),
	offset: [0, 0],
	width: 200,
	height: 100
})
1.3、自定义信息框之Html字符串
例图:

代码:
let Single = new WMap.InfoWindow({
	content: `<div>123</div>`,
	offset: [0, 0],
	width: 200,
	height: 100
})
1.4、多个Marker点击,改变信息框显示信息
例图:

代码:
// 无论以哪种方式初始化,setContent会根据你初始化的那种方式来修改content
marker5.on('click', e => {
	Single.open(map, e.target)
	Single.setContent(e.target.getExtentData().name)
    // Single.setContent(document.querySelector('#edit1'))
    // Single.setContent(`<div>Hello World1</div>`)
})

marker6.on('click', e => {
	Single.open(map, e.target)
	Single.setContent(e.target.getExtentData().name)
    // Single.setContent(document.querySelector('#edit2'))
    // Single.setContent(`<div>Hello World2</div>`)
})
12、Polyline(轨迹线类)
我们的轨迹主要针对小车运行时候的轨迹,目前主要分为三类实例
1、历史双轨迹线实例
2、历史单轨迹线实例
3、实时轨迹线实例

每类实例都由Polyline类和Marker类组成

Class Polyline {
  mode: 'all', // 轨迹线模式
  path: [], // 点坐标数组
	zIndex: 2, // 覆盖物的叠加顺序
	showDir: true, // 是否显示白色方向箭头
	strokeOpacity: 0.9, //  线条透明度
	strokeWeight: 10, //  线条宽度
	strokeStyle: 'solid', // 轮廓线样式,实线: solid 虚线:dashed
	strokeDasharray: [], // 轮廓线间隙
	lineCap: 'butt', // 折线两端线帽的绘制样式,默认值为'butt'无头,其他可选值:'round'圆头、'square'方头
	lineJoin: 'round', // 折线拐点的绘制样式,默认值为'round'圆角,其他可选值:'round'圆角、'bevel'斜角
	isOutline: false, // 线条是否带描边,默认false
	borderWeight: 10, // 描边的宽度,默认为1
	outlineColor: '#000000', // 线条描边颜色,此项仅在isOutline为true时有效,默认:#000000
	extData: null, // 自定义信息
    segmentLength: 50, // 对传入路径做分段处理,以防有路径间隔过远,默认为 50 m
    strokeColor?: '#28F', // 线颜色
    activeStrokeColor?: 'green', // 活跃状态时的线条颜色
  segmentLength: 2, // 最小子路径长度
	units: 'meters' // 最小子路径单位
}


Polyline类通用方法

polyline.setPath() // 设置当前路径的坐标集合
polyline.clearHistoryPath() // 清除历史轨迹路径
polyline.clearRealPath() // 清除实时轨迹路径
polyline.getHistoryPath() // 获取历史轨迹路径
polyline.getRealPath() // 获取实时轨迹路径
polyline.setVisible(type: boolean) // 隐藏/显示 历史轨迹线(只适用于有历史轨迹线模式)

Class Marker => 我们文档上面都有Marker覆盖物类的具体讲解,在本轨迹中不再讲解Marker覆盖物类

// 覆盖物和轨迹线结合使用的方法
marker.move(polyline, curPath) // 实时轨迹下的小车开始移动
marker.getIndex() // 历史轨迹下的获取行驶路径原始索引
marker.getMoveIndex() // 历史轨迹下的获取行驶路径虚拟索引
marker.getRatio() // 历史轨迹下的获取小车当前进度
marker.updateMoveDistance(radio: Number) // 历史轨迹下的更新小车当前距离进度(用于拖拽进度条),参数为浮点数,0-1之间
marker.updateMoveSpeed(radio: Number) // 历史轨迹下的更新小车当前行驶速度
marker.moveAlong(path = [], angleFixed = false, speed = 60, lockScope = true) // 历史轨迹下的小车开始行驶动画, 建议默认第四参数以达到更优效果
marker.stopMove() // 历史轨迹下的小车终止行驶操作
marker.resumeMove() // 历史轨迹下的小车继续行驶操作
marker.pauseMove() // 历史轨迹下的小车暂停行驶操作

// 控制当前行驶时是否固定角标
方式1: 初始化时控制
marker.moveAlong 的第二参数,true则固定。默认为不固定
方式2: 动态控制角度 只需控制 e.target.angleFixed 为true或false则可以实现实时控制角度固定
marker1.on('moving', function (e) {
	e.target.angleFixed = angleFixed.checked
})

那如何区分怎么实例自己想要的呢?
我们在 Polyline类实例时可以区分:
有 strokeColor 和 activeStrokeColor 参数,就是历史双轨迹线
有 strokeColor 参数,就是历史单轨迹线
有 activeStrokeColor 参数,就是实时轨迹线


下面我会在各个例子中详解每种的用法及例图
示例
1、历史双轨迹线实例
例图:

代码:
const map = new WMap.Map('map', {
	center: [116.48538303047181, 39.99969219049072],
	zoom: 16,
	minZoom: 3,
	maxZoom: 18
})

const marker = new WMap.Marker({
	map: map,
	position: [116.478935, 39.997761],
	icon: 'https://webapi.amap.com/images/car.png',
	offset: [-26, -13],
	angle: -90
})

const lineArr = [
	[116.478935, 39.997761],// 1
	[116.478939, 39.997825],// 2
	[116.478912, 39.998549],// 3
	[116.478912, 39.998549],
	[116.478998, 39.998555],// 4
	[116.478998, 39.998555],
	[116.479282, 39.99856], // 5
	[116.479658, 39.998528], // 6
	[116.480151, 39.998453],// 7
	[116.480784, 39.998302],// 8
	[116.480784, 39.998302],
	[116.481149, 39.998184],// 9
	[116.481573, 39.997997],// 10
	[116.481863, 39.997846],// 11
	[116.482072, 39.997718],// 12
	[116.482362, 39.997718],// 13
	[116.483633, 39.998935],// 14
	[116.48367, 39.998968],// 15
	[116.484648, 39.999861],// 16
	[116.4889679286499, 40.003822062536884],// 17
	[116.49177741676331, 40.00160192330932],// 18
	[116.48720693260194, 39.9987695105896]// 19
]


const polyline = new WMap.Polyline({
	map,
	path: lineArr,
	showDir: true, // 是否显示箭头
	strokeColor: '#28F', // 线颜色 历史双轨迹线必须
    activeStrokeColor: 'green', // 活跃状态时的线条颜色 历史双轨迹线必须
	strokeWeight: 6, // 线宽
    segmentLength: 2, // 最小子路径长度
	units: 'meters' // 最小子路径单位
})

marker.on('moving', function (e) {
  polyline.setPath(e.passedPath)
	distanceInput && (distanceInput.value = marker.getRatio() * 10)
})

function startAnimation() {
	marker.moveAlong(lineArr, Number(speedInput ? speedInput.value : 100), polyline.get('segmentLength')) // 历史轨迹
}

speedInput &&
	(speedInput.onchange = e => {
		marker.updateMoveSpeed(e.target.value)
	})

distanceInput &&
	(distanceInput.onchange = e => {
		marker.updateMoveDistance(e.target.value / 1000)
        polyline.updatePassedPath(marker.getMoveIndex())
	})

function pauseAnimation() {
	marker.pauseMove()
}

function resumeAnimation() {
	marker.resumeMove()
}

function stopAnimation() {
	startButton.textContent = 'Start Animation'
	marker.stopMove()
}

// 开始动画
startButton.addEventListener('click', function () {
    if (polyline.getVirtuaPath().length) {
		map.panTo(lineArr[0], { duration: 0 })
		startAnimation()
	} else {
		console.warn('虚拟轨迹正在初始化中');
	}
})
// 暂停动画
pauseButton.addEventListener('click', function () {
	pauseAnimation()
})
// 继续动画
resumeButton.addEventListener('click', function () {
	resumeAnimation()
})
// 停止动画
stopButton.addEventListener('click', function () {
	stopAnimation()
})
2、历史单轨迹线实例
例图:

代码:
// 历史单轨迹线和双轨迹线相比,就少了一个 activeStrokeColor 参数,其他都相同,就不重复写了
const polyline = new WMap.Polyline({
	map,
	path: lineArr,
	showDir: true, // 是否显示箭头
	strokeColor: '#28F', // 线颜色 历史单轨迹线必须
	strokeWeight: 6, // 线宽
    segmentLength: 50 // 分段距离 默认为50m
})
3、实时轨迹线实例
例图:

代码:
// 实时轨迹线,就是在定时接收数据时候,在形成当前轨迹,所以参数较少,下面定时器就是模拟接收数据

const polyline = new WMap.Polyline({
	map,
    activeStrokeColor: 'green', // 活跃状态时的线条颜色 实时轨迹线必须
	strokeWeight: 6, // 线宽
})

lineArr.map((item,i) => {
  setTimeout(() => {
    marker.move(polyline, item)
  }, i * 1000)
})
13、ContextMenu(右键菜单类)
// 右键菜单类实例
const contextMenu = new WMap.ContextMenu()

// 默认属性
this.defaultMenuList = [ // 默认菜单栏
  {
    title: '放大一级',
    callBack: () => {
      this.map.setZoomIn()
    }
  },
  {
    title: '缩小一级',
    callBack: () => {
      this.map.setZoomOut()
    }
  }
]

// 方法详解:
// 添加子菜单
contextMenu.addMenu({
    title: string // 新增子菜单标题
    callBack: Function // 点击子菜单后回调函数
})

// 移除子菜单
contextMenu.removeMenu(title: string) // 移除子菜单标题

// 显示右键菜单栏
contextMenu.open(map: Map, coordinate: Array[lng: number, lat: number]) // map为地图实例对象, coordinate为坐标点
示例:
1、添加子菜单
例图:

代码:
let contextMenuPositon = []
map.on('contextmenu', e => {
	contextMenu.open(map, e.coordinate)
	contextMenuPositon = e.coordinate
})

contextMenu.addMenu({
	title: '添加标点',
	callBack: () => {
		const marker = new WMap.Marker({
			map,
			position: contextMenuPositon,
			content: buildContent()
		})

		marker.setAnimation('WMAP_ANIMATION_BOUNCE')
		window.animationMarkerTimer = setTimeout(function () {
			marker.setAnimation('WMAP_ANIMATION_NONE')
		}, 1000)
	}
})
2、移除子菜单
例图:

代码:
contextMenu.removeMenu('放大一级')14、Tool(工具类)
let tools = new WMap.Tool(map, {
    style: 样式,
    unit: 进制单位(km | m)
})

Tool类参数:
    map // 地图实例
    style // 样式,如果不设置,将会默认使用通用样式
    unit // 进制单位(km | m) ,在测量长度或面积时,返回的结果以km/m显示,默认为km

Tool类方法:
    tools.setStyle() // 设置显示样式
    tools.getStyle() // 获取显示样式
    tools.close() // 停止工具类使用
    tools.distance() // 开始测量距离
    tools.area() // 开始测量面积
    tools.remove(featrue) // 删除对应的矢量图形,feature为下面done事件返回的feature

// 监听工具类完成返回结果
tools.on('done', e => {
  console.log(e)
  feature = e.feature
})
1、开始测量距离或面积
例图:

代码:
tools.distance() // 测量距离
tools.area() // 测量面积


 454
454

 被折叠的 条评论
为什么被折叠?
被折叠的 条评论
为什么被折叠?
 到【灌水乐园】发言


