


一:思路
绘制柱状图要实现的效果如下:
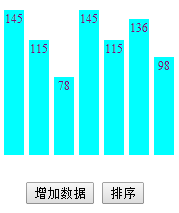
由图可知,绘制该柱状图总体上需要以下几个步骤:
(1)需要一个svg来承载长方形和文本。
(2)绘制长方形和文本。
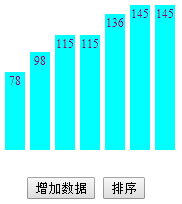
(3)添加实现排序和增加数据这两个按钮并实现相应的功能。
二:代码实现
<!DOCTYPE html>
<html>
<head>
<meta charset="UTF-8">
<title></title>
<script src="d3.js"></script>
</head>
<body>
<script>
//数据
dataset=[145,115,78,145,115,136,98];
//画布数据
width=300;
height=300;
//柱状图数据
padding={left:20,right:20,top:20,bottom:20};
rectTotal=25;
rectWidth=20;
//创建画布
svg=d3.select("body").append("svg")
.attr("width",width)
.attr("height",height);
//绘制图形
function draw(){
/*绑定数据并绘制柱状图*/
var rectUpdate=svg.selectAll("rect").data(dataset);
//rect update
rectUpdate.attr("x",function(d,i){return padding.left+i*rectTotal;})
.attr("y",function(d){return height-padding.top-d;})
.attr("width",rectWidth)
.attr("height",function(d){return d;})
.attr("fill","cyan");
//rect enter
var rectEnter=rectUpdate.enter().append("rect")
.attr("x",function(d,i){return padding.left+i*rectTotal;})
.attr("y",function(d){return height-padding.top-d;})
.attr("width",rectWidth)
.attr("height",function(d){return d;})
.attr("fill","cyan");
//rect exit
var rectExit=rectUpdate.exit().remove();
/*绑定数据并绘制文本*/
var textUpdate=svg.selectAll("text").data(dataset);
//text update
textUpdate.attr("x",function(d,i){return padding.left+i*rectTotal;})
.attr("y",function(d){return height-padding.top-d;})
.attr("dx",rectWidth/2)
.attr("dy","1em")
.attr("text-anchor","middle")
.attr("fill","purple")
.attr("font-size","13px")
.text(function(d){return d;});
//text enter
var textEnter=textUpdate.enter().append("text")
.attr("x",function(d,i){return padding.left+i*rectTotal;})
.attr("y",function(d){return height-padding.top-d;})
.attr("dx",rectWidth/2)
.attr("dy","1em")
.attr("text-anchor","middle")
.attr("fill","purple")
.attr("font-size","13px")
.text(function(d){return d;});
//text exit
var exit=textUpdate.exit().remove();
}
//首次展示柱状图
draw();
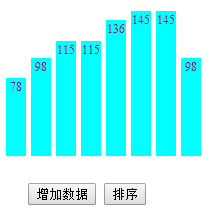
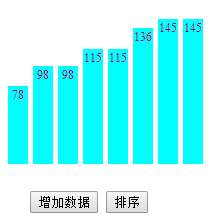
//增加数据
function DataAdd(){
var num=Math.round(Math.random()*200);
dataset.push(num);
draw();
}
//排序
function DataSort(){
dataset.sort(d3.ascending);
draw();
}
</script>
</body>
<br>
<button type="button" onclick="DataAdd()">增加数据</button>
<button type="button" onclick="DataSort()">排序</button>
</html>三:总结
1.绘制柱状图和文本的关键在于参数的设置。
rect的参数主要有 width宽度,height高度,x矩形左上角的横坐标(向右为正),y矩形左上角的纵坐标(向下为正),fill填充颜色。
text的主要参数有 x文本左上角的横坐标(向右为正),y文本左上角的纵坐标(向下为正),dx水平方向的长度(向右为正),dy竖直方向的长度(向下为正),其中1em代表一行,text-anchor内容在文本当中的位置,text文本内容,fill填充颜色,font-size字体大小。
2.对于初学者,有一个重要点需要特别注意,即在增加数据时绘制矩形的时候。第一次绘制柱状图,在第一次绑定时,update里没有任何数据,所有的数据都在enter里面。之后再绑定的时候,之前加入的数据此时全部在update里面,之后增加的数据则在enter里。
3.填增数据时,除了以上方法外,也有一种更简单粗暴的方法,即对之前的图形全部删除重新绘制,代码如下,
function draw(){
				svg.selectAll("rect").remove();
				svg.selectAll("text").remove();
				var rects=svg.selectAll("rect").data(dataset).enter().append("rect")
						.attr("x",function(d,i){
							return padding.left+rectTotal*i;
						})
						.attr("y",function(d){
							return height-padding.top-d;
						})
						.attr("width",rectWidth)
						.attr("height",function(d){return d;})
						.attr("fill","cyan");
				var texts=svg.selectAll("text").data(dataset).enter().append("text")
						.attr("x",function(d,i){
							return padding.left+rectTotal*i;
						})
						.attr("y",function(d){
							return height-padding.top-d;
						})
						.attr("dx",rectWidth/2)
						.attr("dy","1em")
						.attr("fill","purple")
						.attr("text-anchor","middle")
						.text(function(d){return d;});
			}
4.绘制文本时,比较美观的做法是让文本居于矩形中间,若text的x和y位置相同,此时需要设置dx和dy属性,此时dx设置为矩形宽度的一半即可,dy设置为"1em",表示占一行。
5.button标签,type表示按钮类别,onclick表示点击按钮触发的事件。


 347
347


 被折叠的 条评论
为什么被折叠?
被折叠的 条评论
为什么被折叠?
 到【灌水乐园】发言


