


Python 数据分析初探项目 基于 Python 数据可视化的网易云音乐歌单分析系统 大学编程作业(TUST 天津科技大学 2022 年)
- Python 数据分析初探项目 基于 Python 数据可视化的网易云音乐歌单分析系统 大学编程作业(TUST 天津科技大学 2022 年)
- Python 数据分析初探项目 基于 Python 数据可视化的网易云音乐歌单分析系统
- 一、项目简介
- 二、项目设计流程图
- (八)网易云音乐欧美歌单标签图
- 三、项目实现代码
- (一)netease_cloud_music_data_analysis.py
- (二)music_index.py
- (三)music_detail.py
- (四)top_10_song.py
- (五)top_10_ea_song_playlists.py
- (六)top_10_of_ea_song_collection.py
- (七)top_10_of_ea_song_comment.py
- (八)top_10_ea_song_collection_distribution.py
- (九)top_10_ea_song_playlists_distribution.py
- (十)label_ea_song.py
- (十一)music_wordcloud.py
- 四、项目分析结果
一、项目简介
本基于 Python 数据可视化的网易云音乐歌单分析系统,我使用了 Python 丰富的第三方开源模块,如 numpy, pandas, matplotlib, time, requests, squarify, jieba, wordcloud, bs4 等来制作,实现了对网易云音乐歌单数据的获取,对歌单数据进行可视化分析,得出歌单的评论、收藏、播放、贡献、分布的数量图以及词云,并提出歌单优化的建议。通过这次 Python 数据分析初探项目的实践,我巩固了 Python 的语法知识,熟练应用了各个第三方开源模块,为之后的 Python 数据分析学习打下基础。
这个项目是我大三写的,现在回顾已经非常粗糙,分享出来一方面希望可以帮助初学者,另一方面希望能让同学们可以从目前大学中普遍毫无价值的形式主义作业中解脱出来,更加高效地学习优质计算机知识和主流编程技术,一起发扬开源精神,感受互联网技术的美好愿景。
二、交流学习
互联网开源精神需要大家一起互相交流学习,互相支持奉献。欢迎大家与我友好交流。
加我 QQ 好友获取所有项目源码和项目文档,感谢大家的支持!
Python 数据分析初探项目 基于 Python 数据可视化的网易云音乐歌单分析系统
一、项目简介
(一)项目背景
随着音乐软件的普及,海量的相关数据被创造。在大数据的时代,任何大量的数据一旦被利用起来,将会产生巨大的价值。利用 Python 分析歌曲的相关数据来挖掘客户的需求并更进一步的扩大用户量的例子比比皆是。
考虑到现实的可操作性以及 Python 在数据分析和交互、探索性计算以及数据可视化等方面都有非常成熟的库。且经过小组测试可行性,决定利用 Python 对音乐软件歌单进行分析。
(二)项目过程
此次项目利用 Python 对网易云音乐歌单数据的获取,对歌单数据进行可视化分析。得出歌单的评论、收藏、播放、贡献、分布的数量图以及词云,并提出歌单优化的建议。
项目利用爬虫对数据获取,后对其进行数据清洗,最终进行数据可视化。在分析过程中使用 numpy, pandas, matplotlib, time, requests, squarify, jieba, wordcloud, bs4 第三方模块,最后以柱状图,词云图 以及标签图来展示歌曲收藏量,播放量等相关分析结果并结合相关数据优化歌单播放量。
最后我们实现了项目,并对项目进行了测试。
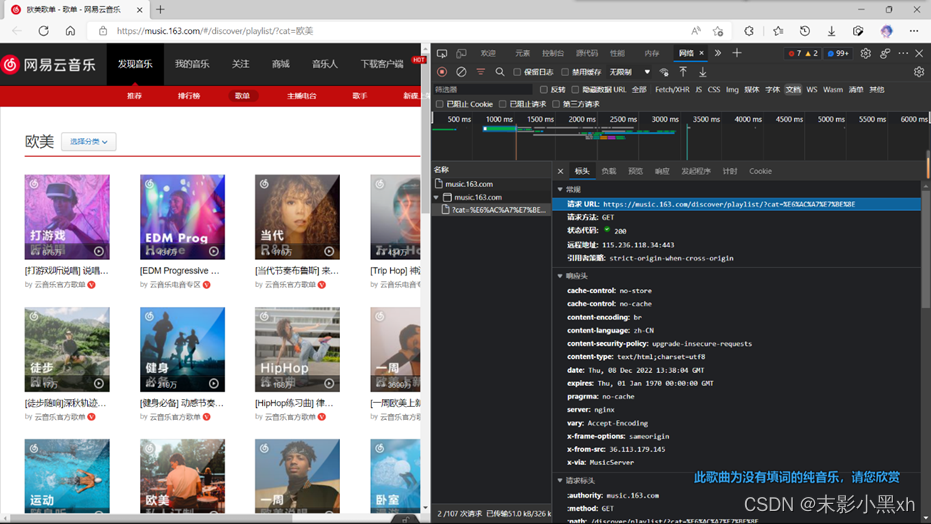
图 1 歌单索引网页调试分析
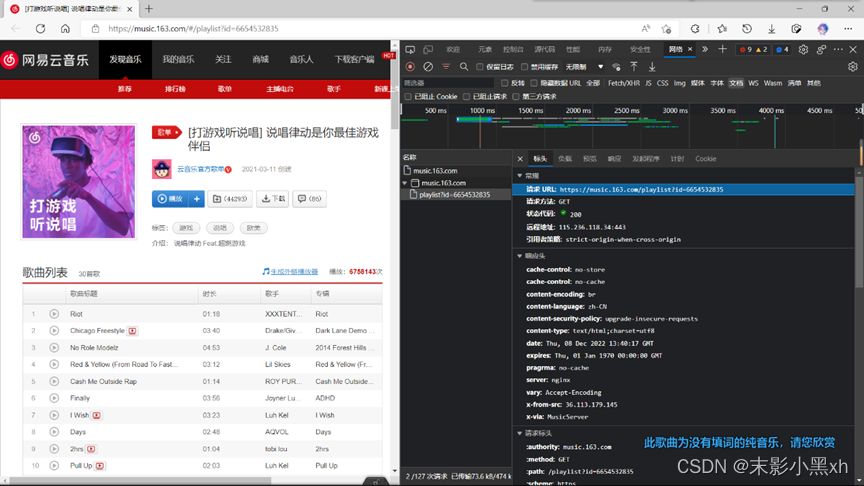
图 2 歌单详情网页调试分析
二、项目设计流程图
(一)基于 Python 数据可视化的网易云音乐歌单分析系统的整体架构
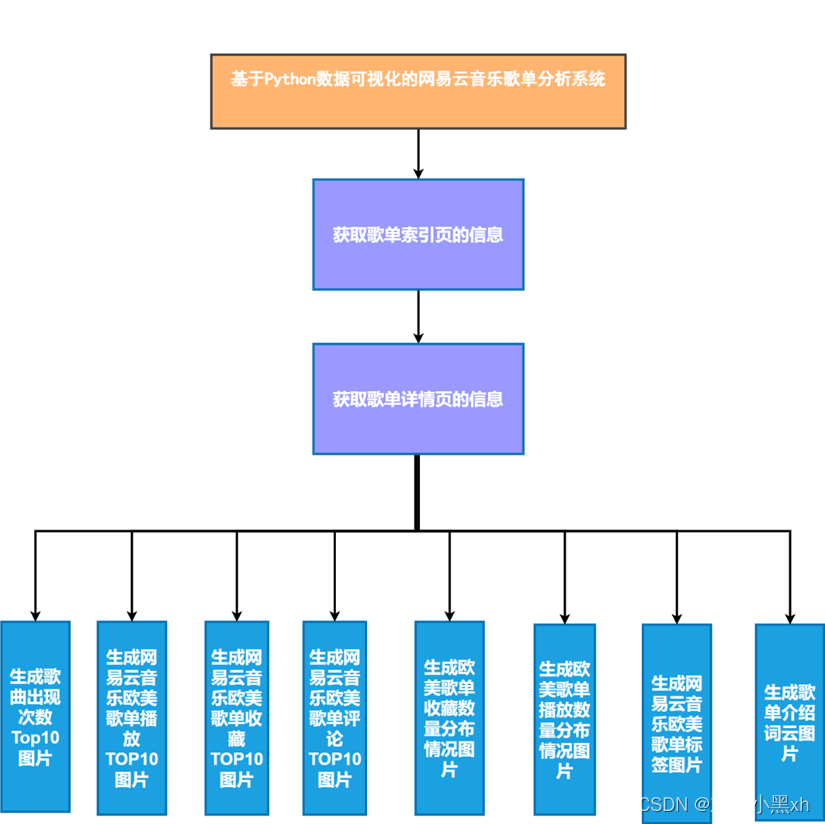
图 3 基于 Python 数据可视化的网易云音乐歌单分析系统的整体架构图
(二)获取歌单索引页的信息
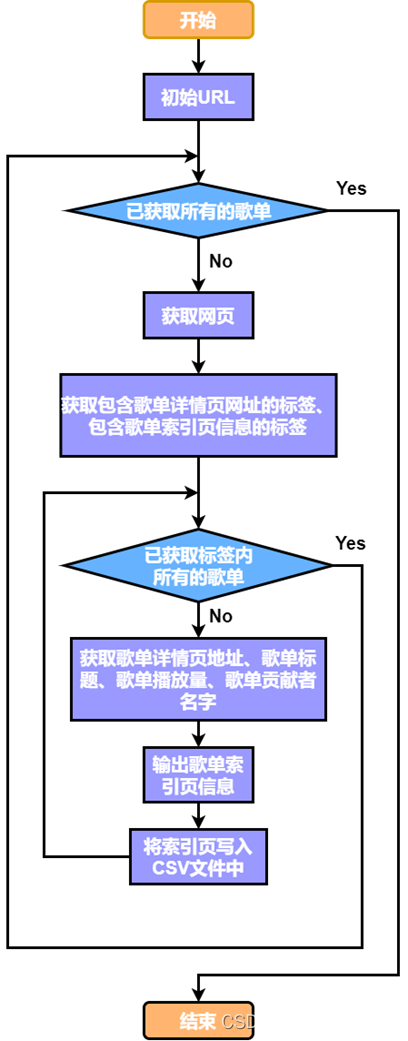
图 4 获取歌单索引页的信息的流程图
(三)获取歌单详情页的信息
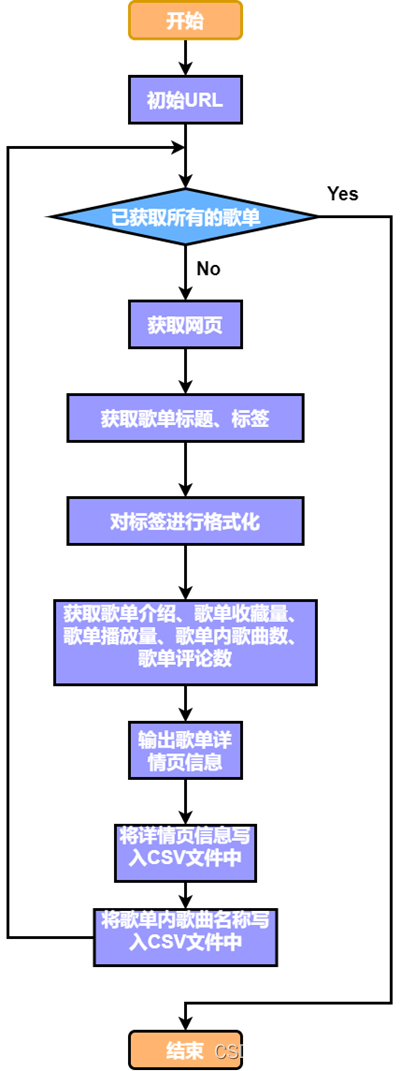
图 5 获取歌单详情页的信息的流程图
(四)歌曲出现次数 TOP10
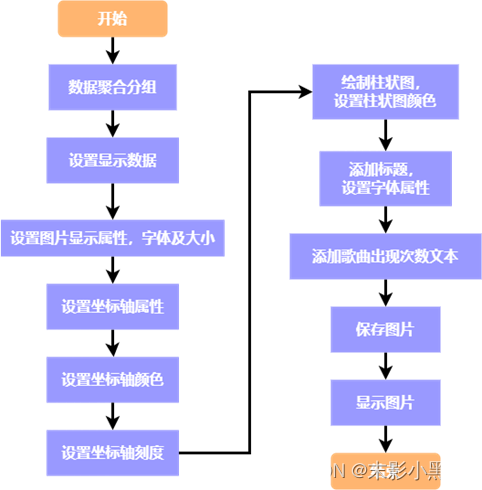
图 6 歌曲出现次数 TOP10 的流程图
(五)网易云音乐欧美歌单播放 TOP10
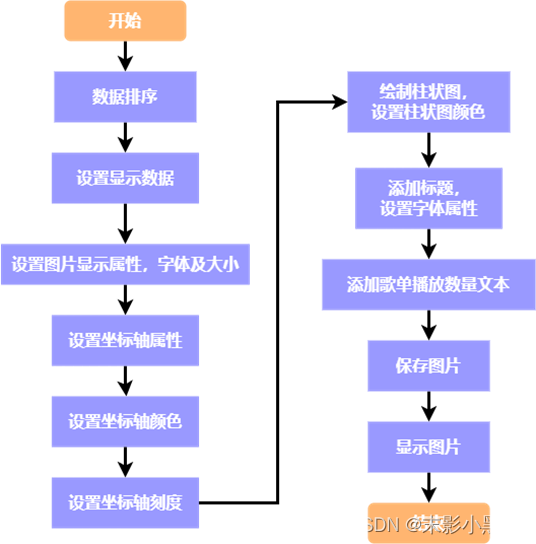
图 7 网易云音乐欧美歌单播放 TOP10 的流程图
(六)网易云音乐欧美歌单评论 TOP10
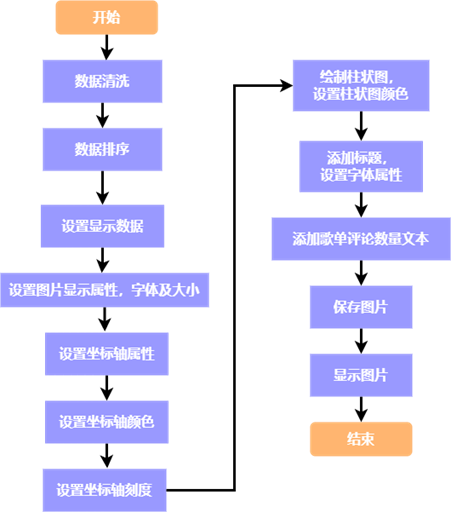
图 8 网易云音乐欧美歌单评论 TOP10 的流程图
(七)欧美歌单播放数量分布情况
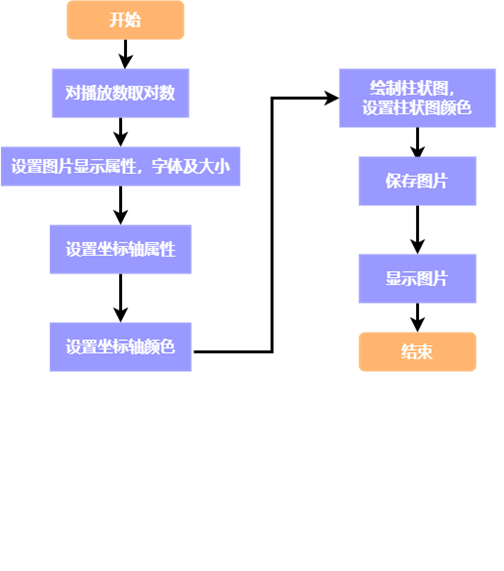
图 9 欧美歌单播放数量分布情况的流程图
(八)网易云音乐欧美歌单标签图
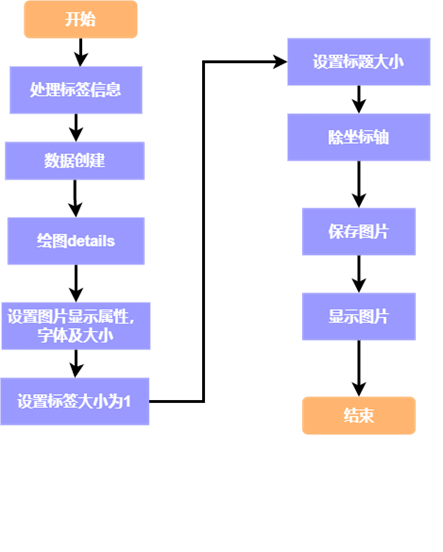
图 10 网易云音乐欧美歌单标签图的流程图
(九)歌单介绍词云图
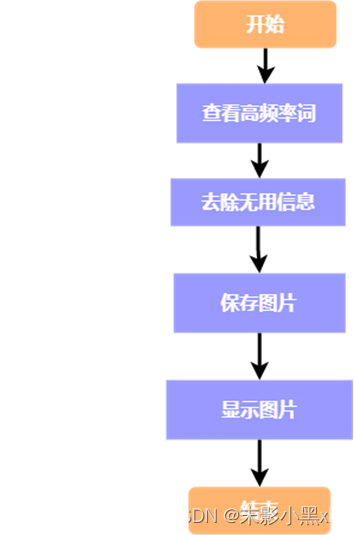
图 11 歌单介绍词云图的流程图
三、项目实现代码
(一)netease_cloud_music_data_analysis.py
import os

from music_index import get_data_of_music_list_index_page
from music_detail import get_data_of_music_list_detail_page
from top_10_song import data_visualization_of_top_10_song
from top_10_song_up import data_visualization_of_top_10_song_up
from top_10_ea_song_playlists import data_visualization_of_top_10_ea_song_playlists
from top_10_of_ea_song_collection import data_visualization_of_top_10_of_ea_song_collection
from top_10_of_ea_song_comment import data_visualization_of_top_10_of_ea_song_comment
from top_10_ea_song_collection_distribution import data_visualization_of_top_10_ea_song_collection_distribution
from top_10_ea_song_playlists_distribution import data_visualization_of_top_10_ea_song_playlists_distribution
from label_ea_song import data_visualization_of_label_ea_song
from music_wordcloud import data_visualization_of_music_wordcloud


def menu():
    """网易云音乐数据分析系统菜单"""
    print("欢迎使用网易云音乐数据分析系统!(^▽^ )")
    print("---------------------------------------------")
    print("")
    print("        【网易云音乐数据分析系统】 ")
    print("")
    print("        A.获取歌单索引页的信息")
    print("        B.获取歌单详情页的信息")
    print("        C.生成歌曲出现次数 Top10 图片")
    print("        D.生成歌单贡献 UP 主 TOP10 图片")
    print("        E.生成网易云音乐欧美歌单播放 TOP10 图片")
    print("        F.生成网易云音乐欧美歌单收藏 TOP10 图片")
    print("        G.生成网易云音乐欧美歌单评论 TOP10 图片")
    print("        H.生成欧美歌单收藏数量分布情况图片")
    print("        I.生成欧美歌单播放数量分布情况图片")
    print("        J.生成网易云音乐欧美歌单标签图片")
    print("        K.生成歌单介绍词云图片")
    print("")
    print("---------------------------------------------")
    print("请输入您要进行的操作(输入 quit 退出!):")


def key_down():
    """网易云音乐数据分析系统功能交互"""
    option = input()

    if option == 'quit' or option == 'QUIT':
        print("已退出!\n\n")
        input()

        exit(0)
    elif option == 'a' or option == 'A':
        # 获取歌单索引页的信息
        get_data_of_music_list_index_page()

        return
    elif option == 'b' or option == 'B':
        # 获取歌单详情页的信息
        get_data_of_music_list_detail_page()

        return
    elif option == 'c' or option == 'C':
        # 生成歌曲出现次数 Top10 图片
        data_visualization_of_top_10_song()

        return
    elif option == 'd' or option == 'D':
        # 生成歌单贡献 UP 主 TOP10 图片
        data_visualization_of_top_10_song_up()

        return
    elif option == 'e' or option == 'E':
        # 生成网易云音乐欧美歌单播放 TOP10 图片
        data_visualization_of_top_10_ea_song_playlists()

        return
    elif option == 'f' or option == 'F':
        # 生成网易云音乐欧美歌单收藏 TOP10 图片
        data_visualization_of_top_10_of_ea_song_collection()

        return
    elif option == 'g' or option == 'G':
        # 生成网易云音乐欧美歌单评论 TOP10 图片
        data_visualization_of_top_10_of_ea_song_comment()

        return
    elif option == 'h' or option == 'H':
        # 生成欧美歌单收藏数量分布情况图片
        data_visualization_of_top_10_ea_song_collection_distribution()

        return
    elif option == 'i' or option == 'I':
        # 生成欧美歌单播放数量分布情况图片
        data_visualization_of_top_10_ea_song_playlists_distribution()

        return
    elif option == 'j' or option == 'J':
        # 生成网易云音乐欧美歌单标签图片
        data_visualization_of_label_ea_song()

        return
    elif option == 'k' or option == 'K':
        # 生成歌单介绍词云图片
        data_visualization_of_music_wordcloud()

        return
    else:
        print("选择错误,请重新输入!\n\n")
        input()

        return


if __name__ == '__main__':
    """运行界面及功能代码"""
    while True:
        menu()
        key_down()

        # 清屏
        os.system('cls')
(二)music_index.py
"""数据获取,获取歌单索引页的信息"""
from bs4 import BeautifulSoup
import requests
import time


def get_data_of_music_list_index_page():
    """获取歌单索引页的信息"""
    headers = {
        'User-Agent': 'Mozilla/5.0 (Windows NT 6.1; WOW64) AppleWebKit/537.36 (KHTML, like Gecko) '
                      'Chrome/63.0.3239.132 Safari/537.36 '
    }

    print("正在获取歌单索引页的信息...")

    # 输出进度条
    t = 60
    start = time.perf_counter()

    for i in range(t + 1):
        finsh = "▓" * i
        need_do = "-" * (t - i)
        progress = (i / t) * 100
        dur = time.perf_counter() - start

        print("\r{:^3.0f}%[{}->{}]{:.2f}s".format(progress, finsh, need_do, dur), end="")

        time.sleep(0.02)

    for i in range(0, 1330, 35):
        # print('\r', i, end='', flush=True)

        time.sleep(2)

        url = 'https://music.163.com/discover/playlist/?cat=欧美&order=hot&limit=35&offset=' + str(i)
        response = requests.get(url=url, headers=headers)
        html = response.text
        soup = BeautifulSoup(html, 'html.parser')

        # 获取包含歌单详情页网址的标签
        ids = soup.select('.dec a')

        # 获取包含歌单索引页信息的标签
        lis = soup.select('#m-pl-container li')
        # print('\r', len(lis), end='', flush=True)

        for j in range(len(lis)):
            # 获取歌单详情页地址
            url = ids[j]['href']

            # 获取歌单标题,替换英文分割符
            title = ids[j]['title'].replace(',', ',')

            # 获取歌单播放量
            play = lis[j].select('.nb')[0].get_text()

            # 获取歌单贡献者名字
            user = lis[j].select('p')[1].select('a')[0].get_text()

            # 输出歌单索引页信息
            print('\r', url, title, play, user, end='', flush=True)

            # 将索引页写入CSV文件中
            with open('./music_data/music_list.csv', 'a+', encoding='utf-8-sig') as f:
                f.write(url + ',' + title + ',' + play + ',' + user + '\n')

    print("\n已获取歌单索引页的信息,保存至 music_data/music_list.csv")
(三)music_detail.py
"""数据获取,获取歌单详情页的信息"""
from bs4 import BeautifulSoup
import pandas as pd
import requests
import time


def get_data_of_music_list_detail_page():
    """获取歌单详情页的信息"""
    df = pd.read_csv('./music_data/music_list.csv', header=None, on_bad_lines=None, names=['url', 'title', 'play',
                                                                                           'user'])

    headers = {
        'User-Agent': 'Mozilla/5.0 (Windows NT 6.1; WOW64) AppleWebKit/537.36 (KHTML, like Gecko) '
                      'Chrome/63.0.3239.132 Safari/537.36 '
    }

    print("正在获取歌单详情页的信息...")

    # 输出进度条
    t = 60
    start = time.perf_counter()

    for i in range(t + 1):
        finsh = "▓" * i
        need_do = "-" * (t - i)
        progress = (i / t) * 100
        dur = time.perf_counter() - start

        print("\r{:^3.0f}%[{}->{}]{:.2f}s".format(progress, finsh, need_do, dur), end="")

        time.sleep(0.02)

    for i in df['url']:
        time.sleep(2)

        url = 'https://music.163.com' + i
        response = requests.get(url=url, headers=headers)
        html = response.text
        soup = BeautifulSoup(html, 'html.parser')

        # 获取歌单标题
        title = soup.select('h2')[0].get_text().replace(',', ',')

        # 获取标签
        tags = []
        tags_message = soup.select('.u-tag i')

        for p in tags_message:
            tags.append(p.get_text())

        # 对标签进行格式化
        if len(tags) > 1:
            tag = '-'.join(tags)
        else:
            tag = tags[0]

        # 获取歌单介绍
        if soup.select('#album-desc-more'):
            text = soup.select('#album-desc-more')[0].get_text().replace('\n', '').replace(',', ',')
        else:
            text = '无'

        # 获取歌单收藏量
        collection = soup.select('#content-operation i')[1].get_text().replace('(', '').replace(')', '')

        # 歌单播放量
        play = soup.select('.s-fc6')[0].get_text()

        # 歌单内歌曲数
        songs = soup.select('#playlist-track-count')[0].get_text()

        # 歌单评论数
        comments = soup.select('#cnt_comment_count')[0].get_text()

        # 输出歌单详情页信息
        print('\r', title, tag, text, collection, play, songs, comments, end='', flush=True)

        # 将详情页信息写入CSV文件中
        with open('./music_data/music_detail.csv', 'a+', encoding='utf-8-sig') as f:
            f.write(title + ',' + tag + ',' + text + ',' + collection + ',' + play + ',' + songs + ',' + comments +
                    '\n')

        # 获取歌单内歌曲名称
        li = soup.select('.f-hide li a')

        for j in li:
            with open('./music_data/music_name.csv', 'a+', encoding='utf-8-sig') as f:
                f.write(j.get_text() + '\n')

print("\n已获取歌单详情页的信息,保存至 music_data/music_name.csv")
(四)top_10_song.py
"""数据可视化,歌曲出现次数 Top10"""
import pandas as pd
import matplotlib.pyplot as plt
import time


def data_visualization_of_top_10_song():
    """歌曲出现次数 Top10"""
    df = pd.read_csv('./music_data/music_detail.csv', header=None, names=['title'], encoding='utf-8-sig')

    print("正在生成歌曲出现次数 Top10 图片...")

    # 输出进度条
    t = 60
    start = time.perf_counter()

    for i in range(t + 1):
        finsh = "▓" * i
        need_do = "-" * (t - i)
        progress = (i / t) * 100
        dur = time.perf_counter() - start

        print("\r{:^3.0f}%[{}->{}]{:.2f}s".format(progress, finsh, need_do, dur), end="")

        time.sleep(0.02)

    # 数据聚合分组
    place_message = df.groupby(['title'])
    place_com = place_message['title'].agg(['count'])
    place_com.reset_index(inplace=True)
    place_com_last = place_com.sort_index()
    dom = place_com_last.sort_values('count', ascending=False)[0:10]

    # 设置显示数据
    names = [i for i in dom.title]
    names.reverse()
    nums = [i for i in dom['count']]
    nums.reverse()
    data = pd.Series(nums, index=names)

    # 设置图片显示属性,字体及大小
    plt.rcParams['font.sans-serif'] = ['Microsoft YaHei']
    plt.rcParams['font.size'] = 10
    plt.rcParams['axes.unicode_minus'] = False

    # 设置图片显示属性
    plt.figure(figsize=(16, 8), dpi=80)
    ax = plt.subplot(1, 1, 1)
    ax.patch.set_color('white')

    # 设置坐标轴属性
    lines = plt.gca()

    # 设置坐标轴颜色
    lines.spines['right'].set_color('none')
    lines.spines['top'].set_color('none')
    lines.spines['left'].set_color((64/255, 64/255, 64/255))
    lines.spines['bottom'].set_color((64/255, 64/255, 64/255))

    # 设置坐标轴刻度
    lines.xaxis.set_ticks_position('none')
    lines.yaxis.set_ticks_position('none')

    # 绘制柱状图,设置柱状图颜色
    data.plot.barh(ax=ax, width=0.7, alpha=0.7, color=(16/255, 152/255, 168/255))

    # 添加标题,设置字体大小
    ax.set_title('网易云音乐欧美歌单歌曲 TOP10', fontsize=18, fontweight='light')

    # 添加歌曲出现次数文本
    for x, y in enumerate(data.values):
        plt.text(y+3.5, x-0.12, '%s' % y, ha='center')

    # 保存图片
    plt.savefig('./music_image/top_10_song.png', dpi=None)

    # 显示图片
    plt.show()

print("\n已生成歌曲出现次数 Top10 图片,保存至 music_image/top_10_song.png")
(五)top_10_ea_song_playlists.py
"""数据可视化,网易云音乐欧美歌单播放 TOP10"""
import pandas as pd
import matplotlib.pyplot as plt
import time


def data_visualization_of_top_10_ea_song_playlists():
    """网易云音乐欧美歌单播放 TOP10"""
    df = pd.read_csv('./music_data/music_detail.csv', header=None)
    df['play'] = df[4]

    print("正在生成网易云音乐欧美歌单播放 TOP10 图片...")

    # 输出进度条
    t = 60
    start = time.perf_counter()

    for i in range(t + 1):
        finsh = "▓" * i
        need_do = "-" * (t - i)
        progress = (i / t) * 100
        dur = time.perf_counter() - start

        print("\r{:^3.0f}%[{}->{}]{:.2f}s".format(progress, finsh, need_do, dur), end="")

        time.sleep(0.02)

    # 数据排序
    names = df.sort_values(by='play', ascending=False)[0][:10]
    plays = df.sort_values(by='play', ascending=False)['play'][:10]

    # 设置显示数据
    names = [i for i in names]
    names.reverse()
    plays = [i for i in plays]
    plays.reverse()
    data = pd.Series(plays, index=names)

    # 设置图片显示属性,字体及大小
    plt.rcParams['font.sans-serif'] = ['Microsoft YaHei']
    plt.rcParams['font.size'] = 8
    plt.rcParams['axes.unicode_minus'] = False

    # 设置图片显示属性
    plt.figure(figsize=(16, 8), dpi=80)
    ax = plt.subplot(1, 1, 1)
    ax.patch.set_color('white')

    # 设置坐标轴属性
    lines = plt.gca()

    # 设置坐标轴颜色
    lines.spines['right'].set_color('none')
    lines.spines['top'].set_color('none')
    lines.spines['left'].set_color((64/255, 64/255, 64/255))
    lines.spines['bottom'].set_color((64/255, 64/255, 64/255))

    # 设置坐标轴刻度
    lines.xaxis.set_ticks_position('none')
    lines.yaxis.set_ticks_position('none')

    # 绘制柱状图,设置柱状图颜色
    data.plot.barh(ax=ax, width=0.7, alpha=0.7, color=(136/255, 43/255, 48/255))

    # 添加标题,设置字体属性
    ax.set_title('网易云音乐欧美歌单播放 TOP10', fontsize=18, fontweight='light')

    # 添加歌单收藏数量文本
    for x, y in enumerate(data.values):
        num = str(int(y / 10000))
        plt.text(y+1800000, x-0.08, '%s' % (num + '万'), ha='center')

    # 保存图片
    plt.savefig('./music_image/top_10_ea_song_playlists.png', dpi=None)

    # 显示图片
    plt.show()

print("\n已生成网易云音乐欧美歌单播放 TOP10 图片,保存至 music_image/top_10_ea_song_playlists.png")
(六)top_10_of_ea_song_collection.py
"""数据可视化,网易云音乐欧美歌单收藏 TOP10"""
import pandas as pd
import matplotlib.pyplot as plt
import time


def data_visualization_of_top_10_of_ea_song_collection():
    """网易云音乐欧美歌单收藏 TOP10"""
    df = pd.read_csv('./music_data/music_detail.csv', header=None)

    print("正在生成网易云音乐欧美歌单收藏 TOP10 图片...")

    # 输出进度条
    t = 60
    start = time.perf_counter()

    for i in range(t + 1):
        finsh = "▓" * i
        need_do = "-" * (t - i)
        progress = (i / t) * 100
        dur = time.perf_counter() - start

        print("\r{:^3.0f}%[{}->{}]{:.2f}s".format(progress,
              finsh, need_do, dur), end="")

        time.sleep(0.02)

    # 数据清洗
    dom = []
    for i in df[3]:
        dom.append(int(i.replace('万', '0000')))

    df['collection'] = dom

    # 数据排序
    names = df.sort_values(by='collection', ascending=False)[0][:10]
    collections = df.sort_values(by='collection', ascending=False)[
        'collection'][:10]

    # 设置显示数据
    names = [i for i in names]
    names.reverse()
    collections = [i for i in collections]
    collections.reverse()
    data = pd.Series(collections, index=names)

    # 设置图片显示属性,字体及大小
    plt.rcParams['font.sans-serif'] = ['Microsoft YaHei']
    plt.rcParams['font.size'] = 8
    plt.rcParams['axes.unicode_minus'] = False

    # 设置图片显示属性
    plt.figure(figsize=(16, 8), dpi=80)
    ax = plt.subplot(1, 1, 1)
    ax.patch.set_color('white')

    # 设置坐标轴属性
    lines = plt.gca()

    # 设置坐标轴颜色
    lines.spines['right'].set_color('none')
    lines.spines['top'].set_color('none')
    lines.spines['left'].set_color((64/255, 64/255, 64/255))
    lines.spines['bottom'].set_color((64/255, 64/255, 64/255))

    # 设置坐标轴刻度
    lines.xaxis.set_ticks_position('none')
    lines.yaxis.set_ticks_position('none')

    # 绘制柱状图,设置柱状图颜色
    data.plot.barh(ax=ax, width=0.7, alpha=0.7, color=(8/255, 88/255, 121/255))

    # 添加标题,设置字体属性
    ax.set_title('网易云音乐欧美歌单收藏 TOP10', fontsize=18, fontweight='light')

    # 添加歌单收藏数量文本
    for x, y in enumerate(data.values):
        num = str(y/10000)
        plt.text(y+20000, x-0.08, '%s' % (num + '万'), ha='center')

    # 保存图片
    plt.savefig('./music_image/top_10_of_ea_song_collection.png', dpi=None)

    # 显示图片
    plt.show()

print("\n已生成网易云音乐欧美歌单收藏 TOP10 图片,保存至 music_image/top_10_of_ea_song_collection.png")
(七)top_10_of_ea_song_comment.py
"""数据可视化,网易云音乐欧美歌单评论 TOP10"""
import pandas as pd
import matplotlib.pyplot as plt
import time


def data_visualization_of_top_10_of_ea_song_comment():
    """网易云音乐欧美歌单评论 TOP10"""
    df = pd.read_csv('./music_data/music_detail.csv', header=None)

    print("正在生成网易云音乐欧美歌单评论 TOP10 图片...")

    # 输出进度条
    t = 60
    start = time.perf_counter()

    for i in range(t + 1):
        finsh = "▓" * i
        need_do = "-" * (t - i)
        progress = (i / t) * 100
        dur = time.perf_counter() - start

        print("\r{:^3.0f}%[{}->{}]{:.2f}s".format(progress, finsh, need_do, dur), end="")

        time.sleep(0.02)

    # 数据清洗
    df['love'] = [int(i.replace('评论', '0')) for i in df[6]]

    # 数据排序
    names = df.sort_values(by='love', ascending=False)[0][:10]
    comments = df.sort_values(by='love', ascending=False)['love'][:10]

    # 设置显示数据
    names = [i for i in names]
    names.reverse()
    comments = [i for i in comments]
    comments.reverse()
    data = pd.Series(comments, index=names)

    # 设置图片显示属性,字体及大小
    plt.rcParams['font.sans-serif'] = ['Microsoft YaHei']
    plt.rcParams['font.size'] = 8
    plt.rcParams['axes.unicode_minus'] = False

    # 设置图片显示属性
    plt.figure(figsize=(16, 8), dpi=80)
    ax = plt.subplot(1, 1, 1)
    ax.patch.set_color('white')

    # 设置坐标轴属性
    lines = plt.gca()

    # 设置坐标轴颜色
    lines.spines['right'].set_color('none')
    lines.spines['top'].set_color('none')
    lines.spines['left'].set_color((64/255, 64/255, 64/255))
    lines.spines['bottom'].set_color((64/255, 64/255, 64/255))

    # 设置坐标轴刻度
    lines.xaxis.set_ticks_position('none')
    lines.yaxis.set_ticks_position('none')

    # 绘制柱状图,设置柱状图颜色
    data.plot.barh(ax=ax, width=0.7, alpha=0.7, color=(160/255, 102/255, 50/255))
    ax.set_title('网易云音乐欧美歌单评论 TOP10', fontsize=18, fontweight='light')

    # 添加歌单评论数量文本
    for x, y in enumerate(data.values):
        plt.text(y+200, x-0.08, '%s' % y, ha='center')

    # 保存图片
    plt.savefig('./music_image/top_10_of_ea_song_comment.png', dpi=None)

    # 显示图片
    plt.show()

print("\n已生成网易云音乐欧美歌单评论 TOP10 图片,保存至 music_image/top_10_of_ea_song_comment.png")
(八)top_10_ea_song_collection_distribution.py
"""数据可视化,欧美歌单收藏数量分布情况"""
import numpy as np
import pandas as pd
import matplotlib.pyplot as plt
import time


def data_visualization_of_top_10_ea_song_collection_distribution():
    """欧美歌单收藏数量分布情况"""
    df = pd.read_csv('./music_data/music_detail.csv', header=None)

    print("正在生成欧美歌单收藏数量分布情况图片...")

    # 输出进度条
    t = 60
    start = time.perf_counter()

    for i in range(t + 1):
        finsh = "▓" * i
        need_do = "-" * (t - i)
        progress = (i / t) * 100
        dur = time.perf_counter() - start

        print("\r{:^3.0f}%[{}->{}]{:.2f}s".format(progress, finsh, need_do, dur), end="")

        time.sleep(0.02)

    # 对收藏数取对数
    dom = []
    for i in df[3]:
        dom.append(np.log(int(i.replace('万', '0000'))))

    df['collection'] = dom

    # 设置图片显示属性,字体及大小
    plt.rcParams['font.sans-serif'] = ['Microsoft YaHei']
    plt.rcParams['font.size'] = 12
    plt.rcParams['axes.unicode_minus'] = False

    # 设置图片显示属性
    plt.figure(figsize=(16, 8), dpi=80)
    ax = plt.subplot(1, 1, 1)
    ax.patch.set_color('white')

    # 设置坐标轴属性
    lines = plt.gca()

    # 设置坐标轴颜色
    lines.spines['right'].set_color('none')
    lines.spines['top'].set_color('none')
    lines.spines['left'].set_color((64/255, 64/255, 64/255))
    lines.spines['bottom'].set_color((64/255, 64/255, 64/255))
    lines.xaxis.set_ticks_position('none')
    lines.yaxis.set_ticks_position('none')

    # 绘制直方图,设置直方图颜色
    ax.hist(df['collection'], bins=30, alpha=0.7, color=(21/255, 47/255, 71/255))
    ax.set_title('欧美歌单收藏数量分布情况', fontsize=20)

    # 保存图片
    plt.savefig('./music_image/top_10_ea_song_collection_distribution.png', dpi=None)

    # 显示图片
    plt.show()

print("\n已生成欧美歌单收藏数量分布情况图片,保存至 music_image/top_10_ea_song_collection_distribution.png")
(九)top_10_ea_song_playlists_distribution.py
"""数据可视化,欧美歌单播放数量分布情况"""
import numpy as np
import pandas as pd
import matplotlib.pyplot as plt
import time


def data_visualization_of_top_10_ea_song_playlists_distribution():
    """欧美歌单播放数量分布情况"""
    df = pd.read_csv('./music_data/music_detail.csv', header=None)

    print("正在生成欧美歌单播放数量分布情况图片...")

    # 输出进度条
    t = 60
    start = time.perf_counter()

    for i in range(t + 1):
        finsh = "▓" * i
        need_do = "-" * (t - i)
        progress = (i / t) * 100
        dur = time.perf_counter() - start

        print("\r{:^3.0f}%[{}->{}]{:.2f}s".format(progress, finsh, need_do, dur), end="")

        time.sleep(0.02)

    # 对播放数取对数
    dom = []
    for i in df[4]:
        dom.append(np.log(i))

    df['collection'] = dom

    # 设置图片显示属性,字体及大小
    plt.rcParams['font.sans-serif'] = ['Microsoft YaHei']
    plt.rcParams['font.size'] = 12
    plt.rcParams['axes.unicode_minus'] = False

    # 设置图片显示属性
    plt.figure(figsize=(16, 8), dpi=80)
    ax = plt.subplot(1, 1, 1)
    ax.patch.set_color('white')

    # 设置坐标轴属性
    lines = plt.gca()

    # 设置坐标轴颜色
    lines.spines['right'].set_color('none')
    lines.spines['top'].set_color('none')
    lines.spines['left'].set_color((64/255, 64/255, 64/255))
    lines.spines['bottom'].set_color((64/255, 64/255, 64/255))
    lines.xaxis.set_ticks_position('none')
    lines.yaxis.set_ticks_position('none')

    # 绘制直方图,设置直方图颜色
    ax.hist(df['collection'], bins=30, alpha=0.7, color=(255/255, 153/255, 0/255))
    ax.set_title('欧美歌单播放数量分布情况', fontsize=20)

    # 保存图片
    plt.savefig('./music_image/top_10_ea_song_playlists_distribution.png', dpi=None)

    # 显示图片
    plt.show()

    print("\n已生成欧美歌单播放数量分布情况图片,保存至 music_image/top_10_ea_song_playlists_distribution.png")
(十)label_ea_song.py
"""数据可视化,网易云音乐欧美歌单标签图"""
import squarify
import pandas as pd
import matplotlib.pyplot as plt
import time


def data_visualization_of_label_ea_song():
    """网易云音乐欧美歌单标签图"""
    df = pd.read_csv('./music_data/music_detail.csv', header=None)

    print("正在生成网易云音乐欧美歌单标签图片...")

    # 输出进度条
    t = 60
    start = time.perf_counter()

    for i in range(t + 1):
        finsh = "▓" * i
        need_do = "-" * (t - i)
        progress = (i / t) * 100
        dur = time.perf_counter() - start

        print("\r{:^3.0f}%[{}->{}]{:.2f}s".format(progress, finsh, need_do, dur), end="")

        time.sleep(0.02)

    # 处理标签信息
    tags = []
    dom2 = []

    for i in df[1]:
        c = i.split('-')

        for j in c:
            if j not in tags:
                tags.append(j)
            else:
                continue

    for item in tags:
        num = 0

        for i in df[1]:
            type2 = i.split('-')

            for j in range(len(type2)):
                if type2[j] == item:
                    num += 1
                else:
                    continue

        dom2.append(num)

    # 数据创建
    data = {'tags': tags, 'num': dom2}
    frame = pd.DataFrame(data)
    df1 = frame.sort_values(by='num', ascending=False)
    name = df1['tags'][:10]
    income = df1['num'][:10]

    # 绘图 details
    colors = ['#993333', '#CC9966',  '#333333', '#663366', '#003366', '#009966', '#FF6600', '#FF0033', '#009999',
              '#333366']
    plot = squarify.plot(sizes=income, label=name, color=colors, alpha=1, value=income, edgecolor='white',
                         linewidth=1.5)

    # 设置图片显示属性,字体及大小
    plt.rcParams['font.sans-serif'] = ['Microsoft YaHei']
    plt.rcParams['font.size'] = 8
    plt.rcParams['axes.unicode_minus'] = False

    # 设置标签大小为 1
    plt.rc('font', size=6)

    # 设置标题大小
    plot.set_title('网易云音乐欧美歌单标签图', fontsize=13, fontweight='light')

    # 除坐标轴
    plt.axis('off')

    # 除上边框和右边框刻度
    plt.tick_params(top=False, right=False)

    # 保存图片
    plt.savefig('./music_image/label_ea_song.png', dpi=None)

    # 显示图片
    plt.show()

print("\n已生成网易云音乐欧美歌单标签图片,保存至 music_image/label_ea_song.png")
(十一)music_wordcloud.py
"""数据可视化,歌单介绍词云图"""
from wordcloud import WordCloud, ImageColorGenerator
import matplotlib.pyplot as plt
import pandas as pd
import jieba
import time


def data_visualization_of_music_wordcloud():
    """歌单介绍词云图"""
    df = pd.read_csv('./music_data/music_detail.csv', header=None)
    text = ''

    print("正在生成歌单介绍词云图片...")

    # 输出进度条
    t = 60
    start = time.perf_counter()

    for i in range(t + 1):
        finsh = "▓" * i
        need_do = "-" * (t - i)
        progress = (i / t) * 100
        dur = time.perf_counter() - start

        print("\r{:^3.0f}%[{}->{}]{:.2f}s".format(progress, finsh, need_do, dur), end="")

        time.sleep(0.02)

    for line in df[2]:
        text += ' '.join(jieba.cut(line, cut_all=False))

    background_image = plt.imread('./music_image/background_image.jpg')

    stopwords = set('')
    stopwords.update(
        ['封面', 'none介绍', '介绍', '歌单', '歌曲', '我们', '自己', '没有', '就是', '可以', '知道', '一起', '不是',
         '因为', '什么', '时候', '还是', '如果', '不要', '那些', '那么', '那个', '所有', '一样', '一直', '不会', '现在',
         '他们', '这样', '最后', '这个', '只是', '有些', '其实', '开始', '曾经', '所以', '不能', '你们', '已经', '后来',
         '一切', '一定', '这些', '一些', '只有', '还有'])

    wc = WordCloud(
        background_color='white',
        mask=background_image,
        font_path='./font_resources/STZHONGS.ttf',
        max_words=2000,
        max_font_size=150,
        random_state=30,
        stopwords=stopwords
    )
    wc.generate_from_text(text)

    # 看看词频高的有哪些,把无用信息去除
    process_word = WordCloud.process_text(wc, text)
    sort = sorted(process_word.items(), key=lambda e: e[1], reverse=True)
    # print(sort[:50])

    img_colors = ImageColorGenerator(background_image)
    wc.recolor(color_func=img_colors)
    plt.imshow(wc)
    plt.axis('off')

    # 保存图片
    wc.to_file("./music_image/music_wordcloud.png")

    # 显示图片
    plt.show()

    print("\n已生成歌单介绍词云图片,保存至 music_image/music_wordcloud.png")
四、项目分析结果
网易云用户是很习惯创建歌单的一个用户群体,很多用户也是通过歌单了解到一些歌曲。一个网易云用户甚至自己一个人就创建上百个歌单,我们爬取了网易云欧美歌单的数据,制作了以下表格。
(一)歌曲出现次数 TOP10
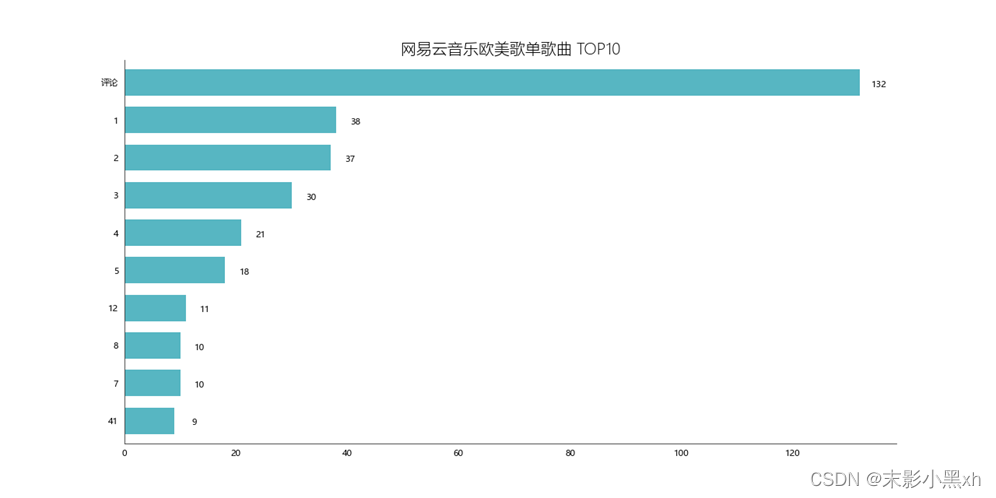
图 12 网易云音乐欧美歌单歌曲 TOP10
我们获得了网易云音乐欧美歌单中的 TOP10 歌曲,相信熟悉欧美歌曲的小伙伴们对这些歌都很熟悉,他们曾经或许就出现在推荐给你的歌单中。
(二)网易云音乐欧美歌单播放 TOP10
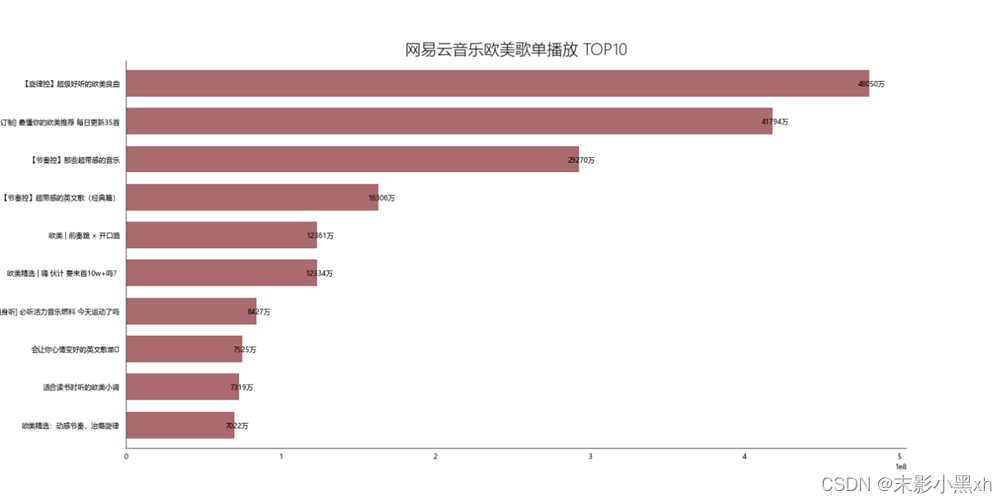
图 13 网易云音乐欧美歌单播放 TOP10
这是欧美歌单播放量前十排行榜,第一名拥有高达 4 亿的播放量,可见欧美歌曲是非常令人欢迎的。在歌单中统计中我们可以看到旋律和节奏是很多欧美音乐爱好者们比较看重和喜欢的。
(三)网易云音乐欧美歌单评论 TOP10
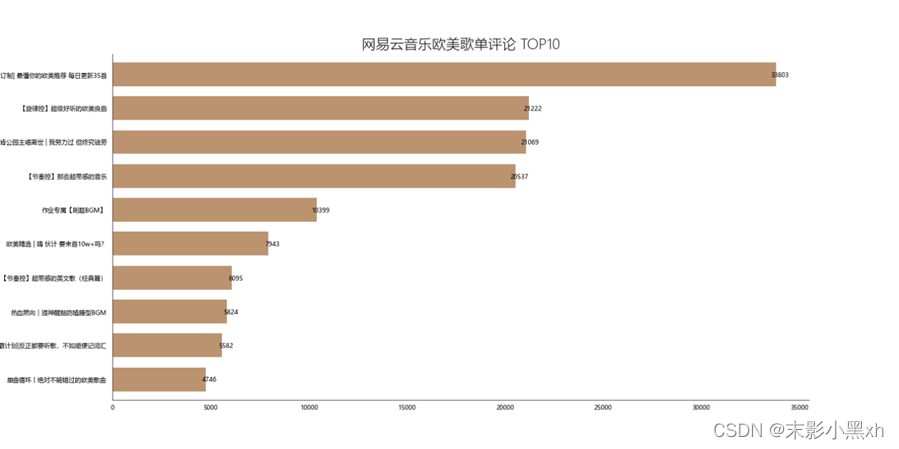
图 14 网易云音乐欧美歌单评论 TOP10
可以看到歌单【定制 最懂你的欧美推荐 每日更新 35 首】的评论数量最多。这可能与他日更与定制的性质有关。可以看到,很多热门的歌单其评论通常也很多。这个榜单中的歌单在上一个热门歌单的榜单也能找到。
(四)欧美歌单播放数量分布情况
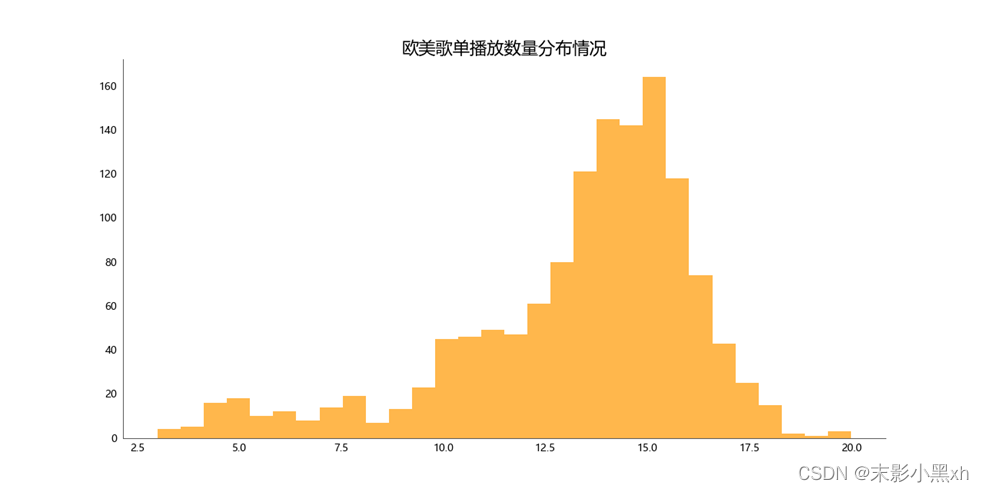
图 15 欧美歌单播放数量分布情况
将播放数做对数处理,使得能直观看出歌单播放数的分布。
歌单播放数主要分布在 0-1000 万。
其中 ln(10000000) = 16。
(五)网易云音乐欧美歌单标签图
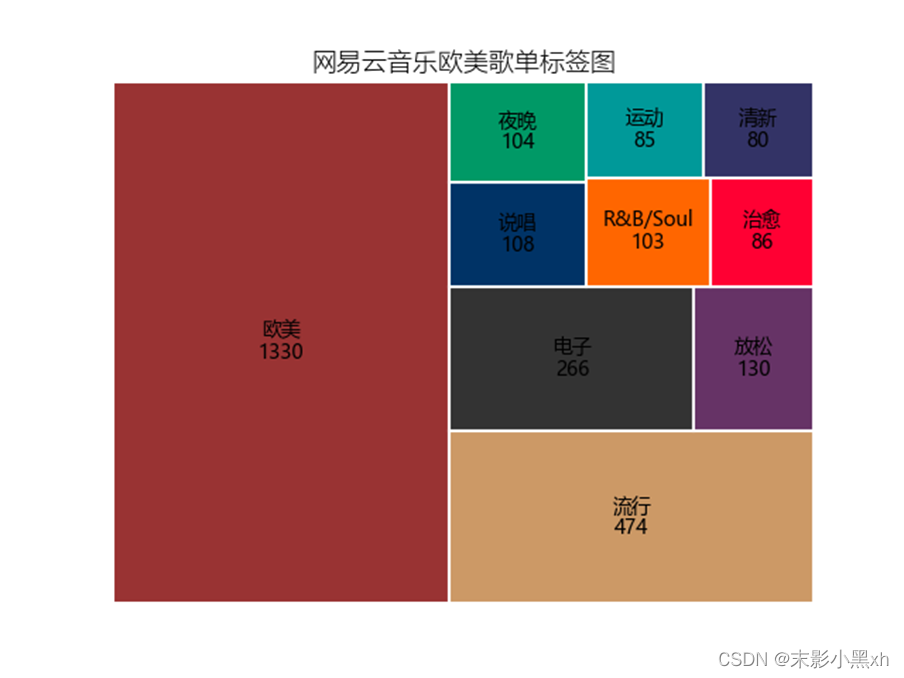
图 16 网易云音乐欧美歌单标签图
我们还找到了这些歌单的标签情况,既然是欧美歌单,【欧美】自然就占大头,几乎一半。我们还可以看到【电子】和【流行】这两大类也是非常多,【欧美流行】和【欧美电子】近两年在网易云用户中越来越火爆,特别是【欧美电子】,不少青年已经是电子音乐的忠实粉丝。
(六)歌单介绍词云图

图 17 歌单介绍词云图
歌单介绍词云图,这些词包括一个歌单的风格,背景还有故事。或许你曾经是因为哪一个词打动了你,让你收藏的这份歌单。与歌曲产生共鸣。
(七)音乐歌单运营分析
歌单有两种形式,一种是由官方创建的歌单,另一种是由用户自主创建的歌单,在网易云中,我们收藏倾听的大多来自个人用户。而歌单的运营不论是对个人还是官方都是有意义的。
很多用户是以歌单作为入口来了解音乐的,很少主动的的持续的去搜索音乐,所以歌单是否丰富,歌单的品质是否足够好,决定了用户使用的频率和时间。用户能够获取到越多越好的好歌单,就意味着这个音乐平台更有价值。
对于个人而言,创造令很多人满意的歌单,让个人获得关注,更高的成就感,进而创造更好的精品歌单。
所以我们基于以上的分析,做出了一个关于欧美歌单的运营分析:
在歌单内容方面,图 15 网易云音乐欧美歌单标签图里,我们可以看出,流行类标签和电子标签占比大约 50%。以标签分类实行个性化推荐,可以让歌单更容易被找到,曝光,便于管理。
另外我们的歌单可以向这两个热门的方向靠拢,面向受众面广的人群,可以获得可观的流量。再加上电子音乐的兴起,越来越优秀的电子音乐出现,可以丰富我们的歌单。
在歌单标题方面,歌单相当于一篇文章,歌单的标题可以吸引听众的注意力,让他们进来了解歌单,收听歌单。在歌单播放量 TOP10 和歌单评论数量 TOP10 中,我们区分出以下几类:
在特殊标志式方面,在前十的几个歌单名称中我们可以看到"【】“,”|"等特殊字符,这些特殊字符可以吸引听众的目光,强调自己歌单的亮点。
在强吸引式方面,使用"精选",“10w+”,"专属"等字眼,驱使听众点击。
在结论式方面使用,“热血燃向 | 提神醒脑防嗜睡型 BGM” 等字眼,驱使听众点击。
综上所述,一份歌单成功离不开标题、歌曲风格、乃至歌曲数。只有平衡好其中的因素,才能使其播放量达到预期。
(八)歌单数据可视化的商业价值
歌单数据可视化可以帮助音乐公司更好地理解消费者喜好,并为消费者提供更符合他们喜好的歌单。
此外,歌单数据可视化还可以帮助音乐公司更好地分析歌单中的信息,并利用这些信息来决定如何定价、营销和分销音乐。
因此,歌单数据可视化具有一定的商业价值,可以为音乐公司提供重要的市场信息。


 2612
2612

 被折叠的 条评论
为什么被折叠?
被折叠的 条评论
为什么被折叠?
 到【灌水乐园】发言


