


是否可以理解(int(i[2]+0.5),0,0) ?
学习网络数据集的调用
学习numpy的array升维、组合、切片、乱序
学习plt的叠加绘制、标注、添加颜色
Python代码实现:
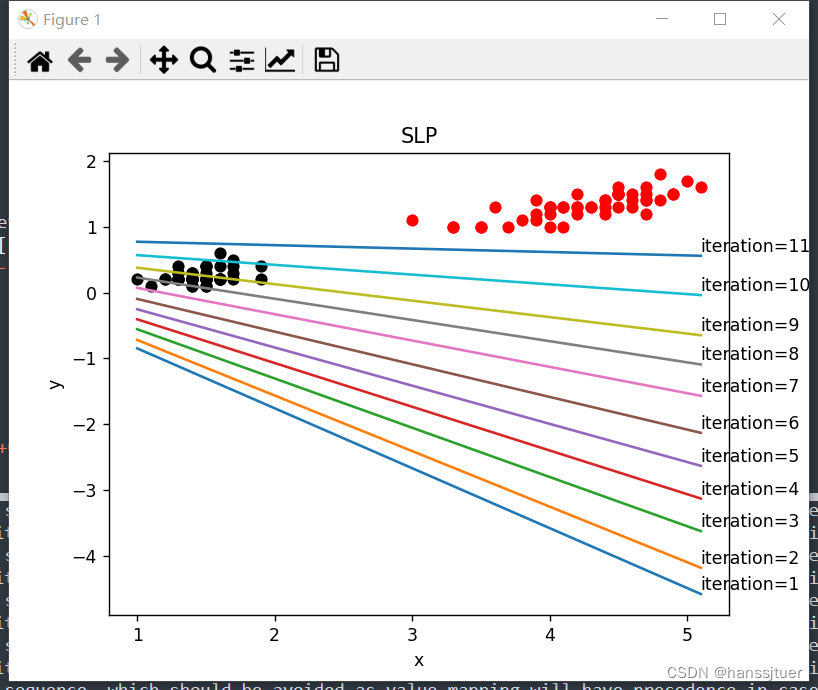
# SLP
# Cao Jinhao
# 20240719
from sklearn.datasets import load_iris
import numpy as np
import random
import matplotlib.pyplot as plt
iris = load_iris()
data_n4  = iris['data']
target_n = iris['target']
size = target_n.size
target_n1 = target_n.reshape(size, 1)
test_n5 = np.concatenate((data_n4, target_n1), axis=1)
test_m3 = [i[-3:] for i in test_n5 if i[-1] != 2]
test_m3 = [np.append(np.delete(i, -1), -1) if i[-1] == 0 else i for i in test_m3]
random.shuffle(test_m3)
test_m3 = np.array(test_m3)
x = test_m3[:, 0]
y = test_m3[:, 1]
xmin = min(x)
xmax = max(x)
for i in test_m3:
    plt.scatter(i[0], i[1], c=(int(i[2]+0.5),0,0))
plt.title('SLP')
plt.xlabel('x')
plt.ylabel('y')
w = [1, 1, 0]
step = 0.06
count = 0
for i in test_m3:
    xy1 = np.array([i[0], i[1], 1])
    if i[2]*np.dot(w, xy1) < 0:
        count += 1
        w += step*i[2]*xy1
        ymin = -w[0]*xmin-w[2]/w[1]
        ymax = -w[0]*xmax-w[2]/w[1]
        plt.plot([xmin, xmax], [ymin, ymax])
        plt.text(xmax, ymax, f'iteration={count}', verticalalignment='bottom')
        plt.draw()
        plt.pause(0.1)
plt.show()


 5578
5578

 被折叠的 条评论
为什么被折叠?
被折叠的 条评论
为什么被折叠?
 到【灌水乐园】发言


