


一、爬取前程无忧网
1,创建项目
scrapy startproject qcwy
cd qcwy
scrapy genspider qcwy1 51job.com
项目框架

2、编写items
# -*- coding: utf-8 -*-

# Define here the models for your scraped items
#
# See documentation in:
# https://docs.scrapy.org/en/latest/topics/items.html

import scrapy


class Qcwy2Item(scrapy.Item):
    # define the fields for your item here like:
    # name = scrapy.Field()
    # pass
    Job_title = scrapy.Field()
    Pay_level = scrapy.Field()
    Recruitment_unit = scrapy.Field()
    Workplace = scrapy.Field()
    Work_Experience = scrapy.Field()
    Education_requirements = scrapy.Field()
    job_content = scrapy.Field()
    Job_requirements = scrapy.Field()
    content_requirements = scrapy.Field()
    data = scrapy.Field()
3、编写spider文件(qcwy1.py)
# -*- coding: utf-8 -*-
import scrapy
from qcwy2.items import Qcwy2Item
class Qcwy1Spider(scrapy.Spider):
num = 0
name = 'qcwy1'
job = input("请输入要爬取的职位:")
allowed_domains = ['51job.com']
start_urls = ['https://search.51job.com/list/000000,000000,0000,00,9,99,'+str(job)+',2,1.html?lang=c&stype=&postchannel=0000&workyear=99&cotype=99°reefrom=99&jobterm=99&companysize=99&providesalary=99&lonlat=0%2C0&radius=-1&ord_field=0&confirmdate=9&fromType=&dibiaoid=0&address=&line=&specialarea=00&from=&welfare=']
def start_requests(self):
for i in range(0, 1000):
url = 'https://search.51job.com/list/000000,000000,0000,00,9,99,'+str(self.job)+',2,'+str(i)+'.html?lang=c&stype=&postchannel=0000&workyear=99&cotype=99°reefrom=99&jobterm=99&companysize=99&providesalary=99&lonlat=0%2C0&radius=-1&ord_field=0&confirmdate=9&fromType=&dibiaoid=0&address=&line=&specialarea=00&from=&welfare='
yield scrapy.Request(url, callback=self.parse)
def parse(self, response):
url_list = response.xpath('//*[@id="resultList"]/div/p/span/a/@href')
for i in url_list:
url = i.get()
if url:
print(url)
yield scrapy.Request(url, callback=self.data)
def data(self, response):
items = Qcwy2Item()
items['Job_title'] = str(response.xpath('/html/body/div[3]/div[2]/div[2]/div/div[1]/h1/text()').extract_first())
items['Pay_level'] = str(response.xpath('/html/body/div[3]/div[2]/div[2]/div/div[1]/strong/text()').extract_first())
items['Recruitment_unit'] = str(response.xpath(
'/html/body/div[3]/div[2]/div[2]/div/div[1]/p[1]/a[1]/text()').extract_first())
items['Workplace'] = str(response.xpath('/html/body/div[3]/div[2]/div[3]/div[2]/div/p/text()').extract_first())
items['Work_Experience'] = str(response.xpath(
'/html/body/div[3]/div[2]/div[2]/div/div[1]/p[2]/text()[2]').extract_first())
items['Education_requirements'] = str(response.xpath(
'/html/body/div[3]/div[2]/div[2]/div/div[1]/p[2]/text()[3]').extract_first())
def xx():
all_data = response.xpath('/html/body/div[3]/div[2]/div[3]/div[1]//text()').extract()
all_data = "".join(all_data)
data = all_data.replace(" ", "")
xx = data.find("职能类别")
list1 = ['工作职责', '职位描述', '岗位描述', '岗位职责', '工作描述']
list2 = ['任职资格', '职位要求', '任职条件', '任职要求', '岗位要求', '工作经验要求', '应聘资格要求']
oo = True
for i in list1:
qq = data.find(i)
if qq != -1:
for j in list2:
ww = data.find(j)
if ww != -1:
job_content = data[qq:ww]
Job_requirements = data[ww:xx]
oo = False
return [job_content, Job_requirements]
if oo:
content_requirements = data[10:xx]
return [content_requirements]
if len(xx()) >= 2:
items['job_content'] = str(xx()[0])
items['Job_requirements'] = str(xx()[1])
items['content_requirements'] = str(None)
else:
items['job_content'] = str(None)
items['Job_requirements'] = str(None)
items['content_requirements'] = str(xx()[0])
num = self.num + 1
print(items['Job_title'] + str(num))
self.num = num
data = response.xpath('/html/body/div[3]/div[2]/div[2]/div/div[1]/p[2]/text()[5]')
if data:
items['data'] = data
else:
items['data'] = str(None)
yield items编写seting
# -*- coding: utf-8 -*-

# Scrapy settings for qcwy2 project
#
# For simplicity, this file contains only settings considered important or
# commonly used. You can find more settings consulting the documentation:
#
#     https://docs.scrapy.org/en/latest/topics/settings.html
#     https://docs.scrapy.org/en/latest/topics/downloader-middleware.html
#     https://docs.scrapy.org/en/latest/topics/spider-middleware.html

BOT_NAME = 'qcwy2'

SPIDER_MODULES = ['qcwy2.spiders']
NEWSPIDER_MODULE = 'qcwy2.spiders'


# Crawl responsibly by identifying yourself (and your website) on the user-agent
#USER_AGENT = 'qcwy2 (+http://www.yourdomain.com)'

# Obey robots.txt rules
ROBOTSTXT_OBEY = True

# Configure maximum concurrent requests performed by Scrapy (default: 16)
CONCURRENT_REQUESTS = 32

# Configure a delay for requests for the same website (default: 0)
# See https://docs.scrapy.org/en/latest/topics/settings.html#download-delay
# See also autothrottle settings and docs
# DOWNLOAD_DELAY = 1
# The download delay setting will honor only one of:
#CONCURRENT_REQUESTS_PER_DOMAIN = 16
#CONCURRENT_REQUESTS_PER_IP = 16

# Disable cookies (enabled by default)
#COOKIES_ENABLED = False

# Disable Telnet Console (enabled by default)
#TELNETCONSOLE_ENABLED = False

# Override the default request headers:
#DEFAULT_REQUEST_HEADERS = {
#   'Accept': 'text/html,application/xhtml+xml,application/xml;q=0.9,*/*;q=0.8',
#   'Accept-Language': 'en',
#}

# Enable or disable spider middlewares
# See https://docs.scrapy.org/en/latest/topics/spider-middleware.html
#SPIDER_MIDDLEWARES = {
#    'qcwy2.middlewares.Qcwy2SpiderMiddleware': 543,
#}

# Enable or disable downloader middlewares
# See https://docs.scrapy.org/en/latest/topics/downloader-middleware.html
#DOWNLOADER_MIDDLEWARES = {
#    'qcwy2.middlewares.Qcwy2DownloaderMiddleware': 543,
#}

# Enable or disable extensions
# See https://docs.scrapy.org/en/latest/topics/extensions.html
#EXTENSIONS = {
#    'scrapy.extensions.telnet.TelnetConsole': None,
#}

# Configure item pipelines
# See https://docs.scrapy.org/en/latest/topics/item-pipeline.html
ITEM_PIPELINES = {
   'qcwy2.pipelines.Qcwy2Pipeline': 300,
}

# Enable and configure the AutoThrottle extension (disabled by default)
# See https://docs.scrapy.org/en/latest/topics/autothrottle.html
#AUTOTHROTTLE_ENABLED = True
# The initial download delay
#AUTOTHROTTLE_START_DELAY = 5
# The maximum download delay to be set in case of high latencies
#AUTOTHROTTLE_MAX_DELAY = 60
# The average number of requests Scrapy should be sending in parallel to
# each remote server
#AUTOTHROTTLE_TARGET_CONCURRENCY = 1.0
# Enable showing throttling stats for every response received:
#AUTOTHROTTLE_DEBUG = False

# Enable and configure HTTP caching (disabled by default)
# See https://docs.scrapy.org/en/latest/topics/downloader-middleware.html#httpcache-middleware-settings
#HTTPCACHE_ENABLED = True
#HTTPCACHE_EXPIRATION_SECS = 0
#HTTPCACHE_DIR = 'httpcache'
#HTTPCACHE_IGNORE_HTTP_CODES = []
#HTTPCACHE_STORAGE = 'scrapy.extensions.httpcache.FilesystemCacheStorage'
编写pipelines
# -*- coding: utf-8 -*-

# Define your item pipelines here
#
# Don't forget to add your pipeline to the ITEM_PIPELINES setting
# See: https://docs.scrapy.org/en/latest/topics/item-pipeline.html
import pymysql

class Qcwy2Pipeline:
    def open_spider(self, spider):
        # connection database
        self.connect = pymysql.connect(host='localhost', user='root', passwd='tc0726zy',
                                       db='data_db')  # 后面三个依次是数据库连接名、数据库密码、数据库名称
        # get cursor
        self.cursor = self.connect.cursor()
        print("连接数据库成功")

    def process_item(self, item, spider):
        # sql语句
        insert_sql = """
        insert into data(Job_title, Pay_level, Recruitment_unit, Workplace, Work_Experience,Education_requirements,job_content,Job_requirements,content_requirements) VALUES (%s,%s,%s,%s,%s,%s,%s,%s,%s)
        """
        # 执行插入数据到数据库操作
        self.cursor.execute(insert_sql, (item['Job_title'], item['Pay_level'], item['Recruitment_unit'], item['Workplace'],
                                         item['Work_Experience'], item['Education_requirements'], item['job_content'], item['Job_requirements'], item['content_requirements']))
        # 提交,不进行提交无法保存到数据库
        self.connect.commit()
        return item

    def close_spider(self, spider):
        # 关闭游标和连接
        self.cursor.close()
        self.connect.close()
数据库如图

二、传入hdfs,用flume收集
这里我搭的是三台虚拟机的完全分布式分别为hadoop101、hadoop02、hadoop103
先开启服务
start-dfs.sh     # hadoop101上运行
statr-yarn.sh    # hadoop102上运行
flume配置文件
# The configuration file needs to define the sources,
# the channels and the sinks.
# Sources, channels and sinks are defined per agent,
# in this case called 'agent'
# 定义别名
a1.sources = r1
a1.sinks = k1
a1.channels = c1

# 描述/配置源source
a1.sources.r1.type = spooldir
# 设置监控的文件夹
# 扫描文件之后修改文件后缀
a1.sources.r1.spoolDir = /home/tc/data2
# 上传成功后显示后缀名
a1.sources.r1.fileSuffix = .COMPLETED
# 如论如何 加绝对路径的文件名 默认false
a1.sources.r1.fileHeader = true
# #忽略所有以.tmp结尾的文件,不上传
a1.sources.r1.ignorePattern = ([^ ]*\.tmp)
#开启日志长度截取标志,默认true,开启
a1.sources.tail.interceptors.i2.cutFlag = true
#最大截取字符串长度,整数,尽量控制在2M以内,单位:kb,1M=1024
a1.sources.tail.interceptors.i2.cutMax = 2048
#
# # 描述一下sink 下沉到hdfs
a1.sinks.k1.type = hdfs
a1.sinks.k1.hdfs.path = /flume/data/%y-%m-%d/%H-%M/
# #上传文件的前缀
a1.sinks.k1.hdfs.filePrefix = qcwy
# #是否按照时间滚动文件夹
a1.sinks.k1.hdfs.round = true
# #多少时间单位创建一个新的文件夹
a1.sinks.k1.hdfs.roundValue = 1
# #重新定义时间单位
a1.sinks.k1.hdfs.roundUnit = hour
# #是否使用本地时间戳
a1.sinks.k1.hdfs.useLocalTimeStamp = true
# #积攒多少个Event才flush到HDFS一次
a1.sinks.k1.hdfs.batchSize = 10
# #设置文件类型,可支持压缩
a1.sinks.k1.hdfs.fileType = DataStream
# #多久生成一个新的文件
a1.sinks.k1.hdfs.rollInterval = 600
# #设置每个文件的滚动大小
a1.sinks.k1.hdfs.rollSize = 134217700
# #文件的滚动与Event数量无关
a1.sinks.k1.hdfs.rollCount = 0
# #最小冗余数
a1.sinks.k1.hdfs.minBlockReplicas = 1
# # 使用在内存中缓冲事件的通道
a1.channels.c1.type = memory
a1.channels.c1.capacity = 1000
a1.channels.c1.transactionCapacity = 100
#
# # 将源和接收器绑定到通道
a1.sources.r1.channels = c1
a1.sinks.k1.channel = c1
从本地mysql导出数据为txt

导出数据

用filezilla软件直接上传到flume监测的文件夹中

flume在收集日志

查看hdfs上的数据

三、用hive分析后sqoop技术存入mysql数据库
1.
分析“数据分析”、“大数据开发工程师”、“数据采集”等岗位的平均工资、最高工资、最低工资,并作条形图将结果展示出来;
create table text1_1 as select Job_title, Pay_level from qcwy where Job_title like '%数据分析%' and Pay_level like '%千/月%';

create table text1_2 as select Job_title, regexp_extract(Pay_level,'([0-9]+)-',1) as a_min, regexp_extract(Pay_level,'-([0-9]+)',1) as a_max, (regexp_extract(Pay_level,'([0-9]+)-',1) + regexp_extract(Pay_level,'-([0-9]+)',1))/2 as a_avg from text1_1;

create table text1_3 as select "数据分析" as Job_title, min(int(a_min)*0.1) as s_min, max(int(a_max)*0.1) as s_max, regexp_extract(avg(a_avg),'([0-9]+.[0-9]?[0-9]?)',1)*0.1 as s_avg from text1_2;

create table text1_11 as select Job_title, Pay_level from qcwy where Job_title like '%数据分析%' and Pay_level like '%万/月%';

create table text1_22 as select Job_title, regexp_extract(Pay_level,'([0-9]+)-',1) as a_min, regexp_extract(Pay_level,'-([0-9]+)',1) as a_max, (regexp_extract(Pay_level,'([0-9]+)-',1) + regexp_extract(Pay_level,'-([0-9]+)',1))/2 as a_avg from text1_11;

create table text1_33 as select "数据分析" as Job_title, min(int(a_min)) as s_min, max(int(a_max)) as s_max, regexp_extract(avg(a_avg),'([0-9]+.[0-9]?[0-9]?)',1) as s_avg from text1_22;

insert into table text1_3 select Job_title,s_min,s_max,s_avg from text1_33;

create table text1 as select "数据分析" as Job_title,min(s_min) as a_min,max(s_max) as a_max,sum(s_avg) as a_avg from text1_3;
查看数据
用sqoop技术传入mysql
bin/sqoop export --connect jdbc:mysql://hadoop101:3306/hive --username root --password 123456 --table text1 --export-dir /opt/module/apache-hive-2.3.7-bin/warehouse/data.db/text1 --input-fields-terminated-by '\001'
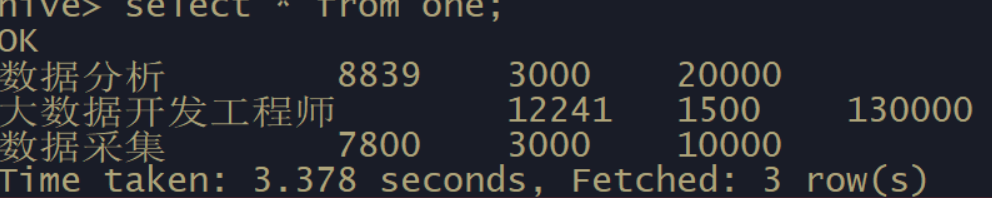
2.
分析“数据分析”、“大数据开发工程师”、“数据采集”等大数据相关岗位在成都、北京、上海、广州、深圳的岗位数,并做饼图将结果展示出来。
create table CD(Job_title string, num int);

insert into table SZ select '数据分析', count(*) from qcwy where Job_title like '%数据分析%' and Workplace like '%深圳%';

insert into table SZ select '大数据开发工程师', count(*) from qcwy where Job_title like '%大数据开发工程师%' and Workplace like '%深圳%';

insert into table SZ select '数据采集', count(*) from qcwy where Job_title like '%数据采集%' and Workplace like '%深圳%';

create table BJ(Job_title string, num int);
create table SH(Job_title string, num int);
create table GZ(Job_title string, num int);
create table SZ(Job_title string, num int);
查看数据

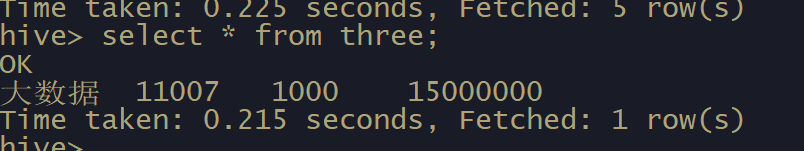
3.
分析大数据相关岗位1-3年工作经验的薪资水平(平均工资、最高工资、最低工资),并做出条形图展示出来;
create table test11_1 as select Job_title, Pay_level, work_experience from qcwy where Job_title like '%数据分析%' and Pay_level like '%千/月%' and (work_experience like '%1年经验%' or work_experience like '%2年经验%' or work_experience like '%3年经验%') ;

create table test11_2 as select Job_title, int(regexp_extract(Pay_level,'([0-9]+)-',1)) as s_min, int(regexp_extract(Pay_level,'-([0-9]+)',1)) as s_max, (int(regexp_extract(Pay_level,'([0-9]+)-',1)) + int(regexp_extract(Pay_level,'-([0-9]+)',1)))/2 as s_avg from test11_1;

create table test11_3 as select "数据分析" as Job_title, min(s_min)*0.1 as s_min, max(s_max)*0.1 as s_max, regexp_extract(avg(s_avg),'([0-9]+.[0-9]?[0-9]?)',1) *0.1 as s_avg from test11_2;

create table test11_11 as select Job_title, Pay_level, work_experience from qcwy where Job_title like '%数据分析%' and Pay_level like '%万/月%' and (work_experience like '%1年经验%' or work_experience like '%2年经验%' or work_experience like '%3年经验%') ;

create table test11_22 as select Job_title, int(regexp_extract(Pay_level,'([0-9]+)-',1)) as s_min, int(regexp_extract(Pay_level,'-([0-9]+)',1)) as s_max, (int(regexp_extract(Pay_level,'([0-9]+)-',1)) + int(regexp_extract(Pay_level,'-([0-9]+)',1)))/2 as s_avg from test11_11;

create table test11_33 as select "数据分析" as Job_title, min(s_min) as s_min, max(s_max) as s_max, regexp_extract(avg(s_avg),'([0-9]+.[0-9]?[0-9]?)',1) as s_avg from test11_22;

insert into table test11_3 select Job_title,s_min,s_max,s_avg from test11_33;

create table test11 as select "数据分析" as Job_title,min(s_min) as a_min,max(s_max) as a_max,sum(s_avg) as a_avg from test11_3;


create table test12_1 as select Job_title, Pay_level, work_experience from qcwy where Job_title like '%数据分析%' and Pay_level like '%千/月%' and (work_experience like '%1年经验%' or work_experience like '%2年经验%' or work_experience like '%3年经验%') ;

create table test12_2 as select Job_title, int(regexp_extract(Pay_level,'([0-9]+)-',1)) as s_min, int(regexp_extract(Pay_level,'-([0-9]+)',1)) as s_max, (int(regexp_extract(Pay_level,'([0-9]+)-',1)) + int(regexp_extract(Pay_level,'-([0-9]+)',1)))/2 as s_avg from test12_1;

create table test12_3 as select "大数据开发工程师" as Job_title, min(s_min)*0.1 as s_min, max(s_max)*0.1 as s_max, regexp_extract(avg(s_avg),'([0-9]+.[0-9]?[0-9]?)',1) *0.1 as s_avg from test12_2;

create table test12_11 as select Job_title, Pay_level, work_experience from qcwy where Job_title like '%大数据开发工程师%' and Pay_level like '%万/月%' and (work_experience like '%1年经验%' or work_experience like '%2年经验%' or work_experience like '%3年经验%') ;

create table test12_22 as select Job_title, int(regexp_extract(Pay_level,'([0-9]+)-',1)) as s_min, int(regexp_extract(Pay_level,'-([0-9]+)',1)) as s_max, (int(regexp_extract(Pay_level,'([0-9]+)-',1)) + int(regexp_extract(Pay_level,'-([0-9]+)',1)))/2 as s_avg from test12_11;

create table test12_33 as select "大数据开发工程师" as Job_title, min(s_min) as s_min, max(s_max) as s_max, regexp_extract(avg(s_avg),'([0-9]+.[0-9]?[0-9]?)',1) as s_avg from test12_22;

insert into table test12_3 select Job_title,s_min,s_max,s_avg from test12_33;

insert into table test11 select "大数据开发工程师" as Job_title,min(s_min) as a_min,max(s_max) as a_max,sum(s_avg) as a_avg from test12_3;


create table test13_1 as select Job_title, Pay_level, work_experience from qcwy where Job_title like '%数据采集%' and Pay_level like '%千/月%' and (work_experience like '%1年经验%' or work_experience like '%2年经验%' or work_experience like '%3年经验%') ;

create table test13_2 as select Job_title, int(regexp_extract(Pay_level,'([0-9]+)-',1)) as s_min, int(regexp_extract(Pay_level,'-([0-9]+)',1)) as s_max, (int(regexp_extract(Pay_level,'([0-9]+)-',1)) + int(regexp_extract(Pay_level,'-([0-9]+)',1)))/2 as s_avg from test13_1;

create table test13_3 as select "数据采集" as Job_title, min(s_min)*0.1 as s_min, max(s_max)*0.1 as s_max, regexp_extract(avg(s_avg),'([0-9]+.[0-9]?[0-9]?)',1) *0.1 as s_avg from test13_2;

create table test13_11 as select Job_title, Pay_level, work_experience from qcwy where Job_title like '%数据采集%' and Pay_level like '%万/月%' and (work_experience like '%1年经验%' or work_experience like '%2年经验%' or work_experience like '%3年经验%') ;

create table test13_22 as select Job_title, int(regexp_extract(Pay_level,'([0-9]+)-',1)) as s_min, int(regexp_extract(Pay_level,'-([0-9]+)',1)) as s_max, (int(regexp_extract(Pay_level,'([0-9]+)-',1)) + int(regexp_extract(Pay_level,'-([0-9]+)',1)))/2 as s_avg from test13_11;

create table test13_33 as select "数据采集" as Job_title, min(s_min) as s_min, max(s_max) as s_max, regexp_extract(avg(s_avg),'([0-9]+.[0-9]?[0-9]?)',1) as s_avg from test13_22;

insert into table test11 select "数据采集" as Job_title,s_max as a_min,s_min as a_max,s_avg as a_avg from test13_33;

insert into table test11 select "数据采集" as Job_title,min(s_min) as a_min,max(s_max) as a_max,sum(s_avg) as a_avg from test13_3;
查看数据
4.
分析大数据相关岗位几年需求的走向趋势,并做出折线图展示出来;
create table questions4(data string,number int);
insert into table questions4 select data,count(name) from bidata group by data;
查看数据


四、完成图形化
1.
import pymysql
from pyecharts.charts import Bar
from pyecharts import options as opts

db = pymysql.connect(host="192.168.10.1128",port=3306,database="hive",user='root',password='123456')
cursor = db.cursor()
sql = "select * from question1"
cursor.execute(sql)
data = cursor.fetchall()
print(data)
zhiwei = [data[0][0], data[1][0], data[2][0]]
print(zhiwei)
min_list = [data[0][2], data[1][2], data[2][2]]
max_list = [data[0][3], data[1][3], data[2][3]]
average_list = [data[0][1], data[1][1], data[2][1]]
bar = Bar()
bar.add_xaxis(xaxis_data=zhiwei)

bar.add_yaxis(series_name="最低工资", yaxis_data=min_list)
bar.add_yaxis(series_name="最高工资", yaxis_data=max_list)
bar.add_yaxis(series_name="平均工资", yaxis_data=average_list)
# 设置表的名称
bar.set_global_opts(title_opts=opts.TitleOpts(title='职位工资', subtitle='工资单位:万/月'), toolbox_opts=opts.ToolboxOpts(),
                    )
bar.render("工资图.html")
2
import pymysql
from pyecharts.charts import Pie
from pyecharts import options as opts
db = pymysql.connect(host="192.168.10.128",port=3306,database="hive",user='root',password='123456')
cursor = db.cursor()
sql = "select * from question2"
cursor.execute(sql)
data = cursor.fetchall()
print(data)
addr = ["成都","北京","上海","广州","深圳"]
num = [data[0][1],data[1][1],data[2][1],data[3][1],data[4][1]]
data_pair = [list(z) for z in zip(addr, num)]
data_pair.sort(key=lambda x: x[1])
# 画饼图
c = (
        Pie()
        .add("", [list(z) for z in zip(addr,num)])
        .set_global_opts(title_opts=opts.TitleOpts(title="大数据等相关工作地区岗位数",subtitle='单位:个数'),toolbox_opts=opts.ToolboxOpts())
        .set_series_opts(label_opts=opts.LabelOpts(formatter="{b}: {c}"))
    ).render("第二题.html")

3
import pymysql
from pyecharts.charts import Bar
from pyecharts import options as opts

db = pymysql.connect(host="192.168.10.128",port=3306,database="hive",user='root',password='123456')
cursor = db.cursor()
sql = "select * from question3"
cursor.execute(sql)
data = cursor.fetchall()
print(data)
zhiwei = [data[0][0]]
print(zhiwei)
min_list = [data[0][2]]
max_list = [data[0][3]]
average_list = [data[0][1]]
bar = Bar()
bar.add_xaxis(xaxis_data=zhiwei)
# 第一个参数是图例名称,第二个参数是y轴数据
bar.add_yaxis(series_name="最低工资", yaxis_data=min_list)
bar.add_yaxis(series_name="最高工资", yaxis_data=max_list)
bar.add_yaxis(series_name="平均工资", yaxis_data=average_list)
# 设置表的名称
bar.set_global_opts(title_opts=opts.TitleOpts(title='1-3年经验', subtitle='工资单位:万/月'), toolbox_opts=opts.ToolboxOpts(),
                    )
bar.render("第三题.html")

4
import pymysql
from pyecharts.charts import Line
from pyecharts import options as opts
db = pymysql.connect(host="192.168.10.128",port=3306,database="hive",user='root',password='123456')

cursor = db.cursor()
sql = "select * from question4"
cursor.execute(sql)
data = cursor.fetchall()

time_list = []
renshu = []

for i in data:
    time_list.append(str(i[0]))
    renshu.append(str(i[1]))
print(time_list)
print(renshu)
data_pair = [list(z) for z in zip(time_list, renshu)]
data_pair.sort(key=lambda x: x[1])

(
    Line(init_opts=opts.InitOpts(width="1000px", height="400px"))
    .set_global_opts(
        title_opts=opts.TitleOpts(title='工作岗位趋势', subtitle='工资单位:个'),
        tooltip_opts=opts.TooltipOpts(is_show=False),
        xaxis_opts=opts.AxisOpts(type_="category"),
        yaxis_opts=opts.AxisOpts(
            type_="value",
            axistick_opts=opts.AxisTickOpts(is_show=True),
            splitline_opts=opts.SplitLineOpts(is_show=True),
        ),
    )
    .add_xaxis(xaxis_data=time_list)
    .add_yaxis(
        series_name="大数据岗位需求变化趋势",
        y_axis=renshu,
        symbol="emptyCircle",
        is_symbol_show=True,
        label_opts=opts.LabelOpts(is_show=False),
    )
    .render("第四题.html")
)


 981
981


 被折叠的 条评论
为什么被折叠?
被折叠的 条评论
为什么被折叠?
 到【灌水乐园】发言


