


安装
npm install @antv/x6
//"@antv/x6": "^2.1.6",
项目结构

1、初始化画布 index.vue
<template>
    <div id="container"></div>
</template>

<script setup lang='ts'>
import { onMounted } from "vue";
import { Graph } from '@antv/x6';
let graph:Graph
const graphInit = ()=>{
    graph = new Graph({
        container: document.getElementById('container')!,
    });
}

onMounted(()=>{
    graphInit()
})
</script>

<style scoped>
#container{
    width: 100vw;
    height: 100vh;
}
</style>
2、注册节点
npm install @antv/x6-vue-shape
//"@antv/x6-vue-shape": "^2.0.9",
节点node.vue
<template>
  <div class="nodeitem">
    {{ data?.nodeName }}
  </div>
</template>
<script setup lang='ts'>
import { inject, onMounted,ref } from "vue";
import { Node } from '@antv/x6'

interface NodeDTO {
  nodeId?: string
  nodeName: string
}

const getNode: Function | undefined = inject<Function>("getNode");
const data =  ref<NodeDTO|undefined>(undefined)
onMounted(() => {
  const node = getNode?.() as Node;
  data.value = node?.getData()
});
</script>

<style scoped>
.nodeitem{
  width:100px;
  border: 1px solid #ccc;
}
</style>
3、在画布引入并注册自定义节点,配置节点信息
主画布:index.vue
<template>
    <div id="container"></div>
    <TeleportContainer/>
</template>

<script setup lang='ts'>
import { onMounted } from "vue";
import { Graph,Cell } from '@antv/x6';
import NodeItem from "./node.vue";
import {register,getTeleport} from '@antv/x6-vue-shape'
let graph:Graph
register({
    shape: "node-item",
    width: 150,
    height: 100,
    component: NodeItem,
});// 注册自定义节点
const TeleportContainer = getTeleport();// 自定义节点优化
const refreshData = (data)=>{//渲染节点数据
    const cells: Cell[] = []
    data.nodes.forEach((item: any) => {
        cells.push(graph.createNode(item))
    })
    data.edges?.forEach((item: any) => {
        cells.push(graph.createEdge(item))
    })
    graph.resetCells(cells)
    graph.centerContent()
    graph.zoomToFit({ padding: 10, maxScale: 1 })
}
const graphInit = ()=>{
    graph = new Graph({
        container: document.getElementById('container')!,
    });
    let data = {
        nodes: [
            {
                id: 'node1', // String,可选,节点的唯一标识
                shape: 'node-item',
                x: 40,       // Number,必选,节点位置的 x 值
                y: 40,       // Number,必选,节点位置的 y 值
                data: {
                    nodeId: 'node1',
                    nodeName: '节点1',
                },
            }
        ],
        edges:[]
    }
    refreshData(data)
}
onMounted(()=>{
    graphInit()
})
</script>
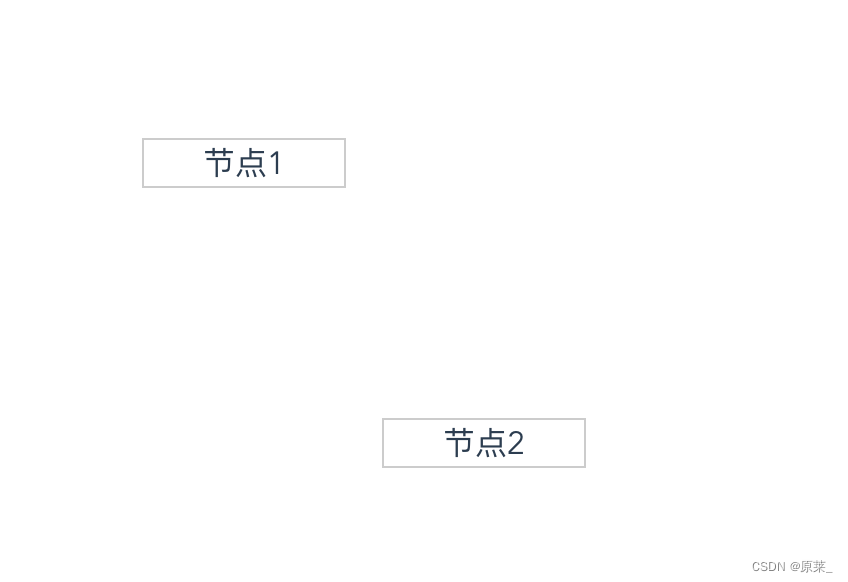
展示
小小预告:
下一篇 自定义节点样式
再下一篇 vue3 + antv/x6 实现拖拽侧边栏节点到画布


 753
753


 被折叠的 条评论
为什么被折叠?
被折叠的 条评论
为什么被折叠?
 到【灌水乐园】发言


