


官网https://prometheus.io/下载安装:
exporter下载官网
wget https://github.com/prometheus/prometheus/releases/download/v2.16.0/prometheus-2.16.0.linux-amd64.tar.gz
tar zxvf prometheus-2.16.0.linux-amd64.tar.gz
mv prometheus-2.16.0.linux-amd64 /usr/local/prometheus
cd /usr/local/prometheus
修改配置文件底部监控本机:
vim prometheus.yml
scrape_configs:
  - job_name: 'prometheus'
    static_configs:
    # 监控本地及端口
    - targets: ['localhost:9090']
启动服务:
./prometheus --config.file=prometheus.yml
1、放在后台:
用screen工具
screen
./prometheus --config.file=prometheus.yml
#ctrl+a+d退运行出
#查看后台
screen -ls
#查看前台
screen -r 进程ID
2.添加开机自启动
2.1添加用户
# 添加用户,后期用此账号启动服务
groupadd prometheus
useradd -g prometheus -s /sbin/nologin prometheus
# 赋权
cd ~
chown -R prometheus:prometheus /usr/local/prometheus/

# 创建prometheus运行数据目录
#mkdir -p /var/lib/prometheus
#chown -R prometheus:prometheus /var/lib/prometheus/
2.2设置开机启动
vi /usr/lib/systemd/system/prometheus.service
[Unit]
Description=Prometheus
Documentation=https://prometheus.io/
After=network.target
[Service]
# Type设置为notify时,服务会不断重启
Type=simple
User=prometheus
# --storage.tsdb.path是可选项,默认数据目录在运行目录的./dada目录中
ExecStart=/usr/local/prometheus/prometheus --config.file=/usr/local/prometheus/prometheus.yml --storage.tsdb.path=/usr/local/prometheus/data --storage.tsdb.retention=15d
Restart=on-failure
[Install]
WantedBy=multi-user.target


chown prometheus:prometheus /usr/lib/systemd/system/prometheus.service
2.3设置iptables
vi /etc/sysconfig/iptables
-A INPUT -p tcp -m state --state NEW -m tcp --dport 9090 -j ACCEPT
service iptables restart
systemctl enable prometheus
systemctl start prometheus
测试访问:http://localhost:9090
Docker安装:
docker run -p 9090:9090 -v /tmp/prometheus.yml:/etc/prometheus/prometheus.yml prom/prometheus
promethous原配置文件:
# my global config
global:
  scrape_interval:     15s # 采集间隔Set the scrape interval to every 15 seconds. Default is every 1 minute.
  evaluation_interval: 15s # 监控规则评估时间间隔Evaluate rules every 15 seconds. The default is every 1 minute.
  # scrape_timeout is set to the global default (10s).

# Alertmanager configuration
alerting:
  alertmanagers:
  - static_configs:
    - targets:
      # - alertmanager:9093

# Load rules once and periodically evaluate them according to the global 'evaluation_interval'.
rule_files:
  # - "first_rules.yml"
  # - "second_rules.yml"

# A scrape configuration containing exactly one endpoint to scrape:
# Here it's Prometheus itself.
scrape_configs:
  # The job name is added as a label `job=<job_name>` to any timeseries scraped from this config.
  - job_name: 'prometheus'  #任务名称

    # metrics_path defaults to '/metrics'
    # scheme defaults to 'http'.

    static_configs:
    - targets: ['localhost:9090']  #客户端
prometheus部分配置
–web.read-timeout=5m #连接的最大时间
–web.max-connections=512 #最大连接数
–storage.tsdb.retention=15d #保存期限
–storage.tsdb.path=“data/”
prometheus社区提供的各个exporter,参考
下载安装node_exporter:
wget https://github.com/prometheus/node_exporter/releases/download/v1.0.0-rc.0/node_exporter-1.0.0-rc.0.linux-amd64.tar.gz
tar zxvf node_exporter-1.0.0-rc.0.linux-amd64.tar.gz
mv node_exporter-1.0.0-rc.0.linux-amd64  /usr/local/node_exporter
cd /usr/local/node_exporter
启动服务:
./node_exporter
查看node_exporter进程状态:
netstat -tnlp | grep node
修改prometheus配置文件:
vim prometheus.yml
scrape_configs:
  - job_name: 'prometheus'
    static_configs:
    # 监控本地及端口
    - targets: ['localhost:9090',‘localhost:9100’]
设置开机启动:
chown -R prometheus:prometheus /usr/local/node_exporter/
vi /usr/lib/systemd/system/node_exporter.service
[Unit]
Description=node_exporter
Documentation=https://prometheus.io/
After=network.target
[Service]
Type=simple
User=prometheus
ExecStart=/usr/local/node_exporter/node_exporter
Restart=on-failure
[Install]
WantedBy=multi-user.target
设置iptables
vi /etc/sysconfig/iptables
-A INPUT -p tcp -m state --state NEW -m tcp --dport 9100 -j ACCEPT
service iptables restart
systemctl enable node_exporter
systemctl start node_exporter
Docker安装
docker run -d \
  --net="host" \
  --pid="host" \
  -v "/:/host:ro,rslave" \
  quay.io/prometheus/node-exporter \
  --path.rootfs /host
下载安装pushgateway
wget https://github.com/prometheus/prometheus/releases/download/v2.16.0/prometheus-2.16.0.linux-amd64.tar.gz
tar -xvf prometheus-2.16.0.linux-amd64.tar.gz
 cd /usr/local/pushgateway/
./pushgateway &    #启动
Docker安装
docker pull prom/pushgateway
docker run -d -p 9091:9091 prom/pushgateway
由于pushgateway是被动采集,当prometheus的server与target不在同一网段网络不通,无法直接拉取target数据,需要使用pushgateway作为数据中转点。
重新配置prometheus.yml
vim /usr/local/prometheus/prometheus.yml
#新增
  - job_name: 'pushgateway'
    scrape_interval: 30s
    honor_labels: true  #加上此配置exporter节点上传数据中的一些标签将不会被pushgateway节点的相同标签覆盖
    static_configs:
      - targets: ['pushgatewayserver:9091']
        labels:
          instance: pushgateway
用法:
echo "some_metric 3.14" | curl --data-binary @- http://192.168.244.144:9091/metrics/job/pushgateway/instance/pushgateway
#或者
curl 127.0.0.1:9100/metrics | curl --data-binary @- http://192.168.244.144:9091/metrics/job/pushgateway/instance/pushgateway
下载安装grafana
ubuntu下:
sudo apt-get install -y adduser libfontconfig1
wget https://dl.grafana.com/oss/release/grafana_6.6.2_amd64.deb
sudo dpkg -i grafana_6.6.2_amd64.deb
centos下:
wget https://dl.grafana.com/oss/release/grafana-6.6.2-1.x86_64.rpm
sudo yum localinstall grafana-6.6.2-1.x86_64.rpm
设置开机启动
systemctl enable grafana-server
systemctl start grafana-server
Docker安装:
docker run -d --name=grafana -p 3000:3000 grafana/grafana
账号密码:admin
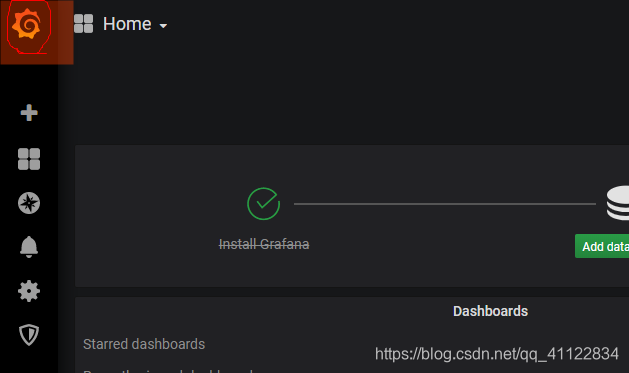
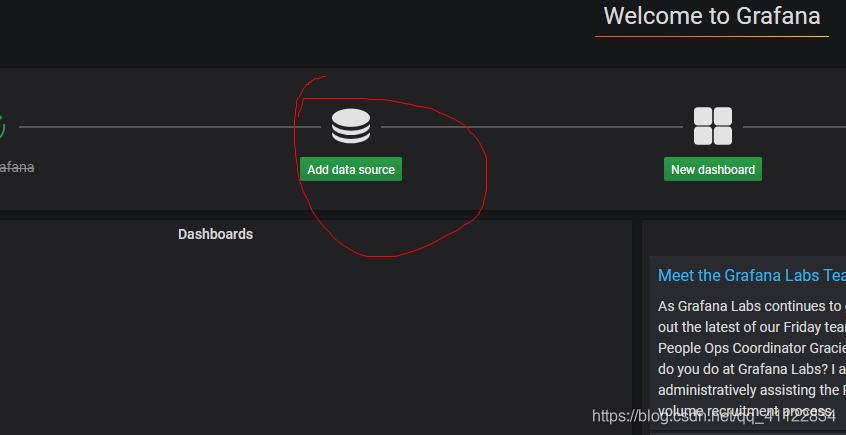
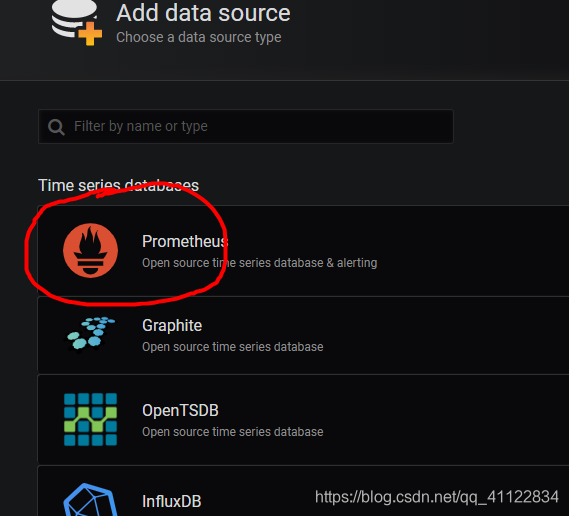
设置新的数据源:
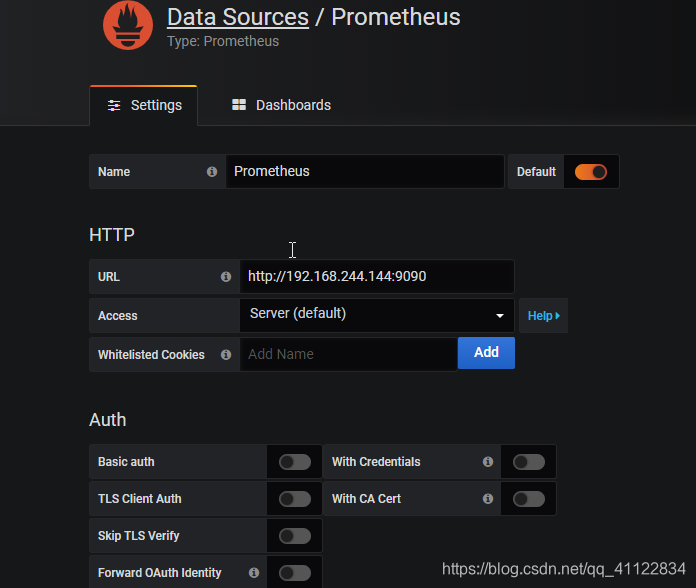
save
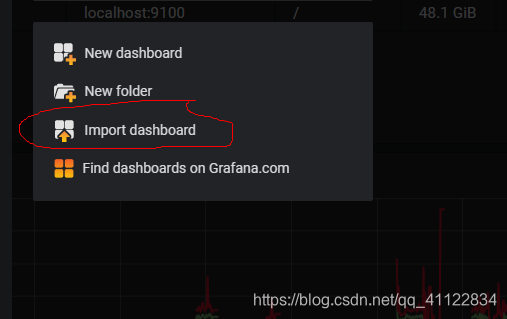
选择新建dashboard
grafana官网提供了大量的仪表板模板
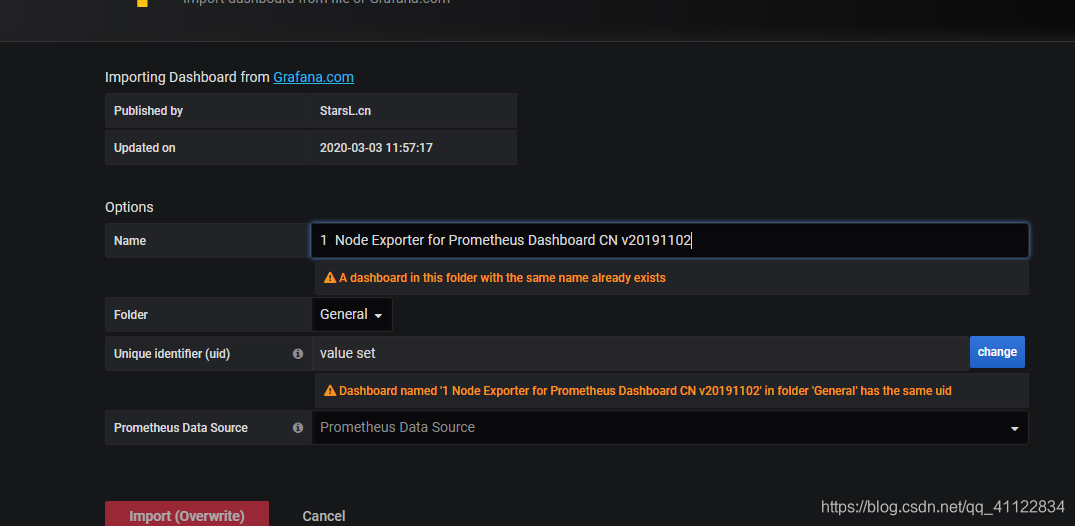
点击Import
输入标号11298是grafana官网提供的node_exporter模板
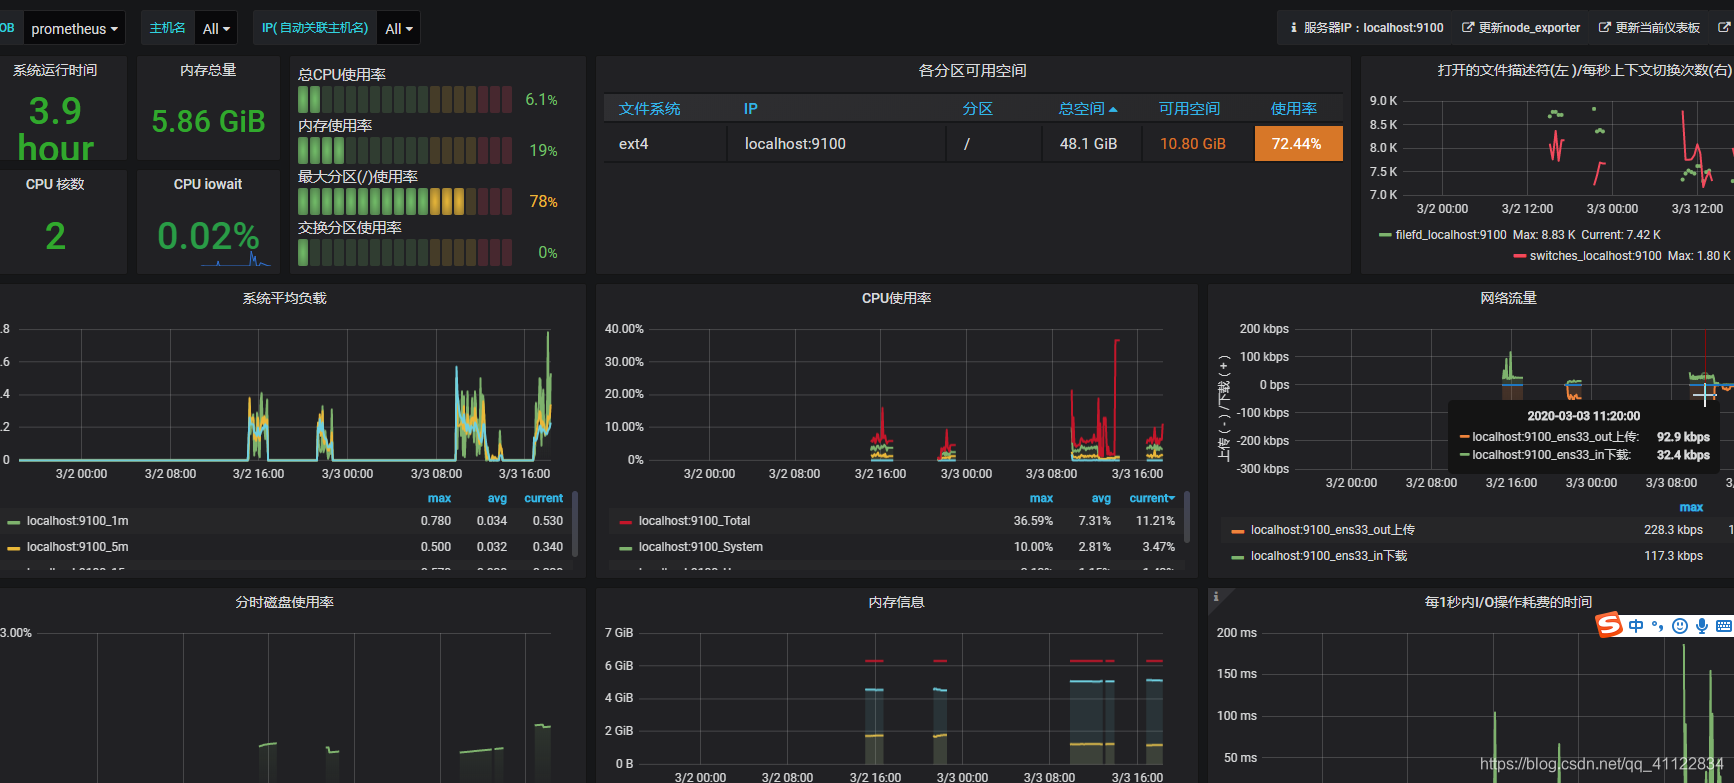
显示很强大:
prometheus安装alert
修改配置prometheus.yml
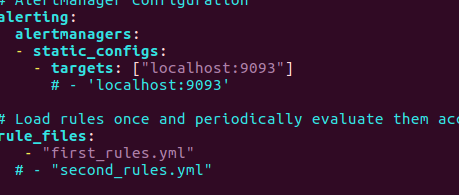
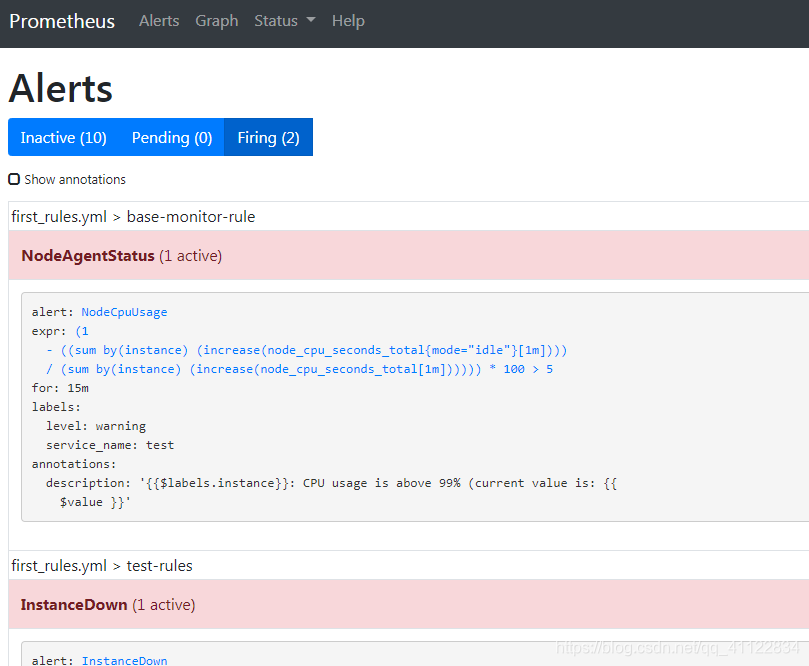
新建报警规则first_rules.yml
vim first_rules.yml
groups:
    - name: test-rules
      rules:
      - alert: InstanceDown
        expr: up == 0
        for: 2m
        labels:
          status: warning
        annotations:
          summary: "{{$labels.instance}}: has been down"
          description: "{{$labels.instance}}: job {{$labels.job}} has been down"
    - name: base-monitor-rule
      rules:
      - alert: NodeCpuUsage
        expr: (1-((sum(increase(node_cpu_seconds_total{mode='idle'}[1m]))by(instance))/(sum(increase(node_cpu_seconds_total[1m]))by(instance))))*100 > 5
        for: 15m
        labels:
          service_name: test
          level: warning
        annotations:
          summary: "High Error  CPU usage detected"
          description: "{{$labels.instance}}: CPU usage is above 99% (current value is: {{ $value }}"
这里定义了两个规则,expr是判定标准,第一个规则的意思是整机状态,第二个是之前的CPU使用率监控,为了方便验证我这里阈值设的是5.可以在后面增加你自己的告警规则。
部署alertmanager
下载:
wget https://github.com/prometheus/alertmanager/releases/download/v0.20.0/alertmanager-0.20.0.linux-amd64.tar.gz
tar zxvf alertmanager-0.20.0.linux-amd64
mv alertmanager-0.20.0.linux-amd64 /usr/local/alertmanager
以邮箱告警为例
配置alertmanager.yml
global:
  smtp_smarthost: 'smtp.163.com:25'      #邮箱服务器代理
  smtp_from: 'xxxxx@163.com'    #发邮方(自己邮箱)
  smtp_auth_username: 'xxxxx@163.com'   #自己的邮箱
  smtp_auth_password: 'xxxxx'      #密码

route:
  group_interval: 1m   #当第一个报警发送后,等待'group_interval'时间来发送新的一组报警信息
  repeat_interval: 1m   # 如果一个报警信息已经发送成功了,等待'repeat_interval'时间来重新发送他们
  receiver: 'mail-receiver'
receivers:
- name: 'mail-receiver'
  email_configs:
    - to: 'xxxxxx@163.com'     #目标邮箱
- name: 'web.hook'
  webhook_configs:
  - url: 'http://127.0.0.1:5001/'
inhibit_rules:
  - source_match:
      severity: 'critical'
    target_match:
      severity: 'warning'
    equal: ['alertname', 'dev', 'instance']
启动alertmanager
./alertmanager
这样就OK了


 3796
3796


 被折叠的 条评论
为什么被折叠?
被折叠的 条评论
为什么被折叠?
 到【灌水乐园】发言


