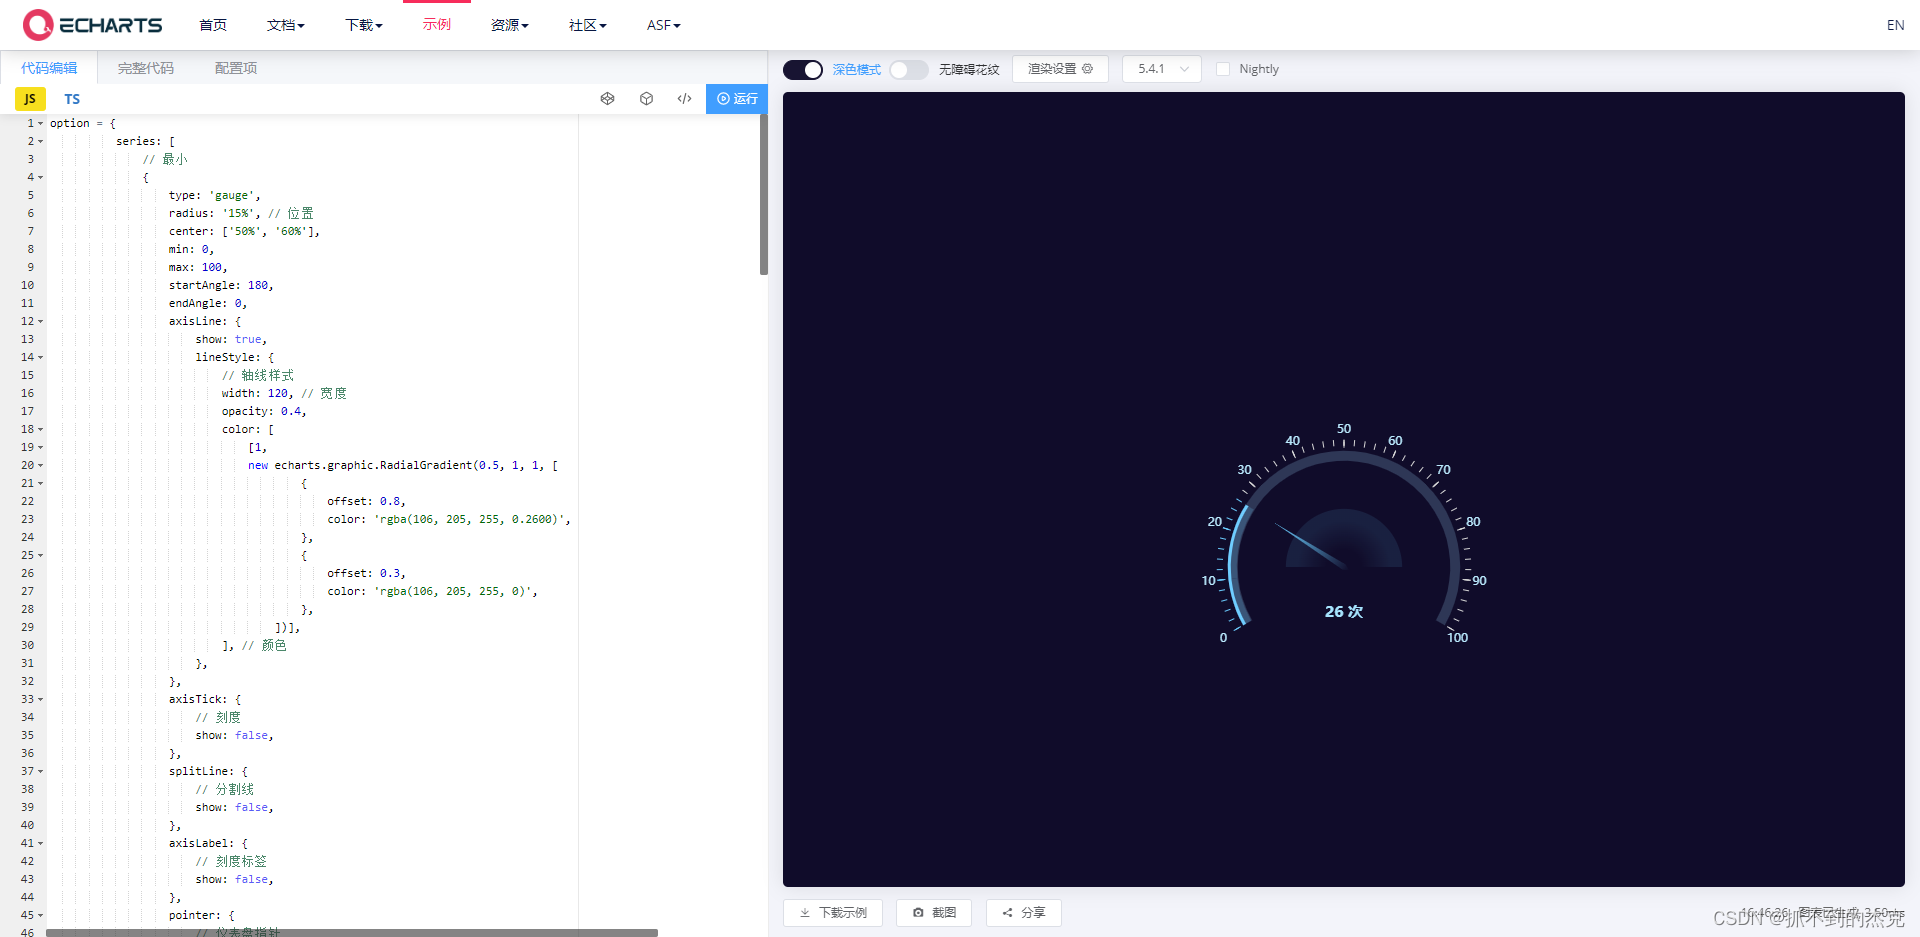
echarts 仪表盘刻度线随进度条改变颜色

示例图

在这里插入图片描述

option = {
          series: [
              // 最小
              {
                  type: 'gauge',
                  radius: '15%', // 位置
                  center: ['50%', '60%'],
                  min: 0,
                  max: 100,
                  startAngle: 180,
                  endAngle: 0,
                  axisLine: {
                      show: true,
                      lineStyle: {
                          // 轴线样式
                          width: 120, // 宽度
                          opacity: 0.4,
                          color: [
                              [1, 
                              new echarts.graphic.RadialGradient(0.5, 1, 1, [
                                      {
                                          offset: 0.8,
                                          color: 'rgba(106, 205, 255, 0.2600)',
                                      },
                                      {
                                          offset: 0.3,
                                          color: 'rgba(106, 205, 255, 0)',
                                      },
                                  ])],
                          ], // 颜色
                      },
                  },
                  axisTick: {
                      // 刻度
                      show: false,
                  },
                  splitLine: {
                      // 分割线
                      show: false,
                  },
                  axisLabel: {
                      // 刻度标签
                      show: false,
                  },
                  pointer: {
                      // 仪表盘指针
                      show: false,
                  },
                  detail: {
                      // 仪表盘详情
                      show: false,
                  },
            },
            // 双刻度 数字
            {
              type: 'gauge',
              center: ['50%', '60%'],
              radius: "30%",
              startAngle: 210,
              endAngle: -30,
              min: 0,
              max: 100,
              splitNumber: 10,
              itemStyle: {
                color: 'rgba(107, 205, 255, 0.2)'
              },
              progress: {
                show: true,
                width: 9
              },
              pointer: {
                show: true,
                width: 3,
                length: '70%',
                itemStyle: {
                  // 4个参数用于配置渐变色的起止位置, 这4个参数依次对应右/下/左/上四个方位. 而0 0 0 1则代表渐变色从正上方开始
                  color: new echarts.graphic.LinearGradient(
                      0, 1, 0, 0,
                      [
                        {offset: 1, color: 'rgba(106, 205, 255, 1)'},
                        {offset: 0, color: 'rgba(106, 205, 255, 0)'}
                      ]
                  )
                }
              },
              axisLine: {
                lineStyle: {
                  width: 0,
                  opacity: 0,
                  color: [
                    [0.26, 'rgba(107, 205, 255, 1)'], // 进度色
                    [1, 'rgba(216, 216, 216, 1)'], // 背景色
                  ]
                }
              },
              axisTick: {
                distance: -11,
                splitNumber: 5,
                lineStyle: {
                  width: 1,
                  color: 'auto'
                }
              },
              splitLine: {
                distance: -9,
                length: 6,
                lineStyle: {
                  width: 1,
                  color: 'auto'
                }
              },
              axisLabel: {
                distance: -24,
                color: 'rgba(187, 235, 255, 1)',
                fontSize: 12
              },
              anchor: {
                show: false
              },
              title: {
                show: false
              },
              detail: {
                valueAnimation: true,
                width: '60%',
                lineHeight: 20,
                borderRadius: 8,
                fontSize: 15,
                fontWeight: 'bolder',
                formatter: '{value} 次',
                color: 'rgba(167, 229, 255, 1)'
              },
              data: [
                {
                  value: 26
                }
              ]
            }, 
            // 细线背景板
            {
              type: 'gauge',
              center: ['50%', '60%'],
              radius: "30%",
              startAngle: 210,
              endAngle: -30,
              min: 0,
              max: 100,
              progress: {
                show: false,
              },
              pointer: {
                show: false,
              },
              axisLine: {
                lineStyle: {
                  width: 10,
                  color: [
                    [0.1, '#2E3756'], // 0~10% 红轴
                    
                    [1, '#2E3756'], // 20~30% 蓝轴
                  ]
                }
              },
              axisTick: {
                show: false,
              },
              splitLine: {
                show: false,
              },
              axisLabel: {
                show: false,
              },
              anchor: {
                show: false
              },
              title: {
                show: false
              },
              detail: {
                show: false
              },
              data: [
                {
                  value: 26
                }
              ]
            },
            // 细线
            {
              type: 'gauge',
              center: ['50%', '60%'],
              radius: "30%",
              startAngle: 210,
              endAngle: -30,
              min: 0,
              max: 100,
              itemStyle: {
                color: '#6FCDFF'
              },
              progress: {
                show: true,
                width: 3
              },
              pointer: {
                show: false
              },
              axisLine: {
                show: false
              },
              axisTick: {
                show: false
              },
              splitLine: {
                show: false
              },
              axisLabel: {
                show: false
              },
              detail: {
                show: false
              },
              data: [
                {
                  value: 26
                }
              ]
            }
          ]
};
  • 0
    点赞
  • 6
    收藏
    觉得还不错? 一键收藏
  • 0
    评论

“相关推荐”对你有帮助么?

  • 非常没帮助
  • 没帮助
  • 一般
  • 有帮助
  • 非常有帮助
提交
评论
添加红包

请填写红包祝福语或标题

红包个数最小为10个

红包金额最低5元

当前余额3.43前往充值 >
需支付:10.00
成就一亿技术人!
领取后你会自动成为博主和红包主的粉丝 规则
hope_wisdom
发出的红包
实付
使用余额支付
点击重新获取
扫码支付
钱包余额 0

抵扣说明:

1.余额是钱包充值的虚拟货币,按照1:1的比例进行支付金额的抵扣。
2.余额无法直接购买下载,可以购买VIP、付费专栏及课程。

余额充值