import pandas as pd
ser_obj = pd. Series( range ( 10 , 20 ) )
print ( type ( ser_obj) )
<class 'pandas.core.series.Series'>
print ( ser_obj. values)
print ( ser_obj. index)
[10 11 12 13 14 15 16 17 18 19]
RangeIndex(start=0, stop=10, step=1)
print ( ser_obj. head( 3 ) )
0    10
1    11
2    12
dtype: int32
print ( ser_obj)
0    10
1    11
2    12
3    13
4    14
5    15
6    16
7    17
8    18
9    19
dtype: int32
print ( ser_obj[ 0 ] )
print ( ser_obj[ 8 ] )
10
18
print ( ser_obj * 2 )
print ( ser_obj > 15 )
0    20
1    22
2    24
3    26
4    28
5    30
6    32
7    34
8    36
9    38
dtype: int32
0    False
1    False
2    False
3    False
4    False
5    False
6     True
7     True
8     True
9     True
dtype: bool
year_data = { 2001 : 17.8 , 2002 : 20.1 , 2003 : 16.5 }
ser_obj2 = pd. Series( year_data)
print ( ser_obj2. head( ) )
print ( ser_obj2. index)
2001    17.8
2002    20.1
2003    16.5
dtype: float64
Int64Index([2001, 2002, 2003], dtype='int64')
ser_obj2. name = 'temp'
ser_obj2. index. name = 'year'
print ( ser_obj2. head( ) )
year
2001    17.8
2002    20.1
2003    16.5
Name: temp, dtype: float64
import numpy as np
array = np. random. randn( 5 , 4 )
print ( array)
df_obj = pd. DataFrame( array)
print ( df_obj. head( ) )
[[-1.4293778   0.67288062 -0.45636593  0.21228057]
 [ 2.25005309  0.88655282  0.90643595 -0.70144272]
 [ 0.07317507  0.19102656 -0.04193859 -0.5824688 ]
 [ 0.40290136 -1.07145513 -1.15744649  1.65085608]
 [-1.1389536   0.46239919 -0.7448839   0.66148365]]
          0         1         2         3
0 -1.429378  0.672881 -0.456366  0.212281
1  2.250053  0.886553  0.906436 -0.701443
2  0.073175  0.191027 -0.041939 -0.582469
3  0.402901 -1.071455 -1.157446  1.650856
4 -1.138954  0.462399 -0.744884  0.661484
dict_data = { 'A' : 1 . ,
'B' : pd. Timestamp( '20161217' ) ,
'C' : pd. Series( 1 , index= list ( range ( 4 ) ) , dtype= 'float32' ) ,
'D' : np. array( [ 3 ] * 4 , dtype= 'int32' ) ,
'E' : pd. Categorical( [ "Python" , "Java" , "C++" , "C#" ] ) ,
'F' : 'ChinaHadoop' }
df_obj2 = pd. DataFrame( dict_data)
print ( df_obj2. head( ) )
     A          B    C  D       E            F
0  1.0 2016-12-17  1.0  3  Python  ChinaHadoop
1  1.0 2016-12-17  1.0  3    Java  ChinaHadoop
2  1.0 2016-12-17  1.0  3     C++  ChinaHadoop
3  1.0 2016-12-17  1.0  3      C#  ChinaHadoop
print ( df_obj2[ 'A' ] )
print ( type ( df_obj2[ 'A' ] ) )
print ( df_obj2. A)
0    1.0
1    1.0
2    1.0
3    1.0
Name: A, dtype: float64
<class 'pandas.core.series.Series'>
0    1.0
1    1.0
2    1.0
3    1.0
Name: A, dtype: float64
df_obj2[ 'G' ] = df_obj2[ 'D' ] + 4
print ( df_obj2. head( ) )
     A          B    C  D       E            F  G
0  1.0 2016-12-17  1.0  3  Python  ChinaHadoop  7
1  1.0 2016-12-17  1.0  3    Java  ChinaHadoop  7
2  1.0 2016-12-17  1.0  3     C++  ChinaHadoop  7
3  1.0 2016-12-17  1.0  3      C#  ChinaHadoop  7
del ( df_obj2[ 'G' ] )
print ( df_obj2. head( ) )
     A          B    C  D       E            F
0  1.0 2016-12-17  1.0  3  Python  ChinaHadoop
1  1.0 2016-12-17  1.0  3    Java  ChinaHadoop
2  1.0 2016-12-17  1.0  3     C++  ChinaHadoop
3  1.0 2016-12-17  1.0  3      C#  ChinaHadoop
print ( type ( ser_obj. index) )
print ( type ( df_obj2. index) )
print ( df_obj2. index)
<class 'pandas.core.indexes.range.RangeIndex'>
<class 'pandas.core.indexes.numeric.Int64Index'>
Int64Index([0, 1, 2, 3], dtype='int64')
df_obj2. index[ 0 ] = 2
---------------------------------------------------------------------------

TypeError                                 Traceback (most recent call last)

<ipython-input-22-7f40a356d7d1> in <module>()
      1 # 索引对象不可变
----> 2 df_obj2.index[0] = 2


D:\Anaconda\lib\site-packages\pandas\core\indexes\base.py in __setitem__(self, key, value)
   1668
   1669     def __setitem__(self, key, value):
-> 1670         raise TypeError("Index does not support mutable operations")
   1671
   1672     def __getitem__(self, key):


TypeError: Index does not support mutable operations
import pandas as pd
ser_obj = pd. Series( range ( 5 ) , index = [ 'a' , 'b' , 'c' , 'd' , 'e' ] )
print ( ser_obj. head( ) )
a    0
b    1
c    2
d    3
e    4
dtype: int32
print ( ser_obj[ 'a' ] )
print ( ser_obj[ 0 ] )
0
0
print ( ser_obj[ 1 : 3 ] )
print ( ser_obj[ 'b' : 'd' ] )
b    1
c    2
dtype: int32
b    1
c    2
d    3
dtype: int32
print ( ser_obj[ [ 0 , 2 , 4 ] ] )
print ( ser_obj[ [ 'a' , 'e' ] ] )
a    0
c    2
e    4
dtype: int32
a    0
e    4
dtype: int32
ser_bool = ser_obj > 2
print ( ser_bool)
print ( ser_obj[ ser_bool] )
print ( ser_obj[ ser_obj > 2 ] )
a    False
b    False
c    False
d     True
e     True
dtype: bool
d    3
e    4
dtype: int32
d    3
e    4
dtype: int32
import numpy as np
df_obj = pd. DataFrame( np. random. randn( 5 , 4 ) , columns = [ 'a' , 'b' , 'c' , 'd' ] )
print ( df_obj. head( ) )
          a         b         c         d
0 -0.595692  0.813699 -0.551327 -0.059703
1  0.339194 -2.335579  0.230472 -0.680213
2 -0.252306  0.212406 -0.979523  0.408522
3  0.216677  0.574524 -0.819607  2.170009
4 -1.099175 -0.665488  0.391421 -0.400642
print ( '列索引' )
print ( df_obj[ 'a' ] )
print ( type ( df_obj[ [ 0 ] ] ) )
print ( '不连续索引' )
print ( df_obj[ [ 'a' , 'c' ] ] )
print ( df_obj[ [ 1 , 3 ] ] )
列索引
0   -0.595692
1    0.339194
2   -0.252306
3    0.216677
4   -1.099175
Name: a, dtype: float64
<class 'pandas.core.frame.DataFrame'>
不连续索引
          a         c
0 -0.595692 -0.551327
1  0.339194  0.230472
2 -0.252306 -0.979523
3  0.216677 -0.819607
4 -1.099175  0.391421
          b         d
0  0.813699 -0.059703
1 -2.335579 -0.680213
2  0.212406  0.408522
3  0.574524  2.170009
4 -0.665488 -0.400642
print ( ser_obj[ 'b' : 'd' ] )
print ( ser_obj. loc[ 'b' : 'd' ] )
print ( df_obj[ 'a' ] )
print ( df_obj. loc[ 0 : 2 , 'a' ] )
b    1
c    2
d    3
dtype: int32
b    1
c    2
d    3
dtype: int32
0   -0.595692
1    0.339194
2   -0.252306
3    0.216677
4   -1.099175
Name: a, dtype: float64
0   -0.595692
1    0.339194
2   -0.252306
Name: a, dtype: float64
print ( ser_obj[ 1 : 3 ] )
print ( ser_obj. iloc[ 1 : 3 ] )
print ( df_obj. iloc[ 0 : 2 , 0 ] )
b    1
c    2
dtype: int32
b    1
c    2
dtype: int32
0   -0.595692
1    0.339194
Name: a, dtype: float64
print ( ser_obj. ix[ 1 : 3 ] )
print ( ser_obj. ix[ 'b' : 'c' ] )
print ( df_obj. ix[ 0 : 2 , 0 ] )
b    1
c    2
dtype: int32
b    1
c    2
dtype: int32
0   -0.595692
1    0.339194
2   -0.252306
Name: a, dtype: float64
s1 = pd. Series( range ( 10 , 20 ) , index = range ( 10 ) )
s2 = pd. Series( range ( 20 , 25 ) , index = range ( 5 ) )
print ( 's1: ' )
print ( s1)
print ( '' )
print ( 's2: ' )
print ( s2)
s1:
0    10
1    11
2    12
3    13
4    14
5    15
6    16
7    17
8    18
9    19
dtype: int32

s2:
0    20
1    21
2    22
3    23
4    24
dtype: int32
s1 + s2
0    30.0
1    32.0
2    34.0
3    36.0
4    38.0
5     NaN
6     NaN
7     NaN
8     NaN
9     NaN
dtype: float64
import numpy as np
df1 = pd. DataFrame( np. ones( ( 2 , 2 ) ) , columns = [ 'a' , 'b' ] )
df2 = pd. DataFrame( np. ones( ( 3 , 3 ) ) , columns = [ 'a' , 'b' , 'c' ] )
print ( 'df1: ' )
print ( df1)
print ( '' )
print ( 'df2: ' )
print ( df2)
df1:
     a    b
0  1.0  1.0
1  1.0  1.0

df2:
     a    b    c
0  1.0  1.0  1.0
1  1.0  1.0  1.0
2  1.0  1.0  1.0
df1 + df2
a b c 0 2.0 2.0 NaN 1 2.0 2.0 NaN 2 NaN NaN NaN
print ( s1)
print ( s2)
s1. add( s2, fill_value = - 1 )
0    10
1    11
2    12
3    13
4    14
5    15
6    16
7    17
8    18
9    19
dtype: int32
0    20
1    21
2    22
3    23
4    24
dtype: int32


0    30.0
1    32.0
2    34.0
3    36.0
4    38.0
5    14.0
6    15.0
7    16.0
8    17.0
9    18.0
dtype: float64
df1. sub( df2, fill_value = 2 . )
a b c 0 0.0 0.0 1.0 1 0.0 0.0 1.0 2 1.0 1.0 1.0
s3 = s1 + s2
print ( s3)
0    30.0
1    32.0
2    34.0
3    36.0
4    38.0
5     NaN
6     NaN
7     NaN
8     NaN
9     NaN
dtype: float64
s3_filled = s3. fillna( - 1 )
print ( s3_filled)
0    30.0
1    32.0
2    34.0
3    36.0
4    38.0
5    -1.0
6    -1.0
7    -1.0
8    -1.0
9    -1.0
dtype: float64
df3 = df1 + df2
print ( df3)
     a    b   c
0  2.0  2.0 NaN
1  2.0  2.0 NaN
2  NaN  NaN NaN
df3. fillna( 100 , inplace = True )
print ( df3)
       a      b      c
0    2.0    2.0  100.0
1    2.0    2.0  100.0
2  100.0  100.0  100.0
df = pd. DataFrame( np. random. randn( 5 , 4 ) - 1 )
print ( df)
print ( np. abs ( df) )
          0         1         2         3
0 -2.193022 -2.090432 -2.288651 -0.026022
1 -0.720957 -1.501025 -1.734828 -1.858286
2  0.300216 -3.391127 -0.872570 -0.686669
3 -2.552131 -1.452268 -1.188845 -0.597845
4  2.111044 -1.203676 -1.143487 -0.542755
          0         1         2         3
0  2.193022  2.090432  2.288651  0.026022
1  0.720957  1.501025  1.734828  1.858286
2  0.300216  3.391127  0.872570  0.686669
3  2.552131  1.452268  1.188845  0.597845
4  2.111044  1.203676  1.143487  0.542755
print ( df. apply ( lambda x : x. max ( ) ) )
0    2.111044
1   -1.203676
2   -0.872570
3   -0.026022
dtype: float64
print ( df. apply ( lambda x : x. max ( ) , axis= 1 ) )
0   -0.026022
1   -0.720957
2    0.300216
3   -0.597845
4    2.111044
dtype: float64
f2 = lambda x : '%.2f' % x
print ( df. applymap( f2) )
       0      1      2      3
0  -2.19  -2.09  -2.29  -0.03
1  -0.72  -1.50  -1.73  -1.86
2   0.30  -3.39  -0.87  -0.69
3  -2.55  -1.45  -1.19  -0.60
4   2.11  -1.20  -1.14  -0.54
s4 = pd. Series( range ( 10 , 15 ) , index = np. random. randint( 5 , size= 5 ) )
print ( s4)
4    10
3    11
1    12
4    13
4    14
dtype: int32
s4. sort_index( )
1    12
3    11
4    10
4    13
4    14
dtype: int32
df4 = pd. DataFrame( np. random. randn( 3 , 4 ) ,
index= np. random. randint( 3 , size= 3 ) ,
columns= np. random. randint( 4 , size= 4 ) )
print ( df4)
          3         2         2         1
2  0.244068 -1.977220  0.045238 -2.064546
2  0.218196 -0.419284 -0.698839  0.241649
2  0.296747 -0.021311  0.225724 -0.325439
df4. sort_index( axis= 1 )
1 2 2 3 2 -2.064546 -1.977220 0.045238 0.244068 2 0.241649 -0.419284 -0.698839 0.218196 2 -0.325439 -0.021311 0.225724 0.296747
df4. sort_values( by= 1 )
3 2 2 1 2 0.244068 -1.977220 0.045238 -2.064546 2 0.296747 -0.021311 0.225724 -0.325439 2 0.218196 -0.419284 -0.698839 0.241649
df_data = pd. DataFrame( [ np. random. randn( 3 ) , [ 1 . , np. nan, np. nan] ,
[ 4 . , np. nan, np. nan] , [ 1 . , np. nan, 2 . ] ] )
df_data. head( )
0 1 2 0 1.619463 0.548047 -1.027003 1 1.000000 NaN NaN 2 4.000000 NaN NaN 3 1.000000 NaN 2.000000
df_data. isnull( )
0 1 2 0 False False False 1 False True True 2 False True True 3 False True False
df_data. dropna( )
0 1 2 0 1.619463 0.548047 -1.027003
df_data. fillna( - 100 . )
0 1 2 0 1.619463 0.548047 -1.027003 1 1.000000 -100.000000 -100.000000 2 4.000000 -100.000000 -100.000000 3 1.000000 -100.000000 2.000000
import numpy as np
import pandas as pd
df_obj = pd. DataFrame( np. random. randn( 5 , 4 ) , columns = [ 'a' , 'b' , 'c' , 'd' ] )
df_obj
a b c d 0 0.715594 0.123322 -0.628493 -0.103682 1 0.783228 0.140333 -0.211933 -1.403887 2 -0.713423 -1.483364 0.276417 -0.664303 3 1.580704 -0.053138 0.562683 -0.424985 4 2.046556 -1.600219 0.021936 0.320219
df_obj. sum ( )
a    4.412658
b   -2.873065
c    0.020610
d   -2.276637
dtype: float64
df_obj. max ( )
a    2.046556
b    0.140333
c    0.562683
d    0.320219
dtype: float64
df_obj. min ( axis= 1 )
0   -0.628493
1   -1.403887
2   -1.483364
3   -0.424985
4   -1.600219
dtype: float64
df_obj. describe( )
a b c d count 5.000000 5.000000 5.000000 5.000000 mean 0.882532 -0.574613 0.004122 -0.455327 std 1.052045 0.887115 0.456436 0.646042 min -0.713423 -1.600219 -0.628493 -1.403887 25% 0.715594 -1.483364 -0.211933 -0.664303 50% 0.783228 -0.053138 0.021936 -0.424985 75% 1.580704 0.123322 0.276417 -0.103682 max 2.046556 0.140333 0.562683 0.320219
import pandas as pd
import numpy as np
ser_obj = pd. Series( np. random. randn( 12 ) ,
index= [ [ 'a' , 'a' , 'a' , 'b' , 'b' , 'b' , 'c' , 'c' , 'c' , 'd' , 'd' , 'd' ] ,
[ 0 , 1 , 2 , 0 , 1 , 2 , 0 , 1 , 2 , 0 , 1 , 2 ] ] )
print ( ser_obj)
a  0    0.078539
   1    0.643005
   2    1.254099
b  0    0.569994
   1   -1.267482
   2   -0.751972
c  0    2.579259
   1    0.566795
   2   -0.796418
d  0    1.444369
   1   -0.013740
   2   -1.541993
dtype: float64
print ( type ( ser_obj. index) )
print ( ser_obj. index)
<class 'pandas.indexes.multi.MultiIndex'>
MultiIndex(levels=[['a', 'b', 'c', 'd'], [0, 1, 2]],
           labels=[[0, 0, 0, 1, 1, 1, 2, 2, 2, 3, 3, 3], [0, 1, 2, 0, 1, 2, 0, 1, 2, 0, 1, 2]])
print ( ser_obj[ 'c' ] )
0    2.579259
1    0.566795
2   -0.796418
dtype: float64
print ( ser_obj[ : , 2 ] )
a    1.254099
b   -0.751972
c   -0.796418
d   -1.541993
dtype: float64
print ( ser_obj. swaplevel( ) )
0  a    0.078539
1  a    0.643005
2  a    1.254099
0  b    0.569994
1  b   -1.267482
2  b   -0.751972
0  c    2.579259
1  c    0.566795
2  c   -0.796418
0  d    1.444369
1  d   -0.013740
2  d   -1.541993
dtype: float64
print ( ser_obj. swaplevel( ) . sortlevel( ) )
0  a    0.078539
   b    0.569994
   c    2.579259
   d    1.444369
1  a    0.643005
   b   -1.267482
   c    0.566795
   d   -0.013740
2  a    1.254099
   b   -0.751972
   c   -0.796418
   d   -1.541993
dtype: float64
import pandas as pd
import numpy as np
dict_obj = { 'key1' : [ 'a' , 'b' , 'a' , 'b' ,
'a' , 'b' , 'a' , 'a' ] ,
'key2' : [ 'one' , 'one' , 'two' , 'three' ,
'two' , 'two' , 'one' , 'three' ] ,
'data1' : np. random. randn( 8 ) ,
'data2' : np. random. randn( 8 ) }
df_obj = pd. DataFrame( dict_obj)
print ( df_obj)
      data1     data2 key1   key2
0 -0.943078  0.820645    a    one
1 -1.429043  0.142617    b    one
2  0.832261  0.843898    a    two
3  0.906262  0.688165    b  three
4  0.541173  0.117232    a    two
5 -0.213385 -0.098734    b    two
6 -1.291468 -1.186638    a    one
7  1.186941  0.809122    a  three
print ( type ( df_obj. groupby( 'key1' ) ) )
<class 'pandas.core.groupby.DataFrameGroupBy'>
print ( type ( df_obj[ 'data1' ] . groupby( df_obj[ 'key1' ] ) ) )
<class 'pandas.core.groupby.SeriesGroupBy'>
grouped1 = df_obj. groupby( 'key1' )
print ( grouped1. mean( ) )
grouped2 = df_obj[ 'data1' ] . groupby( df_obj[ 'key1' ] )
print ( grouped2. mean( ) )
         data1     data2
key1
a     0.065166  0.280852
b    -0.245389  0.244016
key1
a    0.065166
b   -0.245389
Name: data1, dtype: float64
print ( grouped1. size( ) )
print ( grouped2. size( ) )
key1
a    5
b    3
dtype: int64
key1
a    5
b    3
dtype: int64
df_obj. groupby( 'key1' )
<pandas.core.groupby.DataFrameGroupBy object at 0x00000224B6DA5DD8>
self_def_key = [ 1 , 1 , 2 , 2 , 2 , 1 , 1 , 1 ]
df_obj. groupby( self_def_key) . size( )
1    5
2    3
dtype: int64
df_obj. groupby( [ df_obj[ 'key1' ] , df_obj[ 'key2' ] ] ) . size( )
key1  key2
a     one      2
      three    1
      two      2
b     one      1
      three    1
      two      1
dtype: int64
grouped2 = df_obj. groupby( [ 'key1' , 'key2' ] )
print ( grouped2. size( ) )
key1  key2
a     one      2
      three    1
      two      2
b     one      1
      three    1
      two      1
dtype: int64
grouped3 = df_obj. groupby( [ 'key2' , 'key1' ] )
print ( grouped3. mean( ) )
print ( )
print ( grouped3. mean( ) . unstack( ) )
               data1     data2
key2  key1
one   a    -1.117273 -0.182997
      b    -1.429043  0.142617
three a     1.186941  0.809122
      b     0.906262  0.688165
two   a     0.686717  0.480565
      b    -0.213385 -0.098734

          data1               data2
key1          a         b         a         b
key2
one   -1.117273 -1.429043 -0.182997  0.142617
three  1.186941  0.906262  0.809122  0.688165
two    0.686717 -0.213385  0.480565 -0.098734
for group_name, group_data in grouped1:
print ( group_name)
print ( group_data)
a
      data1     data2 key1   key2
0 -0.943078  0.820645    a    one
2  0.832261  0.843898    a    two
4  0.541173  0.117232    a    two
6 -1.291468 -1.186638    a    one
7  1.186941  0.809122    a  three
b
      data1     data2 key1   key2
1 -1.429043  0.142617    b    one
3  0.906262  0.688165    b  three
5 -0.213385 -0.098734    b    two
for group_name, group_data in grouped2:
print ( group_name)
print ( group_data)
('a', 'one')
      data1     data2 key1 key2
0 -0.943078  0.820645    a  one
6 -1.291468 -1.186638    a  one
('a', 'three')
      data1     data2 key1   key2
7  1.186941  0.809122    a  three
('a', 'two')
      data1     data2 key1 key2
2  0.832261  0.843898    a  two
4  0.541173  0.117232    a  two
('b', 'one')
      data1     data2 key1 key2
1 -1.429043  0.142617    b  one
('b', 'three')
      data1     data2 key1   key2
3  0.906262  0.688165    b  three
('b', 'two')
      data1     data2 key1 key2
5 -0.213385 -0.098734    b  two
list ( grouped1)
[('a',       data1     data2 key1   key2
  0 -0.943078  0.820645    a    one
  2  0.832261  0.843898    a    two
  4  0.541173  0.117232    a    two
  6 -1.291468 -1.186638    a    one
  7  1.186941  0.809122    a  three), ('b',       data1     data2 key1   key2
  1 -1.429043  0.142617    b    one
  3  0.906262  0.688165    b  three
  5 -0.213385 -0.098734    b    two)]
dict ( list ( grouped1) )
{'a':       data1     data2 key1   key2
 0 -0.943078  0.820645    a    one
 2  0.832261  0.843898    a    two
 4  0.541173  0.117232    a    two
 6 -1.291468 -1.186638    a    one
 7  1.186941  0.809122    a  three, 'b':       data1     data2 key1   key2
 1 -1.429043  0.142617    b    one
 3  0.906262  0.688165    b  three
 5 -0.213385 -0.098734    b    two}
print ( df_obj. dtypes)
df_obj. groupby( df_obj. dtypes, axis= 1 ) . size( )
df_obj. groupby( df_obj. dtypes, axis= 1 ) . sum ( )
data1    float64
data2    float64
key1      object
key2      object
dtype: object
float64 object 0 -0.122433 aone 1 -1.286426 bone 2 1.676158 atwo 3 1.594427 bthree 4 0.658404 atwo 5 -0.312119 btwo 6 -2.478106 aone 7 1.996064 athree
df_obj2 = pd. DataFrame( np. random. randint( 1 , 10 , ( 5 , 5 ) ) ,
columns= [ 'a' , 'b' , 'c' , 'd' , 'e' ] ,
index= [ 'A' , 'B' , 'C' , 'D' , 'E' ] )
df_obj2. ix[ 1 , 1 : 4 ] = np. NaN
df_obj2
a b c d e A 1 1.0 1.0 6.0 5 B 2 NaN NaN NaN 6 C 5 5.0 7.0 5.0 7 D 2 8.0 5.0 6.0 2 E 5 1.0 4.0 4.0 4
mapping_dict = { 'a' : 'python' , 'b' : 'python' , 'c' : 'java' , 'd' : 'C' , 'e' : 'java' }
df_obj2. groupby( mapping_dict, axis= 1 ) . size( )
df_obj2. groupby( mapping_dict, axis= 1 ) . count( )
df_obj2. groupby( mapping_dict, axis= 1 ) . sum ( )
C java python A 6.0 6.0 2.0 B NaN 6.0 2.0 C 5.0 14.0 10.0 D 6.0 7.0 10.0 E 4.0 8.0 6.0
df_obj3 = pd. DataFrame( np. random. randint( 1 , 10 , ( 5 , 5 ) ) ,
columns= [ 'a' , 'b' , 'c' , 'd' , 'e' ] ,
index= [ 'AA' , 'BBB' , 'CC' , 'D' , 'EE' ] )
def group_key ( idx) :
"""
idx 为列索引或行索引
"""
return len ( idx)
df_obj3. groupby( group_key) . size( )
1    1
2    3
3    1
dtype: int64
columns = pd. MultiIndex. from_arrays( [ [ 'Python' , 'Java' , 'Python' , 'Java' , 'Python' ] ,
[ 'A' , 'A' , 'B' , 'C' , 'B' ] ] , names= [ 'language' , 'index' ] )
df_obj4 = pd. DataFrame( np. random. randint( 1 , 10 , ( 5 , 5 ) ) , columns= columns)
df_obj4
language Python Java Python Java Python index A A B C B 0 1 6 4 7 2 1 9 7 2 2 4 2 3 9 9 7 5 3 1 6 1 6 6 4 5 1 7 3 6
df_obj4. groupby( level= 'language' , axis= 1 ) . sum ( )
df_obj4. groupby( level= 'index' , axis= 1 ) . sum ( )
index A B C 0 7 6 7 1 16 6 2 2 12 14 7 3 7 7 6 4 6 13 3
dict_obj = { 'key1' : [ 'a' , 'b' , 'a' , 'b' ,
'a' , 'b' , 'a' , 'a' ] ,
'key2' : [ 'one' , 'one' , 'two' , 'three' ,
'two' , 'two' , 'one' , 'three' ] ,
'data1' : np. random. randint( 1 , 10 , 8 ) ,
'data2' : np. random. randint( 1 , 10 , 8 ) }
df_obj5 = pd. DataFrame( dict_obj)
print ( df_obj5)
   data1  data2 key1   key2
0      4      2    a    one
1      7      1    b    one
2      2      8    a    two
3      9      4    b  three
4      3      2    a    two
5      8      5    b    two
6      6      8    a    one
7      9      3    a  three
print ( df_obj5. groupby( 'key1' ) . sum ( ) )
print ( df_obj5. groupby( 'key1' ) . max ( ) )
print ( df_obj5. groupby( 'key1' ) . min ( ) )
print ( df_obj5. groupby( 'key1' ) . mean( ) )
print ( df_obj5. groupby( 'key1' ) . size( ) )
print ( df_obj5. groupby( 'key1' ) . count( ) )
print ( df_obj5. groupby( 'key1' ) . describe( ) )
      data1  data2
key1
a        24     23
b        24     10
      data1  data2 key2
key1
a         9      8  two
b         9      5  two
      data1  data2 key2
key1
a         2      2  one
b         7      1  one
      data1     data2
key1
a       4.8  4.600000
b       8.0  3.333333
key1
a    5
b    3
dtype: int64
      data1  data2  key2
key1
a         5      5     5
b         3      3     3
               data1     data2
key1
a    count  5.000000  5.000000
     mean   4.800000  4.600000
     std    2.774887  3.130495
     min    2.000000  2.000000
     25%    3.000000  2.000000
     50%    4.000000  3.000000
     75%    6.000000  8.000000
     max    9.000000  8.000000
b    count  3.000000  3.000000
     mean   8.000000  3.333333
     std    1.000000  2.081666
     min    7.000000  1.000000
     25%    7.500000  2.500000
     50%    8.000000  4.000000
     75%    8.500000  4.500000
     max    9.000000  5.000000
def peak_range ( df) :
"""
返回数值范围
"""
return df. max ( ) - df. min ( )
print ( df_obj5. groupby( 'key1' ) . agg( peak_range) )
print ( df_obj. groupby( 'key1' ) . agg( lambda df : df. max ( ) - df. min ( ) ) )
      data1  data2
key1
a         7      6
b         2      4
         data1     data2
key1
a     2.478410  2.030536
b     2.335305  0.786899
print ( df_obj. groupby( 'key1' ) . agg( [ 'mean' , 'std' , 'count' , peak_range] ) )
         data1                                data2
          mean       std count peak_range      mean       std count peak_range
key1
a     0.065166  1.110226     5   2.478410  0.280852  0.875752     5   2.030536
b    -0.245389  1.167982     3   2.335305  0.244016  0.403130     3   0.786899
print ( df_obj. groupby( 'key1' ) . agg( [ 'mean' , 'std' , 'count' , ( 'range' , peak_range) ] ) )
         data1                               data2
          mean       std count     range      mean       std count     range
key1
a     0.065166  1.110226     5  2.478410  0.280852  0.875752     5  2.030536
b    -0.245389  1.167982     3  2.335305  0.244016  0.403130     3  0.786899
dict_mapping = { 'data1' : 'mean' ,
'data2' : 'sum' }
print ( df_obj. groupby( 'key1' ) . agg( dict_mapping) )
         data2     data1
key1
a     1.404259  0.065166
b     0.732047 -0.245389
dict_mapping = { 'data1' : [ 'mean' , 'max' ] ,
'data2' : 'sum' }
print ( df_obj. groupby( 'key1' ) . agg( dict_mapping) )
         data2     data1
           sum      mean       max
key1
a     1.404259  0.065166  1.186941
b     0.732047 -0.245389  0.906262
import pandas as pd
import numpy as np
dict_obj = { 'key1' : [ 'a' , 'b' , 'a' , 'b' ,
'a' , 'b' , 'a' , 'a' ] ,
'key2' : [ 'one' , 'one' , 'two' , 'three' ,
'two' , 'two' , 'one' , 'three' ] ,
'data1' : np. random. randint( 1 , 10 , 8 ) ,
'data2' : np. random. randint( 1 , 10 , 8 ) }
df_obj = pd. DataFrame( dict_obj)
df_obj
data1 data2 key1 key2 0 4 9 a one 1 8 4 b one 2 7 5 a two 3 8 5 b three 4 5 2 a two 5 7 8 b two 6 5 3 a one 7 4 1 a three
k1_sum = df_obj. groupby( 'key1' ) . sum ( ) . add_prefix( 'sum_' )
k1_sum
sum_data1 sum_data2 key1 a 25 20 b 23 17
pd. merge( df_obj, k1_sum, left_on= 'key1' , right_index= True )
data1 data2 key1 key2 sum_data1 sum_data2 0 4 9 a one 25 20 2 7 5 a two 25 20 4 5 2 a two 25 20 6 5 3 a one 25 20 7 4 1 a three 25 20 1 8 4 b one 23 17 3 8 5 b three 23 17 5 7 8 b two 23 17
k1_sum_tf = df_obj. groupby( 'key1' ) . transform( np. sum ) . add_prefix( 'sum_' )
df_obj[ k1_sum_tf. columns] = k1_sum_tf
df_obj
data1 data2 key1 key2 sum_data1 sum_data2 sum_key2 0 4 9 a one 4 9 one 1 8 4 b one 8 4 one 2 7 5 a two 7 5 two 3 8 5 b three 8 5 three 4 5 2 a two 5 2 two 5 7 8 b two 7 8 two 6 5 3 a one 5 3 one 7 4 1 a three 4 1 three
def diff_mean ( s) :
"""
返回数据与均值的差值
"""
return s - s. mean( )
df_obj. groupby( 'key1' ) . transform( diff_mean)
data1 data2 sum_data1 sum_data2 0 -1.000000 5.000000 -1.000000 5.000000 1 0.333333 -1.666667 0.333333 -1.666667 2 2.000000 1.000000 2.000000 1.000000 3 0.333333 -0.666667 0.333333 -0.666667 4 0.000000 -2.000000 0.000000 -2.000000 5 -0.666667 2.333333 -0.666667 2.333333 6 0.000000 -1.000000 0.000000 -1.000000 7 -1.000000 -3.000000 -1.000000 -3.000000
dataset_path = './starcraft.csv'
df_data = pd. read_csv( dataset_path, usecols= [ 'LeagueIndex' , 'Age' , 'HoursPerWeek' ,
'TotalHours' , 'APM' ] )
def top_n ( df, n= 3 , column= 'APM' ) :
"""
返回每个分组按 column 的 top n 数据
"""
return df. sort_values( by= column, ascending= False ) [ : n]
df_data. groupby( 'LeagueIndex' ) . apply ( top_n)
LeagueIndex Age HoursPerWeek TotalHours APM LeagueIndex 1 2214 1 20.0 12.0 730.0 172.9530 2246 1 27.0 8.0 250.0 141.6282 1753 1 20.0 28.0 100.0 139.6362 2 3062 2 20.0 6.0 100.0 179.6250 3229 2 16.0 24.0 110.0 156.7380 1520 2 29.0 6.0 250.0 151.6470 3 1557 3 22.0 6.0 200.0 226.6554 484 3 19.0 42.0 450.0 220.0692 2883 3 16.0 8.0 800.0 208.9500 4 2688 4 26.0 24.0 990.0 249.0210 1759 4 16.0 6.0 75.0 229.9122 2637 4 23.0 24.0 650.0 227.2272 5 3277 5 18.0 16.0 950.0 372.6426 93 5 17.0 36.0 720.0 335.4990 202 5 37.0 14.0 800.0 327.7218 6 734 6 16.0 28.0 730.0 389.8314 2746 6 16.0 28.0 4000.0 350.4114 1810 6 21.0 14.0 730.0 323.2506 7 3127 7 23.0 42.0 2000.0 298.7952 104 7 21.0 24.0 1000.0 286.4538 1654 7 18.0 98.0 700.0 236.0316 8 3393 8 NaN NaN NaN 375.8664 3373 8 NaN NaN NaN 364.8504 3372 8 NaN NaN NaN 355.3518
df_data. groupby( 'LeagueIndex' ) . apply ( top_n, n= 2 , column= 'Age' )
LeagueIndex Age HoursPerWeek TotalHours APM LeagueIndex 1 3146 1 40.0 12.0 150.0 38.5590 3040 1 39.0 10.0 500.0 29.8764 2 920 2 43.0 10.0 730.0 86.0586 2437 2 41.0 4.0 200.0 54.2166 3 1258 3 41.0 14.0 800.0 77.6472 2972 3 40.0 10.0 500.0 60.5970 4 1696 4 44.0 6.0 500.0 89.5266 1729 4 39.0 8.0 500.0 86.7246 5 202 5 37.0 14.0 800.0 327.7218 2745 5 37.0 18.0 1000.0 123.4098 6 3069 6 31.0 8.0 800.0 133.1790 2706 6 31.0 8.0 700.0 66.9918 7 2813 7 26.0 36.0 1300.0 188.5512 1992 7 26.0 24.0 1000.0 219.6690 8 3340 8 NaN NaN NaN 189.7404 3341 8 NaN NaN NaN 287.8128
df_data. groupby( 'LeagueIndex' , group_keys= False ) . apply ( top_n)
LeagueIndex Age HoursPerWeek TotalHours APM 2214 1 20.0 12.0 730.0 172.9530 2246 1 27.0 8.0 250.0 141.6282 1753 1 20.0 28.0 100.0 139.6362 3062 2 20.0 6.0 100.0 179.6250 3229 2 16.0 24.0 110.0 156.7380 1520 2 29.0 6.0 250.0 151.6470 1557 3 22.0 6.0 200.0 226.6554 484 3 19.0 42.0 450.0 220.0692 2883 3 16.0 8.0 800.0 208.9500 2688 4 26.0 24.0 990.0 249.0210 1759 4 16.0 6.0 75.0 229.9122 2637 4 23.0 24.0 650.0 227.2272 3277 5 18.0 16.0 950.0 372.6426 93 5 17.0 36.0 720.0 335.4990 202 5 37.0 14.0 800.0 327.7218 734 6 16.0 28.0 730.0 389.8314 2746 6 16.0 28.0 4000.0 350.4114 1810 6 21.0 14.0 730.0 323.2506 3127 7 23.0 42.0 2000.0 298.7952 104 7 21.0 24.0 1000.0 286.4538 1654 7 18.0 98.0 700.0 236.0316 3393 8 NaN NaN NaN 375.8664 3373 8 NaN NaN NaN 364.8504 3372 8 NaN NaN NaN 355.3518
import pandas as pd
import numpy as np
df_obj1 = pd. DataFrame( { 'key' : [ 'b' , 'b' , 'a' , 'c' , 'a' , 'a' , 'b' ] ,
'data1' : np. random. randint( 0 , 10 , 7 ) } )
df_obj2 = pd. DataFrame( { 'key' : [ 'a' , 'b' , 'd' ] ,
'data2' : np. random. randint( 0 , 10 , 3 ) } )
print ( df_obj1)
print ( df_obj2)
   data1 key
0      5   b
1      9   b
2      1   a
3      0   c
4      3   a
5      9   a
6      0   b
   data2 key
0      9   a
1      3   b
2      8   d
pd. merge( df_obj1, df_obj2)
data1 key data2 0 5 b 3 1 9 b 3 2 0 b 3 3 1 a 9 4 3 a 9 5 9 a 9
pd. merge( df_obj1, df_obj2, on= 'key' )
data1 key data2 0 5 b 3 1 9 b 3 2 0 b 3 3 1 a 9 4 3 a 9 5 9 a 9
df_obj1 = df_obj1. rename( columns= { 'key' : 'key1' } )
df_obj2 = df_obj2. rename( columns= { 'key' : 'key2' } )
pd. merge( df_obj1, df_obj2, left_on= 'key1' , right_on= 'key2' )
data1 key1 data2 key2 0 5 b 3 b 1 9 b 3 b 2 0 b 3 b 3 1 a 9 a 4 3 a 9 a 5 9 a 9 a
pd. merge( df_obj1, df_obj2, left_on= 'key1' , right_on= 'key2' , how= 'outer' )
data1 key1 data2 key2 0 5.0 b 3.0 b 1 9.0 b 3.0 b 2 0.0 b 3.0 b 3 1.0 a 9.0 a 4 3.0 a 9.0 a 5 9.0 a 9.0 a 6 0.0 c NaN NaN 7 NaN NaN 8.0 d
pd. merge( df_obj1, df_obj2, left_on= 'key1' , right_on= 'key2' , how= 'left' )
data1 key1 data2 key2 0 5 b 3.0 b 1 9 b 3.0 b 2 1 a 9.0 a 3 0 c NaN NaN 4 3 a 9.0 a 5 9 a 9.0 a 6 0 b 3.0 b
pd. merge( df_obj1, df_obj2, left_on= 'key1' , right_on= 'key2' , how= 'right' )
data1 key1 data2 key2 0 5.0 b 3 b 1 9.0 b 3 b 2 0.0 b 3 b 3 1.0 a 9 a 4 3.0 a 9 a 5 9.0 a 9 a 6 NaN NaN 8 d
df_obj1 = pd. DataFrame( { 'key' : [ 'b' , 'b' , 'a' , 'c' , 'a' , 'a' , 'b' ] ,
'data' : np. random. randint( 0 , 10 , 7 ) } )
df_obj2 = pd. DataFrame( { 'key' : [ 'a' , 'b' , 'd' ] ,
'data' : np. random. randint( 0 , 10 , 3 ) } )
pd. merge( df_obj1, df_obj2, on= 'key' , suffixes= ( '_left' , '_right' ) )
data_left key data_right 0 4 b 5 1 2 b 5 2 5 b 5 3 9 a 7 4 6 a 7 5 6 a 7
df_obj1 = pd. DataFrame( { 'key' : [ 'b' , 'b' , 'a' , 'c' , 'a' , 'a' , 'b' ] ,
'data1' : np. random. randint( 0 , 10 , 7 ) } )
df_obj2 = pd. DataFrame( { 'data2' : np. random. randint( 0 , 10 , 3 ) } , index= [ 'a' , 'b' , 'd' ] )
pd. merge( df_obj1, df_obj2, left_on= 'key' , right_index= True )
data1 key data2 0 6 b 5 1 7 b 5 6 9 b 5 2 2 a 3 4 4 a 3 5 4 a 3
import numpy as np
import pandas as pd
arr1 = np. random. randint( 0 , 10 , ( 3 , 4 ) )
arr2 = np. random. randint( 0 , 10 , ( 3 , 4 ) )
print ( arr1)
print ( arr2)
[[8 5 2 4]
 [2 9 9 0]
 [6 2 1 3]]
[[0 4 5 3]
 [6 4 1 3]
 [1 2 9 9]]
np. concatenate( [ arr1, arr2] )
array([[8, 5, 2, 4],
       [2, 9, 9, 0],
       [6, 2, 1, 3],
       [0, 4, 5, 3],
       [6, 4, 1, 3],
       [1, 2, 9, 9]])
np. concatenate( [ arr1, arr2] , axis= 1 )
array([[8, 5, 2, 4, 0, 4, 5, 3],
       [2, 9, 9, 0, 6, 4, 1, 3],
       [6, 2, 1, 3, 1, 2, 9, 9]])
ser_obj1 = pd. Series( np. random. randint( 0 , 10 , 5 ) , index= range ( 0 , 5 ) )
ser_obj2 = pd. Series( np. random. randint( 0 , 10 , 4 ) , index= range ( 5 , 9 ) )
ser_obj3 = pd. Series( np. random. randint( 0 , 10 , 3 ) , index= range ( 9 , 12 ) )
print ( ser_obj1)
print ( ser_obj2)
print ( ser_obj3)
0    9
1    9
2    5
3    6
4    4
dtype: int32
5    1
6    9
7    2
8    5
dtype: int32
9     4
10    7
11    4
dtype: int32
pd. concat( [ ser_obj1, ser_obj2, ser_obj3] )
0     9
1     9
2     5
3     6
4     4
5     1
6     9
7     2
8     5
9     4
10    7
11    4
dtype: int32
pd. concat( [ ser_obj1, ser_obj2, ser_obj3] , axis= 1 )
0 1 2 0 9.0 NaN NaN 1 9.0 NaN NaN 2 5.0 NaN NaN 3 6.0 NaN NaN 4 4.0 NaN NaN 5 NaN 1.0 NaN 6 NaN 9.0 NaN 7 NaN 2.0 NaN 8 NaN 5.0 NaN 9 NaN NaN 4.0 10 NaN NaN 7.0 11 NaN NaN 4.0
ser_obj1 = pd. Series( np. random. randint( 0 , 10 , 5 ) , index= range ( 5 ) )
ser_obj2 = pd. Series( np. random. randint( 0 , 10 , 4 ) , index= range ( 4 ) )
ser_obj3 = pd. Series( np. random. randint( 0 , 10 , 3 ) , index= range ( 3 ) )
print ( ser_obj1)
print ( ser_obj2)
print ( ser_obj3)
0    7
1    3
2    9
3    1
4    7
dtype: int32
0    6
1    1
2    4
3    7
dtype: int32
0    7
1    2
2    3
dtype: int32
pd. concat( [ ser_obj1, ser_obj2, ser_obj3] )
0    7
1    3
2    9
3    1
4    7
0    6
1    1
2    4
3    7
0    7
1    2
2    3
dtype: int32
pd. concat( [ ser_obj1, ser_obj2, ser_obj3] , axis= 1 , join= 'inner' )
df_obj1 = pd. DataFrame( np. random. randint( 0 , 10 , ( 3 , 2 ) ) , index= [ 'a' , 'b' , 'c' ] ,
columns= [ 'A' , 'B' ] )
df_obj2 = pd. DataFrame( np. random. randint( 0 , 10 , ( 2 , 2 ) ) , index= [ 'a' , 'b' ] ,
columns= [ 'C' , 'D' ] )
print ( df_obj1)
print ( df_obj2)
   A  B
a  1  6
b  1  0
c  1  6
   C  D
a  2  1
b  7  4
pd. concat( [ df_obj1, df_obj2] )
A B C D a 1.0 6.0 NaN NaN b 1.0 0.0 NaN NaN c 1.0 6.0 NaN NaN a NaN NaN 2.0 1.0 b NaN NaN 7.0 4.0
pd. concat( [ df_obj1, df_obj2] , axis= 1 )
A B C D a 1 6 2.0 1.0 b 1 0 7.0 4.0 c 1 6 NaN NaN
import numpy as np
import pandas as pd
df_obj = pd. DataFrame( np. random. randint( 0 , 10 , ( 5 , 2 ) ) , columns= [ 'data1' , 'data2' ] )
df_obj
data1 data2 0 0 8 1 9 5 2 1 1 3 8 5 4 9 4
stacked = df_obj. stack( )
print ( stacked)
0  data1    0
   data2    8
1  data1    9
   data2    5
2  data1    1
   data2    1
3  data1    8
   data2    5
4  data1    9
   data2    4
dtype: int32
print ( type ( stacked) )
print ( type ( stacked. index) )
<class 'pandas.core.series.Series'>
<class 'pandas.indexes.multi.MultiIndex'>
stacked. unstack( )
data1 data2 0 0 8 1 9 5 2 1 1 3 8 5 4 9 4
stacked. unstack( level= 0 )
0 1 2 3 4 data1 0 9 1 8 9 data2 8 5 1 5 4
import numpy as np
import pandas as pd
df_obj = pd. DataFrame( { 'data1' : [ 'a' ] * 4 + [ 'b' ] * 4 ,
'data2' : np. random. randint( 0 , 4 , 8 ) } )
df_obj
data1 data2 0 a 1 1 a 1 2 a 0 3 a 0 4 b 2 5 b 3 6 b 3 7 b 1
df_obj. duplicated( )
0    False
1     True
2    False
3     True
4    False
5    False
6     True
7    False
dtype: bool
df_obj. drop_duplicates( )
data1 data2 0 a 1 2 a 0 4 b 2 5 b 3 7 b 1
df_obj. drop_duplicates( 'data2' )
ser_obj = pd. Series( np. random. randint( 0 , 10 , 10 ) )
ser_obj
0    3
1    3
2    0
3    6
4    2
5    0
6    3
7    1
8    7
9    0
dtype: int32
ser_obj. map ( lambda x : x ** 2 )
0     9
1     9
2     0
3    36
4     4
5     0
6     9
7     1
8    49
9     0
dtype: int64
ser_obj. replace( 0 , - 100 )
0      3
1      3
2   -100
3      6
4      2
5   -100
6      3
7      1
8      7
9   -100
dtype: int32
ser_obj. replace( [ 0 , 2 ] , - 100 )
0      3
1      3
2   -100
3      6
4   -100
5   -100
6      3
7      1
8      7
9   -100
dtype: int32
ser_obj. replace( [ 0 , 2 ] , [ - 100 , - 200 ] )
0 3
1 3
2 -100
3 6
4 -200
5 -100
6 3
7 1
8 7
9 -100
dtype: int32
https://blog.csdn.net/qq_41251963/article/details/81603169
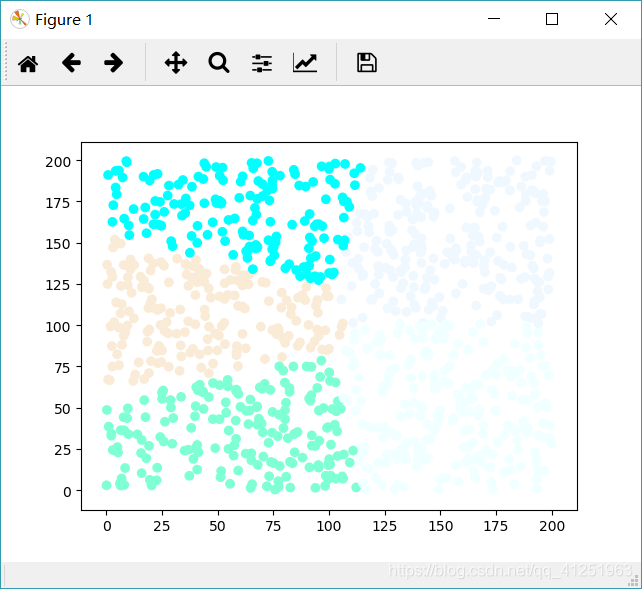
k-means算法的实现:
import math
import random
class Cluster ( object ) :
"""
聚类
"""
def __init__ ( self, samples) :
if len ( samples) == 0 :
raise Exception( "错误:一个空的聚类!" )
self. samples = samples
self. n_dim = samples[ 0 ] . n_dim
for sample in samples:
if sample. n_dim != self. n_dim:
raise Exception( "错误: 聚类中样本点的维度不一致!" )
self. centroid = self. cal_centroid( )
def __repr__ ( self) :
"""
输出对象信息
"""
return str ( self. samples)
def update ( self, samples) :
"""
计算之前的聚类中心和更新后聚类中心的距离
"""
old_centroid = self. centroid
self. samples = samples
self. centroid = self. cal_centroid( )
shift = get_distance( old_centroid, self. centroid)
return shift
def cal_centroid ( self) :
"""
对于一组样本点计算其中心点
"""
n_samples = len ( self. samples)
coords = [ sample. coords for sample in self. samples]
unzipped = zip ( * coords)
centroid_coords = [ math. fsum( d_list) / n_samples for d_list in unzipped]
return Sample( centroid_coords)
class Sample ( object ) :
"""
样本点类
"""
def __init__ ( self, coords) :
self. coords = coords
self. n_dim = len ( coords)
def __repr__ ( self) :
"""
输出对象信息
"""
return str ( self. coords)
def get_distance ( a, b) :
"""
返回样本点a, b的欧式距离
参考:https://en.wikipedia.org/wiki/Euclidean_distance#n_dimensions
"""
if a. n_dim != b. n_dim:
raise Exception( "错误: 样本点维度不同,无法计算距离!" )
acc_diff = 0.0
for i in range ( a. n_dim) :
square_diff = pow ( ( a. coords[ i] - b. coords[ i] ) , 2 )
acc_diff += square_diff
distance = math. sqrt( acc_diff)
return distance
def gen_random_sample ( n_dim, lower, upper) :
"""
生成随机样本
"""
sample = Sample( [ random. uniform( lower, upper) for _ in range ( n_dim) ] )
return sample
main.py
import random
from kmeans_tools import Cluster, get_distance, gen_random_sample
import matplotlib. pyplot as plt
from matplotlib import colors as mcolors
def kmeans ( samples, k, cutoff) :
"""
kmeans函数
"""
init_samples = random. sample( samples, k)
clusters = [ Cluster( [ sample] ) for sample in init_samples]
n_loop = 0
while True :
lists = [ [ ] for _ in clusters]
n_loop += 1
for sample in samples:
smallest_distance = get_distance( sample, clusters[ 0 ] . centroid)
cluster_index = 0
for i in range ( k - 1 ) :
distance = get_distance( sample, clusters[ i+ 1 ] . centroid)
if distance < smallest_distance:
smallest_distance = distance
cluster_index = i + 1
lists[ cluster_index] . append( sample)
biggest_shift = 0.0
for i in range ( k) :
shift = clusters[ i] . update( lists[ i] )
biggest_shift = max ( biggest_shift, shift)
if biggest_shift < cutoff:
print ( "第{}次迭代后,聚类稳定。" . format ( n_loop) )
break
return clusters
def run_main ( ) :
"""
主函数
"""
n_samples = 1000
n_feat = 2
lower = 0
upper = 200
n_cluster = 5
samples = [ gen_random_sample( n_feat, lower, upper) for _ in range ( n_samples) ]
cutoff = 0.2
clusters = kmeans( samples, n_cluster, cutoff)
for i, c in enumerate ( clusters) :
for sample in c. samples:
print ( '聚类--{},样本点--{}' . format ( i, sample) )
plt. subplot( )
color_names = list ( mcolors. cnames)
for i, c in enumerate ( clusters) :
x = [ ]
y = [ ]
random. choice
color = [ color_names[ i] ] * len ( c. samples)
for sample in c. samples:
x. append( sample. coords[ 0 ] )
y. append( sample. coords[ 1 ] )
plt. scatter( x, y, c= color)
plt. show( )
if __name__ == '__main__' :
run_main( )
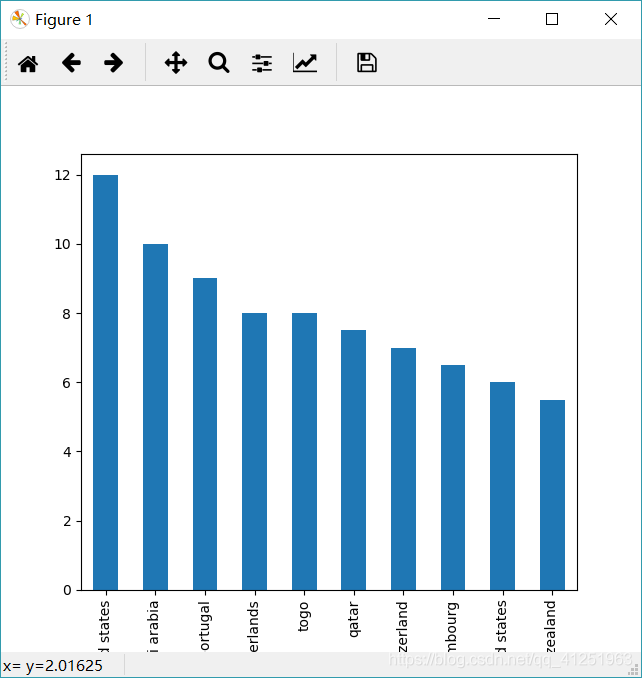
https://www.kaggle.com/openfoodfacts/world-food-facts
import zipfile
import os
import pandas as pd
import matplotlib. pyplot as plt
def unzip ( zip_filepath, dest_path) :
"""
解压zip文件
"""
with zipfile. ZipFile( zip_filepath) as zf:
zf. extractall( path= dest_path)
def get_dataset_filename ( zip_filepath) :
"""
获取数据库文件名
"""
with zipfile. ZipFile( zip_filepath) as zf:
return zf. namelist( ) [ 0 ]
def run_main ( ) :
"""
主函数
"""
dataset_path = './data'
zip_filename = 'open-food-facts.zip'
zip_filepath = os. path. join( dataset_path, zip_filename)
dataset_filename = get_dataset_filename( zip_filepath)
dataset_filepath = os. path. join( dataset_path, dataset_filename)
print ( '解压zip...' , end= '' )
unzip( zip_filepath, dataset_path)
print ( '完成.' )
data = pd. read_csv( dataset_filepath, usecols= [ 'countries_en' , 'additives_n' ] )
data = data. dropna( )
data[ 'countries_en' ] = data[ 'countries_en' ] . str . lower( )
country_additives = data[ 'additives_n' ] . groupby( data[ 'countries_en' ] ) . mean( )
result = country_additives. sort_values( ascending= False )
result. iloc[ : 10 ] . plot. bar( )
plt. show( )
result. to_csv( './country_additives.csv' )
if os. path. exists( dataset_filepath) :
os. remove( dataset_filepath)
if __name__ == '__main__' :
run_main( )


 7633
7633


 被折叠的 条评论
为什么被折叠?
被折叠的 条评论
为什么被折叠?
 到【灌水乐园】发言


