


<template>
<div ref="chart1" class="echarts-box" ></div>
</template>
<script>
export default {
name: 'clothing',
data() {
return {
myChart: '',
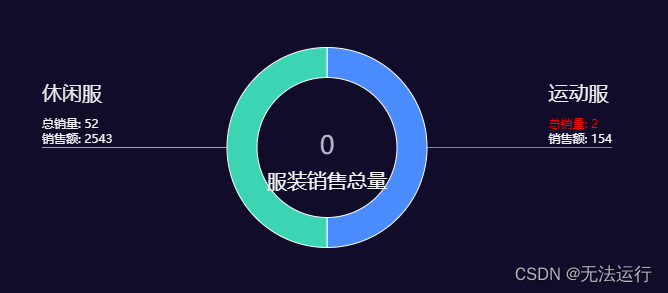
sportsSales:2,
sportsSalesAmount:154,
casualSales:52,
casualSalesAmount:2543,
totalClothingSales:76,
E1_Alarm:false,
E2_Alarm:true,
E5_colour:'#F4F5F7'
}
},
created() {
},
methods: {
getChars(){
var myChart = this.$echarts.init(this.$refs.chart1); //初始化echarts实例
var option;
//环形图各个系列数据项中的名称和值
var datas = [
[
{
value: 5,
name: '运动服',
sportsSales: this.sportsSales,
sportsSalesAmount: this.sportsSalesAmount,
alarm: E1_Alarm
},
{
value: 5,
name: '休闲服',
casualSales: this.casualSales,
casualSalesAmount: this.casualSalesAmount,
alarm: E2_Alarm
}
]
];
// 图表的配置项和数据
option = {
//环形图中间文字(标题)
title: {
text: '{b|' + this.totalClothingSales + '}',
subtext: '{a|服装销售总量}',
subtextStyle: {
rich: {
a: {
fontSize: '20',
color: '#F4F5F7'
}
}
},
textStyle: {
rich: {
b: {
fontSize: '25',
color: this.E5_colour
}
}
},
left: 'center',
top: 'center'
},
series: datas.map(function (data, idx) {
var top = idx * 33.3;
return {
type: 'pie', //图表类型
radius: [70, 100],//饼图的半径,内半径和外半径
top: top + '%',
height: '100%',
left: 'center',
width: 600,
itemStyle: {
borderColor: '#fff',
borderWidth: 1,
color: function (params) {
// 自定义颜色
var colorList = ['#4A8BFE', '#3BD5B3'];
return colorList[params.dataIndex];
}
},
label: {
//'none'(默认值):label line 的长度为固定值; 'labelLine'label line 的 末端对齐; 'edge':文字对齐
alignTo: 'edge',
formatter: (params) => {
if (params.data.name === '运动服') {
if (params.data.alarm) {
return (
'{name|运动服}\n{warning|总销量: ' +
params.data.sportsSales +
'}\n{time|销售额: ' +
params.data.sportsSalesAmount +
'}\n\n\n\n'
);
} else {
return (
'{name|运动服}\n\n{time|总销量: ' +
params.data.sportsSales +
'}\n{time|销售额: ' +
params.data.sportsSalesAmount +
'}\n\n\n\n'
);
}
} else if (params.data.name === '休闲服') {
if (params.data.alarm) {
return (
'{name|休闲服}\n\n{warning|总销量: ' +
params.data.casualSales +
'}\n{time|销售额: ' +
params.data.casualSalesAmount +
'}\n\n\n\n'
);
} else {
return (
'{name|休闲服}\n\n{time|总销量: ' +
params.data.casualSales +
'}\n{time|销售额: ' +
params.data.casualSalesAmount +
'}\n\n\n\n'
);
}
}
},
minMargin: 35,
//文字边距
edgeDistance: 15,
//文字行高
lineHeight: 15,
rich: {
warning: {
fontSize: 12,
color: '#FF0000',
align: 'left'
},
time: {
fontSize: 12,
color: '#F3F4F5',
align: 'left'
},
name: {
fontSize: 20,
color: '#ECEEEF',
align: 'left'
},
me: {
color: '#FFFFFF'
}
}
},
labelLine: {
length: 8, //引导线第一段的长度
length2: 10, //引导项第二段的长度
maxSurfaceAngle: 80 //通过调整第二段线的长度,限制引导线与扇区法线的最大夹角
},
labelLayout: function (params) {
const isLeft = params.labelRect.x < myChart.getWidth() / 2;
const points = params.labelLinePoints;
// Update the end point.
points[2][0] = isLeft
? params.labelRect.x
: params.labelRect.x + params.labelRect.width;
return {
labelLinePoints: points
};
},
data: data
};
})
};
option && myChart.setOption(option);
}
},
mounted () {
this.getChars();
}
}
</script>【注】type 图表类型:
- type: 'bar':柱状/条形图
- type: 'line':折线/面积图
- type: 'pie':饼图
- type: 'scatter':散点(气泡)图
- type: 'effectScatter':带有涟漪特效动画的散点(气泡)
- type: 'radar':雷达图
- type: 'tree':树型图
- type: 'treemap':树型图
- type: 'sunburst':旭日图
- type: 'boxplot':箱形图
- type: 'candlestick':K线图
- type: 'heatmap':热力图
- type: 'map':地图
- type: 'parallel':平行坐标系的系列
- type: 'lines':线图
- type: 'graph':关系图
- type: 'sankey':桑基图
- type: 'funnel':漏斗图
- type: 'gauge':仪表盘
- type: 'pictorialBar':象形柱图
- type: 'themeRiver':主题河流
- type: 'custom':自定义系列
效果如下:


 1920
1920


 被折叠的 条评论
为什么被折叠?
被折叠的 条评论
为什么被折叠?
 到【灌水乐园】发言


