示例
代码
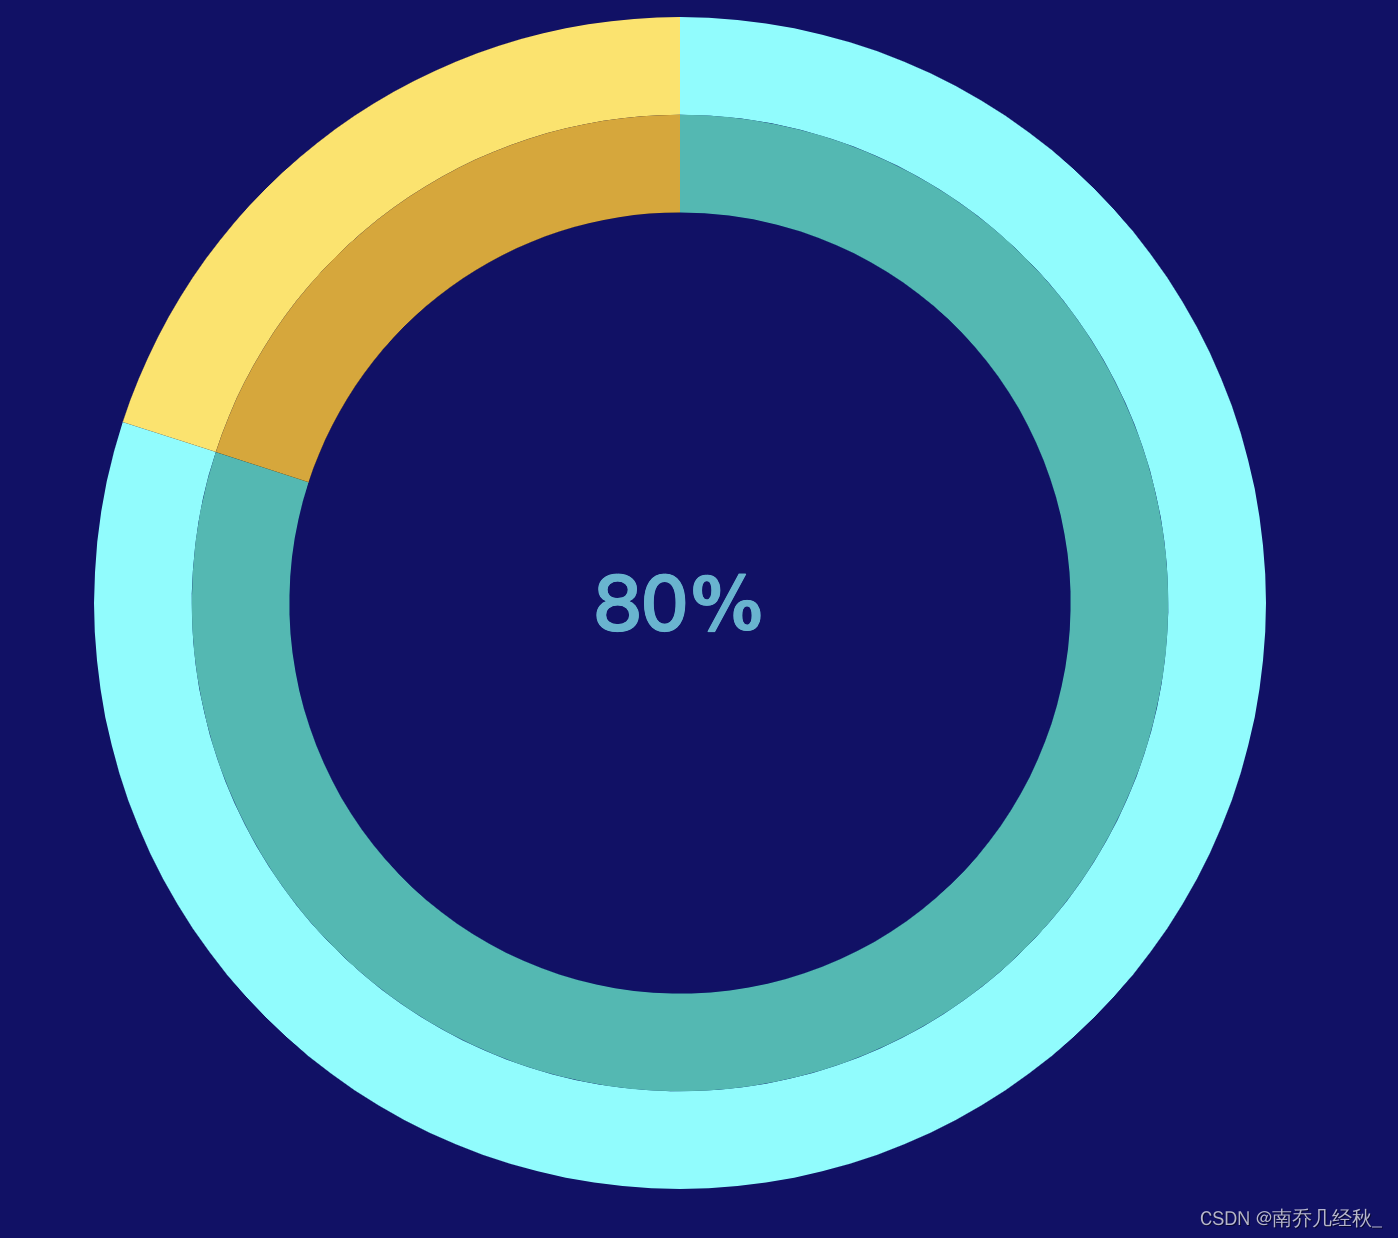
let value = 80
option={
backgroundColor: '#140a69',
tooltip: {
trigger: 'axis',
backgroundColor: 'rgba(69, 14, 255,0.5)',
borderWidth: '0',
textStyle: {
color: '#6DFFFF'
},
axisPointer: {
type: 'shadow'
}
},
title: {
text: `${value}%`,
x: 'center',
y: 'center',
textStyle: {
color: 'rgba(102, 255, 255, 0.7)',
fontSize: 39,
position: 'center'
}
},
series: [
{
type: 'pie',
radius: ['75%', '90%'],
silent: true,
clockwise: true,
startAngle: 90,
z: 0,
zlevel: 0,
label: {
normal: {
position: 'center'
}
},
data: [
{
value: value,
name: '',
itemStyle: {
normal: {
color: '#66FFFF'
}
}
},
{
value: 100 - value,
name: '',
label: {
normal: {
show: false
}
},
itemStyle: {
normal: {
color: '#FFE457'
}
}
}
]
},
{
type: 'pie',
radius: ['60%', '75%'],
silent: true,
clockwise: true,
startAngle: 90,
z: 0,
zlevel: 0,
label: {
normal: {
position: 'center'
}
},
data: [
{
value: value,
name: '',
itemStyle: {
normal: {
color: '#0DBBB3'
}
}
},
{
value: 100 - value,
name: '',
label: {
normal: {
show: false
}
},
itemStyle: {
normal: {
color: '#DEA60F'
}
}
}
]
}
]
}


 9207
9207


 被折叠的 条评论
为什么被折叠?
被折叠的 条评论
为什么被折叠?
 到【灌水乐园】发言


