


Keras的尝试
今天是TensorFlow的一次学习,用的是keras
用到的库有tensorflow, matplotlib.pyplot, pandas
pandas用来导入数据
matplotlib.pyplot用来数据可视化
总的代码如下:
import pandas as pd
import tensorflow as tf
import matplotlib.pyplot as plt
data = pd.read_csv('income_1.csv')
# print(data)
plt.scatter(data.Education, data.income)
# plt.show()
x = data.Education
y = data.income
model = tf.keras.Sequential()
model.add(tf.keras.layers.Dense(2, input_shape=(1,)))
# model.summary()
model.compile(optimizer='adam',
loss='mse'
)
history = model.fit(x, y, epochs=5000)
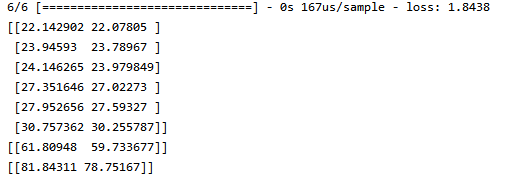
print(model.predict(x))
print(model.predict(pd.Series([30])))
print(model.predict(pd.Series([40])))
各部分详解
import pandas as pd
import tensorflow as ts
import matplotlib.pyplot as plt

data = pd.read_csv('income_1.csv')
print(data)
plt.scatter(data.Education, data.income)
plt.show()
model = tf.keras.Sequential()
model.add(tf.keras.layers.Dense(1, input_shape=(1,)))
创建一个Sequential模型
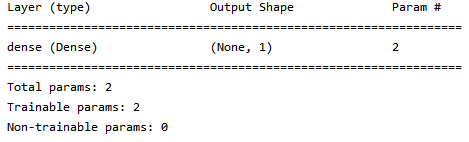
model.add(tf.keras.layers.Dense(输出数据维度, input_shape=(输入数据形状_需要是元组,)))
model.add(tf.keras.layers.Dense(1, input_shape=(1,))) # ax + b
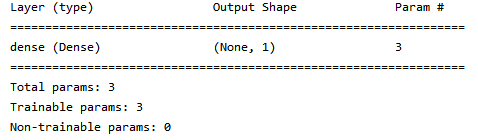
model.add(tf.keras.layers.Dense(1, input_shape=(2,)))
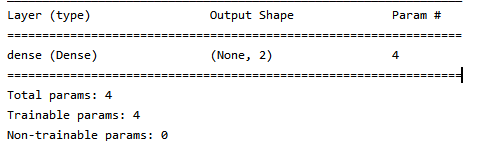
model.add(tf.keras.layers.Dense(2, input_shape=(1,)))
model.compile(optimizer='adam',
loss='mse'
)
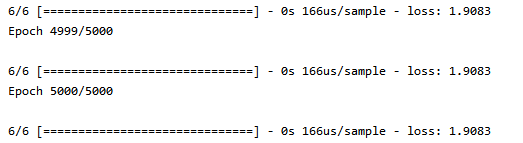
history = model.fit(x, y, epochs=5000)
创建compile,optimizer是adam,损失函数loss是mse即mean square error均方误差
然后进行训练,epochs代表训练次数
print(model.predict(x))
print(model.predict(pd.Series([30])))
print(model.predict(pd.Series([40])))
使用模型进行预测


 1020
1020


 被折叠的 条评论
为什么被折叠?
被折叠的 条评论
为什么被折叠?
 到【灌水乐园】发言


