


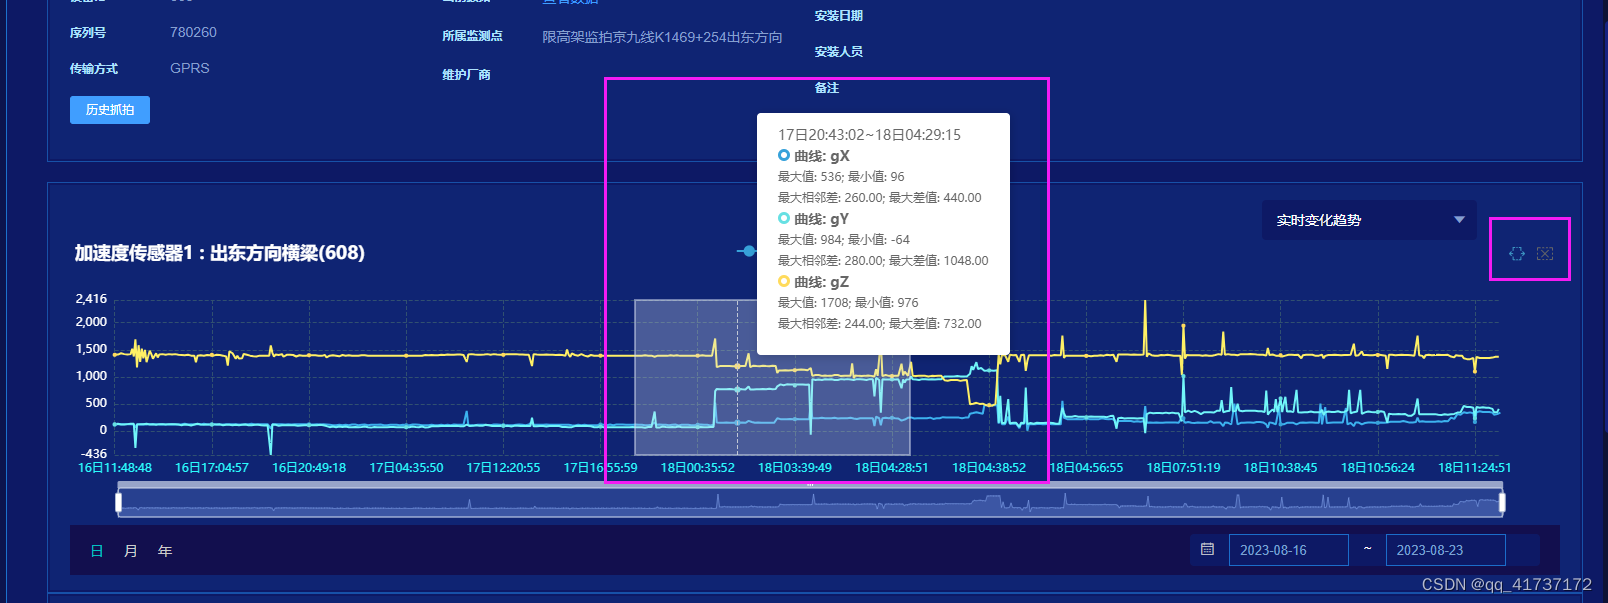
echart 图表添加数据分析功能,可区域选择数据,右上按钮,控制echart行为
    chart.on('globalcursortaken', onGlobalcursortaken); //绑定事件
    chart.off("brushSelected");//解绑事件处理函数
    chart.on('brushSelected', renderBrushed);
   getBarDev2(eIndex, eTimeArr, eSeriesArr, eSensorId, eDeviceId, eDeviceType) {
        //console.log('EEEEEEE', eIndex, eTimeArr, eSeriesArr, eSensorId, eDeviceId, eDeviceType)
        this.$refs.chart.removeAttribute('_echarts_instance_')
        const chart = this.$echarts.init(this.$refs.chart, 'light')
        var option;
        option = {
          title: {
            text: eSensorId + " : " + eDeviceId,
            textStyle: {
              //文字颜色
              color: '#fff',
            }
          },
          textStyle: {
            color: '#fff',//'red',字体颜色
          },
          legend: {
            textStyle: {
              //文字颜色
              color: '#fff',
            }
          },
          tooltip: {
            trigger: 'axis',
            show: true,
            formatter: (params) => {
              var listData = params
              var list = []
              var listItem = ''
              var html = ''
              html += '<span>' + listData[0].name + '<span><br>'
              for (var i = 0; i < listData.length; i++) {
                html += '<i style="display: inline-block;width: 10px;height: 10px;background: ' +
                  listData[i].color +
                  ';margin-right: 5px;border-radius: 50%;}"></i><span style="width:70px; display:inline-block;">' +
                  listData[i].seriesName +
                  ': ' +
                  listData[i].data +
                  '</span><br>'
              }
              list.push(html)
              listItem = list.join('<br>')
              return '<div class="showBox">' + listItem + '</div>'
            }
          },
          grid: {
            left: '3%',
            right: '4%',
            // bottom: '5%',
            // containLabel: true
          },
          xAxis: {
            type: 'category',
            boundaryGap: false,
            data: eTimeArr,
            axisLabel: {
              textStyle: {
                color: "#2afcfd",
              },
            },
            axisLine: {
              lineStyle: {
                color: ["#2afcfd"],
                width: 0,
                type: "dashed",
              },
            },
            splitLine: {
              show: true,
              lineStyle: {
                color: ["#315070"],
                width: 1,
                type: "dashed",
              },
            },
          },
          yAxis: {
            type: 'value',
            min: 'dataMin',
            max: "dataMax",
            axisLabel: {
              textStyle: {
                color: "#fff",
              },
              boundaryGap: [0, '100%']
            },
            axisLine: {
              lineStyle: {
                onZero: false,
                color: ["#859fce"],
                // width: 0,
                // type: "dashed",
              },
            },
            splitLine: {
              show: true,
              lineStyle: {
                color: ["#315070"],
                width: 1,
                type: "dashed",
              },
            },
          },
          dataZoom: [
            {
              type: 'slider',
              show: true,
              xAxisIndex: [0],
              bottom: "auto",
            }
          ],
          toolbox: {
            feature: {
              brush: {
                title: {
                  lineX: '数据分析'
                }
              },
              //自定义关闭按钮
              myClear: {
                show: true,
                title: '退出分析',
                icon: 'path://M22,14.7l30.9,31 M52.9,14.7L22,45.7 M4.7,16.8V4.2h13.1 M26,4.2h7.8 M41.6,4.2h7.8 M70.3,16.8V4.2H57.2 M4.7,25.9v8.6 M70.3,25.9v8.6 M4.7,43.2v12.6h13.1 M26,55.8h7.8 M41.6,55.8h7.8 M70.3,43.2v12.6H57.2',
                onclick: function () {
                  //brush状态
                  chart.dispatchAction({
                    type: 'takeGlobalCursor'
                  });
                  //清除选区
                  chart.dispatchAction({
                    type: 'brush',
                    areas: []
                  });
                }
              },
            }
          },
          brush: {
            toolbox: ['lineX'],
            xAxisIndex: 0,
            throttleType: 'debounce',
            throttleDelay: 600,
            //『单击清除所有选框』
            removeOnClick: false
          },

          series: eSeriesArr
        };
        chart.setOption(option, true)

        //brush状态事件
        chart.on('globalcursortaken', onGlobalcursortaken);
        function onGlobalcursortaken(params) {
          //可以根据 params.brushOption.brushType = false 来判断是否退出刷选状态。此处无论进入或者退出状态都清空选取即可
          chart.dispatchAction({
            type: 'brush',
            areas: []
          });
        }

        chart.off("brushSelected");//解绑事件处理函数(可根据情况而定是否需要,这里我这边会重绘几次表,所以需要解绑事件处理函数)。
        chart.on('brushSelected', renderBrushed);

        function renderBrushed(params) {

          // console.log('renderBrushed', params);
          var brushed = [];
          var brushComponent = params.batch[0];
          var selArea = params.batch[0].areas[0] ? params.batch[0].areas[0].coordRange : ''

          var selIdxs = []
          var selTimes = []
          var selDatas = []
          for (var sIdx = selArea[0]; sIdx <= selArea[1]; sIdx++) {
            selIdxs.push(sIdx)
            selTimes.push(eTimeArr[sIdx])
          }

          eSeriesArr.forEach((e, i) => {
            var obj = {
              name: e.name,
              data: []
            }
            selDatas.push(obj)
            selIdxs.forEach(item => {
              selDatas[i].data.push(e.data[item])
            });
          });

          // console.log('selTimes', selTimes)
          // console.log('selDatas', selDatas)

          //最大值,最小值,最大相邻差,最大差值
          // var paramsArr = params.batch[0].selected
          // console.log('paramsArr', paramsArr)

          selDatas.forEach((e, i) => {
            e['startTime'] = selTimes[0]
            e['endTime'] = selTimes[selTimes.length - 1]
            e['maxVal'] = Math.max(...e.data)
            e['minVal'] = Math.min(...e.data)
            e['maxGap'] = maximumGap(e.data)
            e['maxDiff'] = maximunDiff(e.data)
          });

          // console.log('selDatas', selDatas)
          // console.log('params', params)

          if (selIdxs.length > 0) {
            chart.setOption({
              tooltip: {
                show: true,
                formatter: function (params) {
                  selDatas.forEach((e, i) => {
                    params.forEach((pe, pi) => {
                      if (e.name == pe.seriesName) {
                        e['color'] = pe.color
                      }
                    });
                  });

                  var list = []
                  var listItem = ''
                  var html = ''
                  html += '<span>' + selDatas[0].startTime + '~' + selDatas[0].endTime + '<span><br>'
                  selDatas.forEach((e, i) => {
                    if (e.color) {
                      html +=
                        "<div style='font-size: 14px; font-weight:bold;'>" +
                        "<div class='yuan' style='width: 12px;height: 12px;background: #ffffff;border-radius: 50%;display: inline-block;border: 3px solid " + e.color + "; '></div>" +
                        " 曲线: <span>" + e.name + "</span>" +
                        "</div>" +
                        "<p style='font-size: 12px;'>最大值: " + e.maxVal + "; 最小值: " + e.minVal + "</p>" +
                        "<p style='font-size: 12px;'>最大相邻差: " + e.maxGap + "; 最大差值: " + e.maxDiff + "</p>"
                    }
                  });
                  list.push(html)
                  listItem = list.join('<br>')
                  return '<div style="margin: 0px 10px 10px 10px; ">' + listItem + '</div>'
                },
              }
            });
          } else {
            chart.setOption({
              tooltip: {
                show: true,
                formatter: (params) => {
                  var listData = params
                  var list = []
                  var listItem = ''
                  var html = ''
                  html += '<span>' + listData[0].name + '<span><br>'
                  for (var i = 0; i < listData.length; i++) {
                    html += '<i style="display: inline-block;width: 10px;height: 10px;background: ' +
                      listData[i].color +
                      ';margin-right: 5px;border-radius: 50%;}"></i><span style="width:70px; display:inline-block;">' +
                      listData[i].seriesName +
                      ': ' +
                      listData[i].data +
                      '</span><br>'
                  }
                  list.push(html)
                  listItem = list.join('<br>')
                  return '<div class="showBox">' + listItem + '</div>'
                }
              }
            });
          }

          function maximumGap(nums) {
            if (nums) {
              if (nums.length < 2) return 0
              nums.sort((a, b) => a - b)
              let max = nums[1] - nums[0]
              for (let i = 0; i < nums.length - 1; i++) {
                max = Math.max(max, nums[i + 1] - nums[i])
              }
              return max.toFixed(2)
            }
          }

          function maximunDiff(arr) {
            var max = Math.max.apply(null, arr);
            var min = Math.min.apply(null, arr);
            return (max - min).toFixed(2);
          }
          // brushSelected over
        }
        //over
      },


 625
625


 被折叠的 条评论
为什么被折叠?
被折叠的 条评论
为什么被折叠?
 到【灌水乐园】发言


