


一、概括
前面部分中,我们已经对 WRF 的安装和基础运行进行了介绍,本次内容分享主要一下 WRF 模拟中所使用的网格嵌套和土地类型如何使用 python 进行绘制。
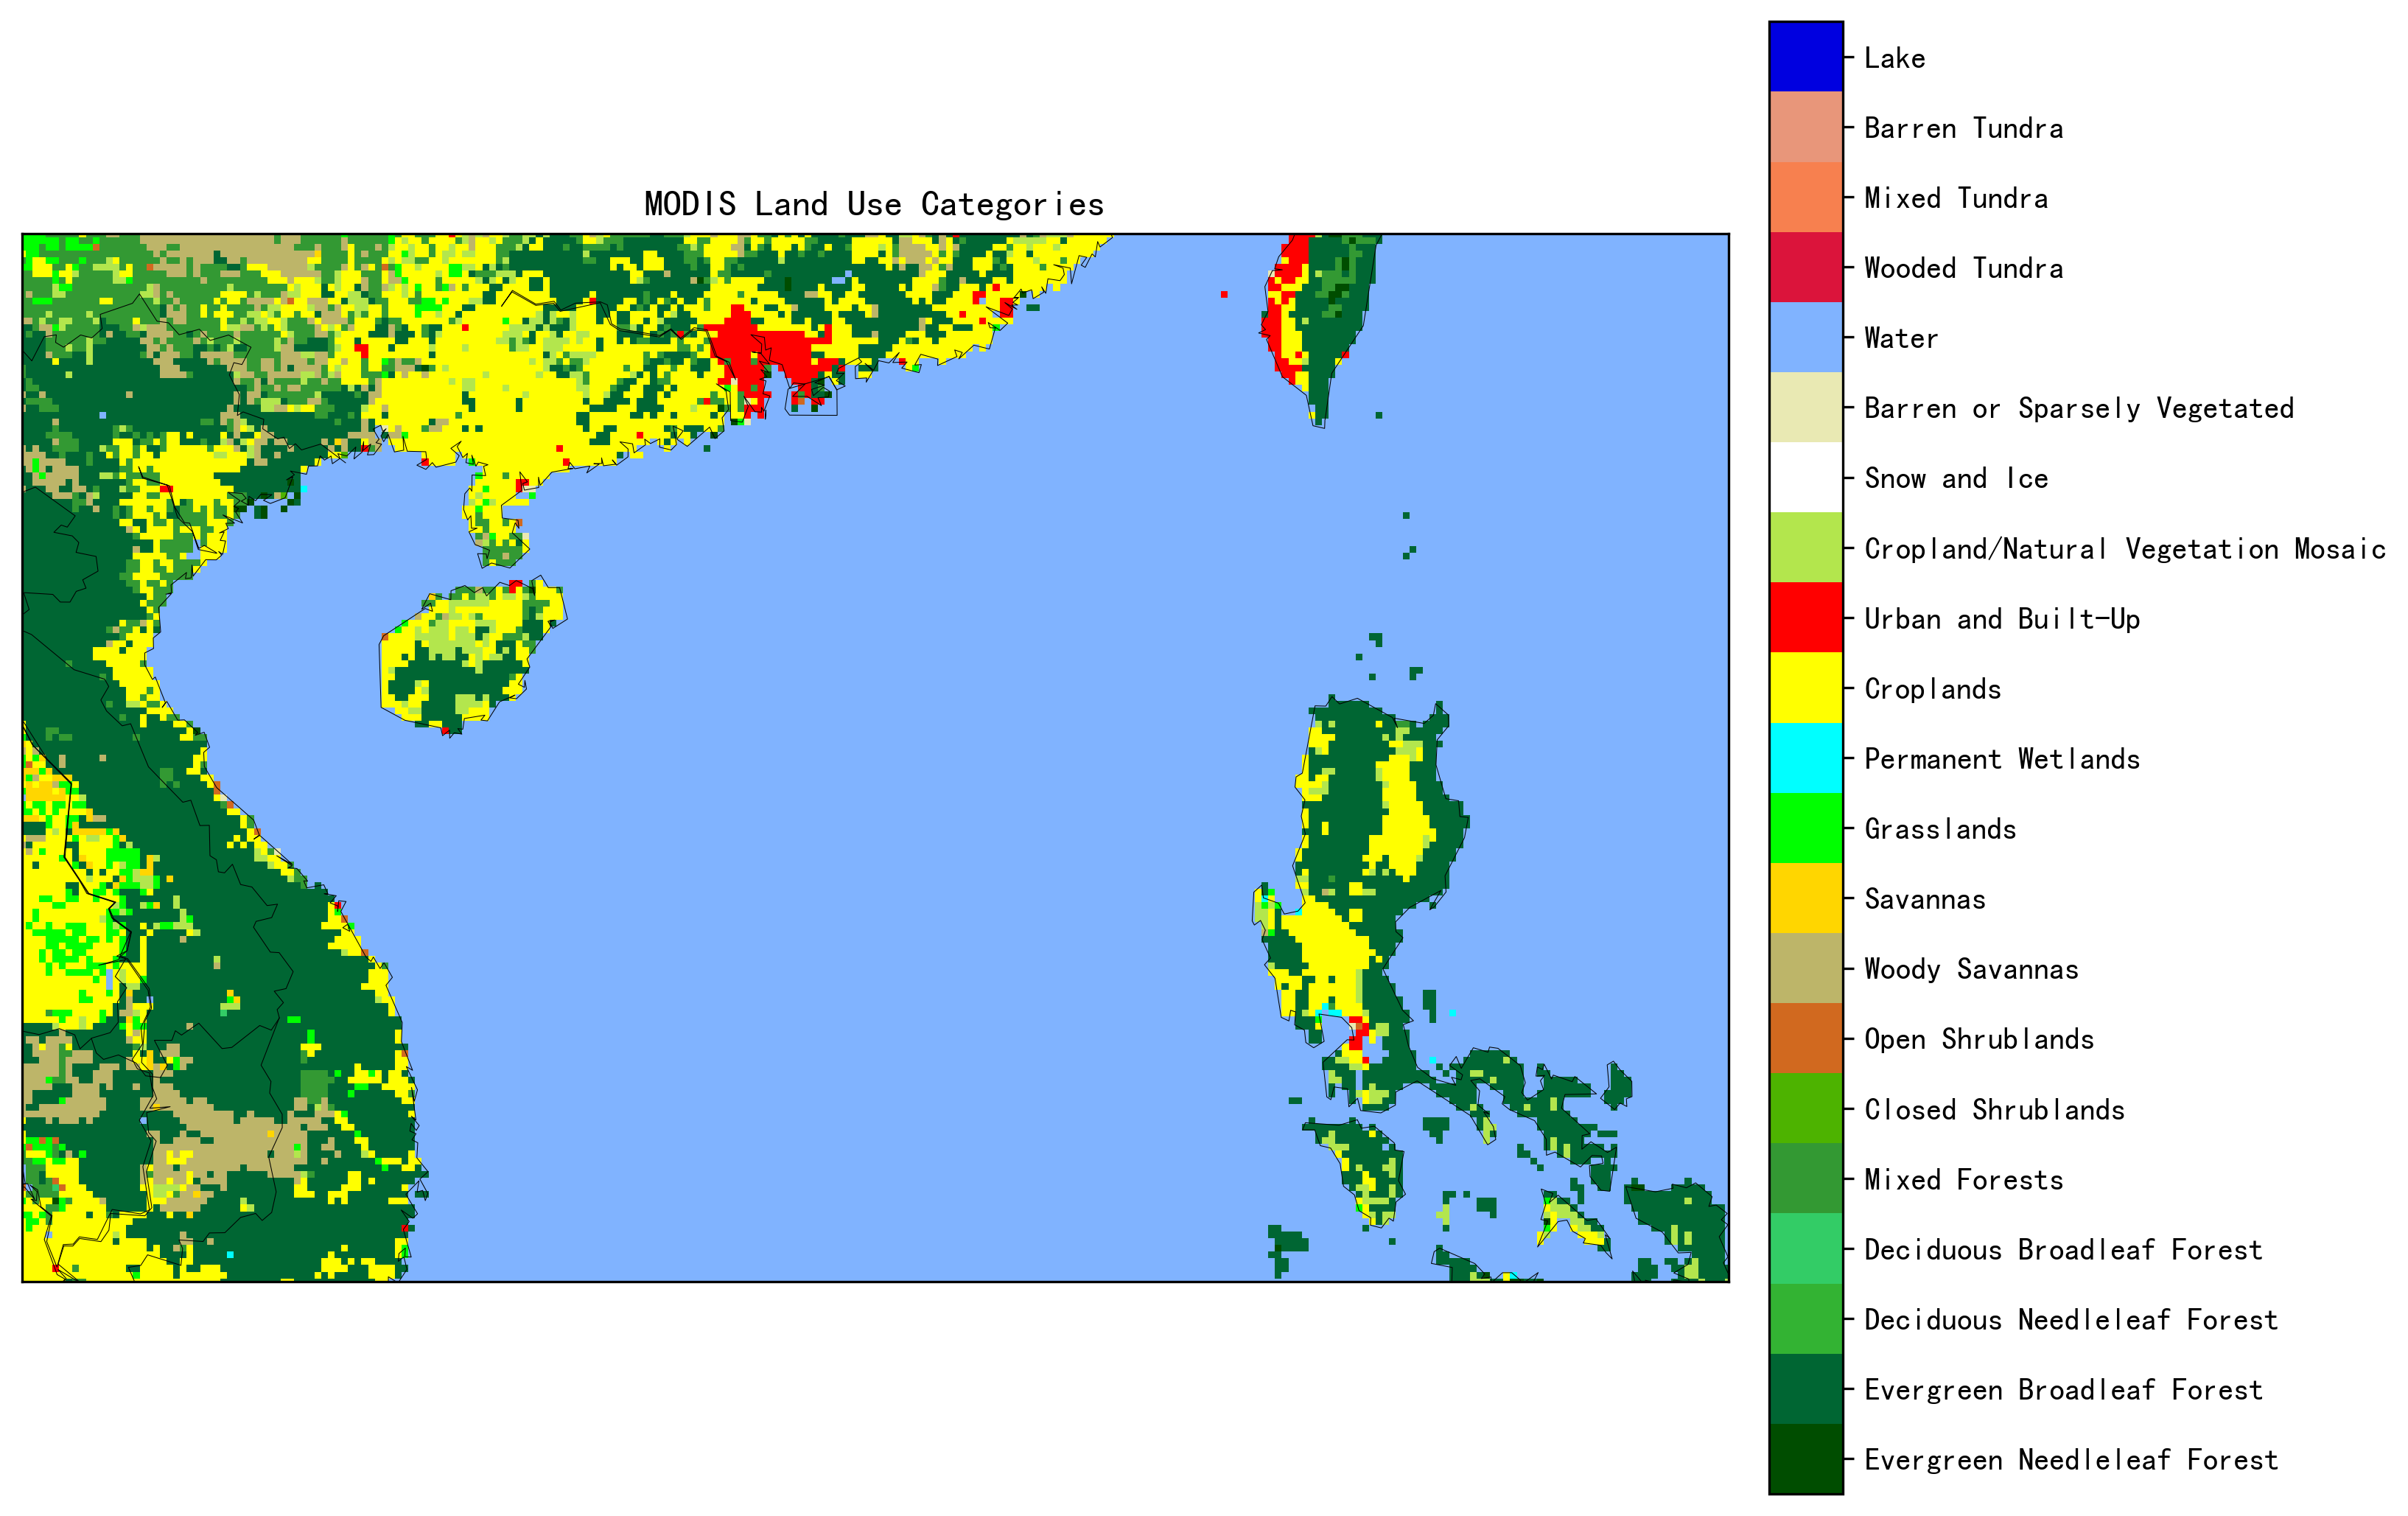
二、土地类型
2.1 结果
2.2 主程序
# 土地类型
from netCDF4 import Dataset
import matplotlib.pyplot as plt
from matplotlib.cm import get_cmap
from mpl_toolkits.basemap import Basemap
from landuse_colormap import *

from wrf import to_np, getvar, smooth2d, get_basemap, latlon_coords

path=r'D:\Project\wrfout_d01_2023-07-01_06_00_00'
ncfile = Dataset(path)

LU_INDEX = getvar(ncfile, "LU_INDEX")

lats, lons = latlon_coords(LU_INDEX)

# Get the basemap object
bm = get_basemap(LU_INDEX)

# Create a figure
fig = plt.figure(figsize=(12,9))

# Add geographic outlines
bm.drawcoastlines(linewidth=0.25)
bm.drawstates(linewidth=0.25)
bm.drawcountries(linewidth=0.25)

# Convert the lats and lons to x and y.  Make sure you convert the lats and
# lons to numpy arrays via to_np, or basemap crashes with an undefined
# RuntimeError.
x, y = bm(to_np(lons), to_np(lats))

cm,labels = LU_MODIS21()
im = plt.pcolormesh(x,y,to_np(LU_INDEX),cmap=cm,vmax=len(labels)+1,vmin=1)
cbar = plt.colorbar(orientation='vertical',shrink=.98,pad=.02)
cbar.set_ticks(np.arange(1.5,len(labels)+1))
cbar.ax.set_yticklabels(labels)
plt.title('MODIS Land Use Categories')
plt.savefig('1.png',bbox_inches='tight',dpi=300)
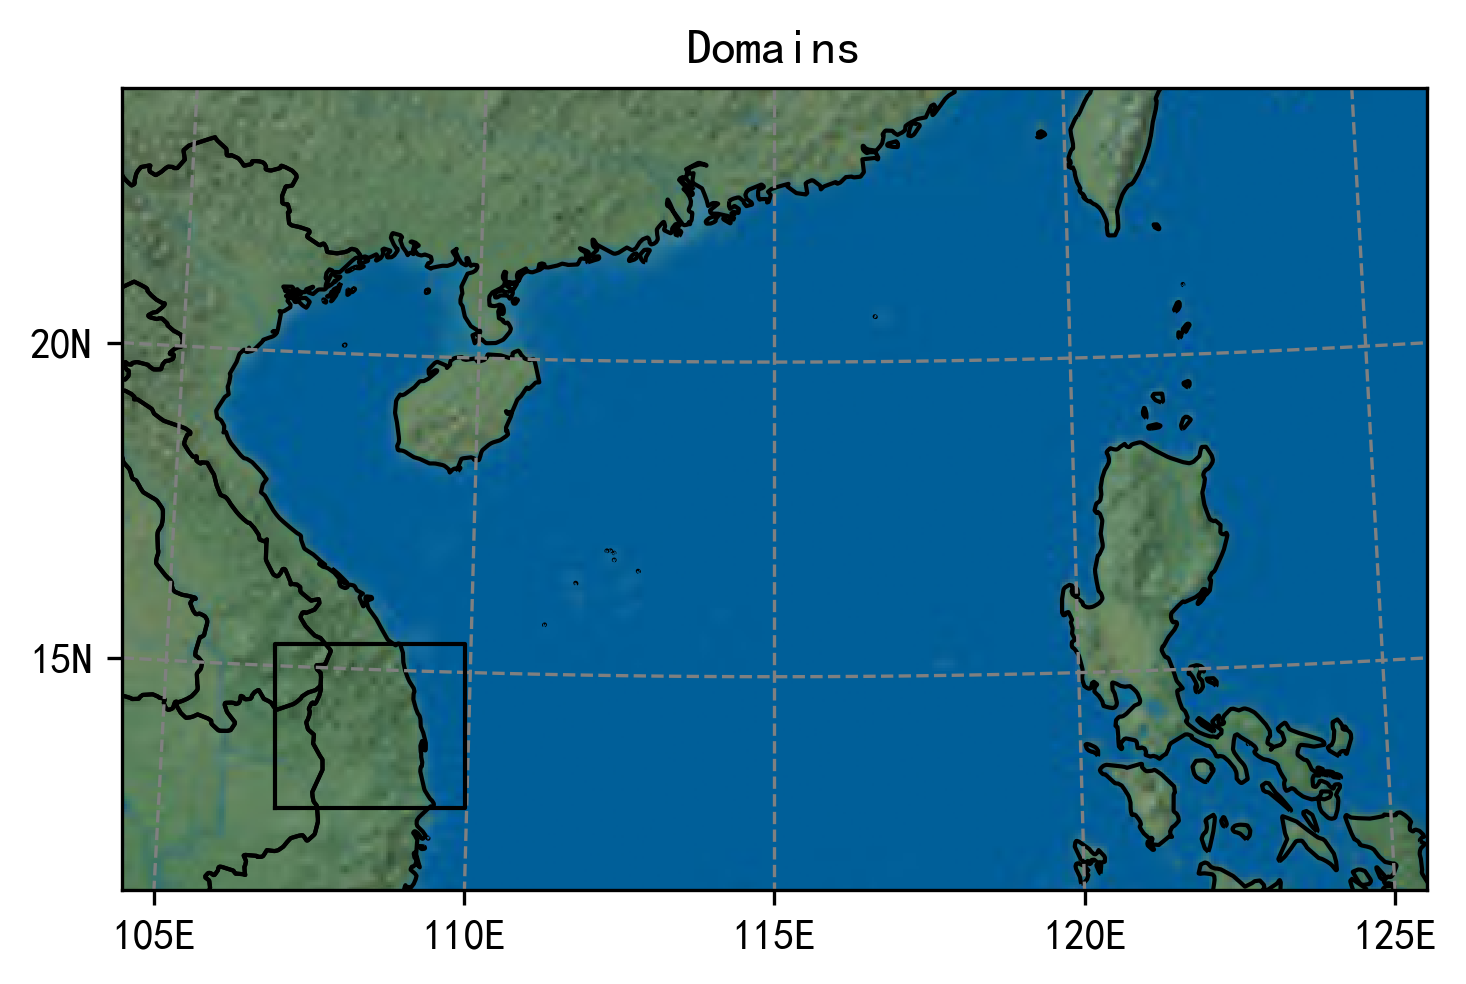
三、网格嵌套
3.1 结果
3.2 主程序
from salem import geogrid_simulator
import matplotlib.gridspec as gridspec
import matplotlib.pyplot as plt

namelist_path = r'D:\Project\namelist.wps' # ensure no comments in namelist
g, maps = geogrid_simulator(namelist_path)
print(maps)
fig = plt.figure(1, figsize=(5, 5))
gs = gridspec.GridSpec(1, 1)
ax = fig.add_subplot(gs[0])

# 添加自定义shape文件
# maps[0].set_shapefile(r"/home/province_9south.shp")

# 绘制所有domain
maps[0].set_rgb(natural_earth='lr')
maps[0].visualize(title='Domains')
'''
# 单独绘制d02
maps[1].set_rgb(natural_earth='lr')
maps[1].visualize(title='Domains')
'''
gs.tight_layout(fig)
plt.show()


 582
582

 被折叠的 条评论
为什么被折叠?
被折叠的 条评论
为什么被折叠?
 到【灌水乐园】发言


