


广告点击率是指有多少用户点击了您的广告与有多少用户查看了您的广告的比率。例如,100个用户中有5个在观看XX视频时点击了广告。因此,在这种情况下,XX广告的CTR将是5%。分析点击率有助于公司为目标受众找到最佳广告。所以,如果你想学习如何用机器学习分析和预测广告点击率,这篇文章是为你准备的。本文将带您了解使用Python进行机器学习的广告点击率预测。
广告点击率预测
广告点击率预测是指预测用户是否会点击广告。在广告点击率预测的任务中,我们需要训练一个机器学习模型来找到所有点击广告的用户特征之间的关系。
导入必要的Python库和数据集来开始任务:
import pandas as pd
import plotly.graph_objects as go
import plotly.express as px
import plotly.io as pio
import numpy as np
pio.templates.default = "plotly_white"

data = pd.read_csv("ad_10000records.csv")
print(data.head())
输出
   Daily Time Spent on Site   Age  Area Income  Daily Internet Usage  \
0                     62.26  32.0     69481.85                172.83
1                     41.73  31.0     61840.26                207.17
2                     44.40  30.0     57877.15                172.83
3                     59.88  28.0     56180.93                207.17
4                     49.21  30.0     54324.73                201.58

                         Ad Topic Line             City  Gender  \
0      Decentralized real-time circuit         Lisafort    Male
1       Optional full-range projection  West Angelabury    Male
2  Total 5thgeneration standardization        Reyesfurt  Female
3          Balanced empowering success      New Michael  Female
4  Total 5thgeneration standardization     West Richard  Female

                        Country            Timestamp  Clicked on Ad
0  Svalbard & Jan Mayen Islands  2016-06-09 21:43:05              0
1                     Singapore  2016-01-16 17:56:05              0
2                    Guadeloupe  2016-06-29 10:50:45              0
3                        Zambia  2016-06-21 14:32:32              0
4                         Qatar  2016-07-21 10:54:35              1
“广告点击”列包含0和1值,其中0表示未点击,1表示点击。将这些值转换为“yes”和“no”:
data["Clicked on Ad"] = data["Clicked on Ad"].map({0: "No",
                               1: "Yes"})
点击率分析
现在让我们根据用户在网站上花费的时间来分析点击率:
fig = px.box(data,
             x="Daily Time Spent on Site",
             color="Clicked on Ad",
             title="Click Through Rate based Time Spent on Site",
             color_discrete_map={'Yes':'blue',
                                 'No':'red'})
fig.update_traces(quartilemethod="exclusive")
fig.show()
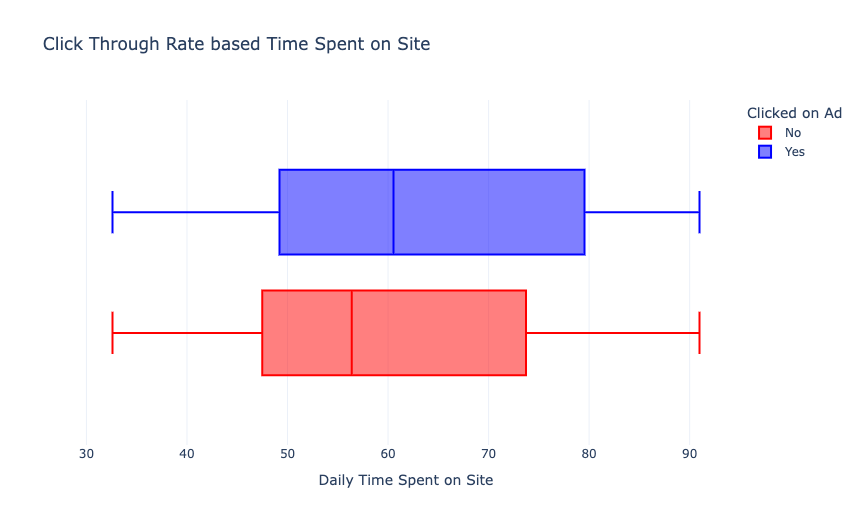
从上面的图表中,我们可以看到,在网站上花费更多时间的用户点击更多的广告。现在我们根据用户的日常互联网使用情况来分析一下点击率:
fig = px.box(data,
             x="Daily Internet Usage",
             color="Clicked on Ad",
             title="Click Through Rate based on Daily Internet Usage",
             color_discrete_map={'Yes':'blue',
                                 'No':'red'})
fig.update_traces(quartilemethod="exclusive")
fig.show()
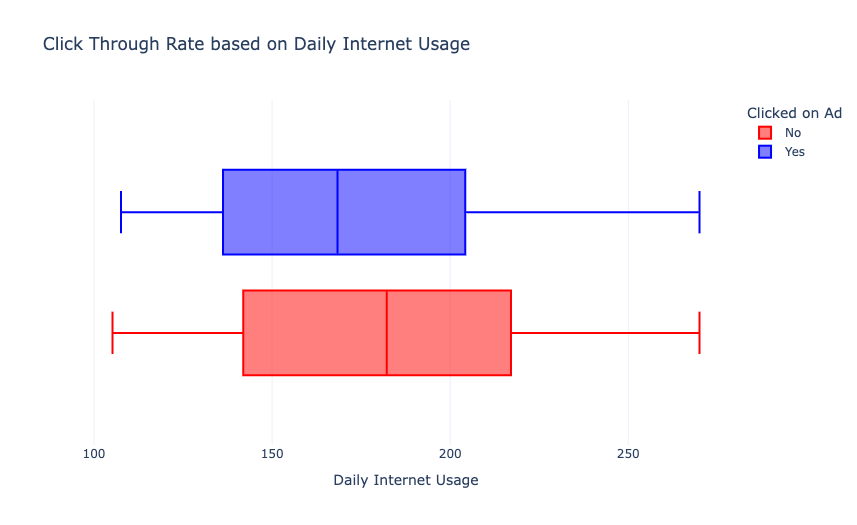
从上图中,我们可以看到,与互联网使用率较低的用户相比,互联网使用率较高的用户点击广告较少。现在我们根据用户的年龄来分析一下点击率:
fig = px.box(data,
             x="Age",
             color="Clicked on Ad",
             title="Click Through Rate based on Age",
             color_discrete_map={'Yes':'blue',
                                 'No':'red'})
fig.update_traces(quartilemethod="exclusive")
fig.show()
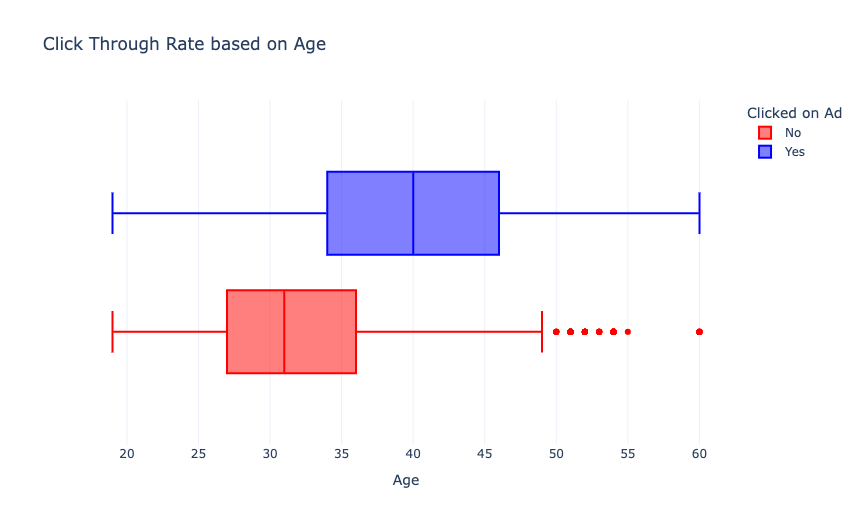
从上图中我们可以看到,40岁左右的用户比27-36岁左右的用户点击广告更多。现在我们根据用户的收入来分析一下点击率:
fig = px.box(data,
             x="Area Income",
             color="Clicked on Ad",
             title="Click Through Rate based on Income",
             color_discrete_map={'Yes':'blue',
                                 'No':'red'})
fig.update_traces(quartilemethod="exclusive")
fig.show()
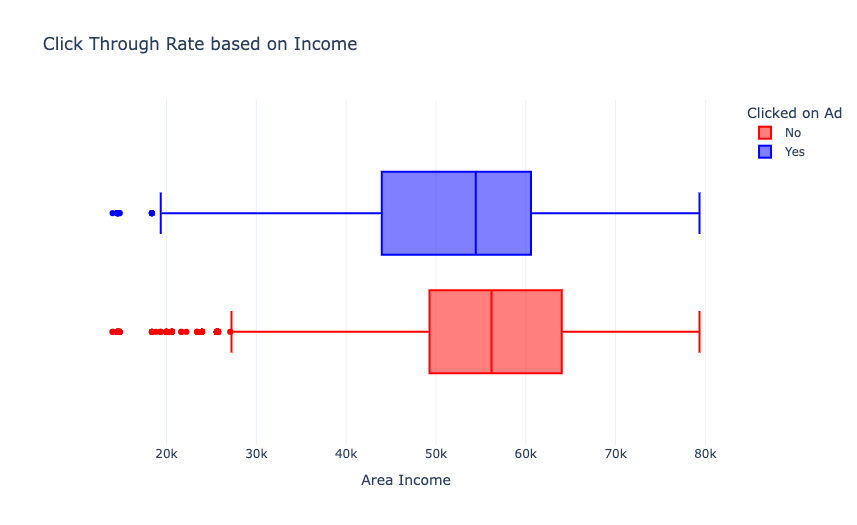
没有太大的差别,但来自高收入地区的人点击广告的次数更少。
计算广告的点击率
现在让我们来计算整体广告点击率。在这里,我们需要计算点击广告的用户与对广告留下印象的用户的比例。让我们来看看用户的分布:
data["Clicked on Ad"].value_counts()
输出
No     5083
Yes    4917
Name: Clicked on Ad, dtype: int64
因此,10000名用户中有4917人点击了广告。让我们计算CTR:
click_through_rate = 4917 / 10000 * 100
print(click_through_rate)
输出
49.17
所以CTR是49.17。
点击率预测模型
现在让我们继续训练机器学习模型来预测点击率。首先,将把数据分成训练集和测试集:
data["Gender"] = data["Gender"].map({"Male": 1,
                               "Female": 0})

x=data.iloc[:,0:7]
x=x.drop(['Ad Topic Line','City'],axis=1)
y=data.iloc[:,9]

from sklearn.model_selection import train_test_split
xtrain,xtest,ytrain,ytest=train_test_split(x,y,
                                           test_size=0.2,
                                           random_state=4)
现在让我们使用随机森林分类算法来训练模型:
from sklearn.ensemble import RandomForestClassifier
model = RandomForestClassifier()
model.fit(x, y)
现在让我们来看看模型的准确性:
from sklearn.metrics import accuracy_score
print(accuracy_score(ytest,y_pred))
输出
0.9615
现在让我们通过预测来测试模型:
print("Ads Click Through Rate Prediction : ")
a = float(input("Daily Time Spent on Site: "))
b = float(input("Age: "))
c = float(input("Area Income: "))
d = float(input("Daily Internet Usage: "))
e = input("Gender (Male = 1, Female = 0) : ")

features = np.array([[a, b, c, d, e]])
print("Will the user click on ad = ", model.predict(features))
输出
Ads Click Through Rate Prediction :
Daily Time Spent on Site: 62.26
Age: 28
Area Income: 61840.26
Daily Internet Usage: 207.17
Gender (Male = 1, Female = 0) : 0
Will the user click on ad =  ['No']
总结
这就是如何使用机器学习来完成使用Python进行广告点击率预测的任务。广告点击率意味着预测用户是否会点击广告。在这个任务中,我们需要训练一个机器学习模型,以找到所有点击广告的用户特征之间的关系。以上是使用Python进行广告点击率预测的案例应用。


 被折叠的 条评论
为什么被折叠?
被折叠的 条评论
为什么被折叠?
 到【灌水乐园】发言


