echarts-for-vue使用
1. 下载
npm i -S echarts-for-vue
yarn add echarts-for-vue
2. 引入
2.1. vue3
import { createApp, h } from 'vue';
import { plugin } from 'echarts-for-vue';
import * as echarts from 'echarts';
const app = createApp({ });
app.use(plugin, { echarts, h });
2.2. vue2
import Vue from 'vue';
import { plugin } from 'echarts-for-vue';
import * as echarts from 'echarts';

Vue.use(plugin, { echarts });
3. 使用
<ECharts ref="chart" :option="option" />
4. 事件绑定
<ECharts :events="[['click', onChart]]" :option="lineOption" />

提示: 事件默认属性e, 可以有多个事件
onChart(e)=>{
 console.log(e)
}
5. 其他属性

6. 方法
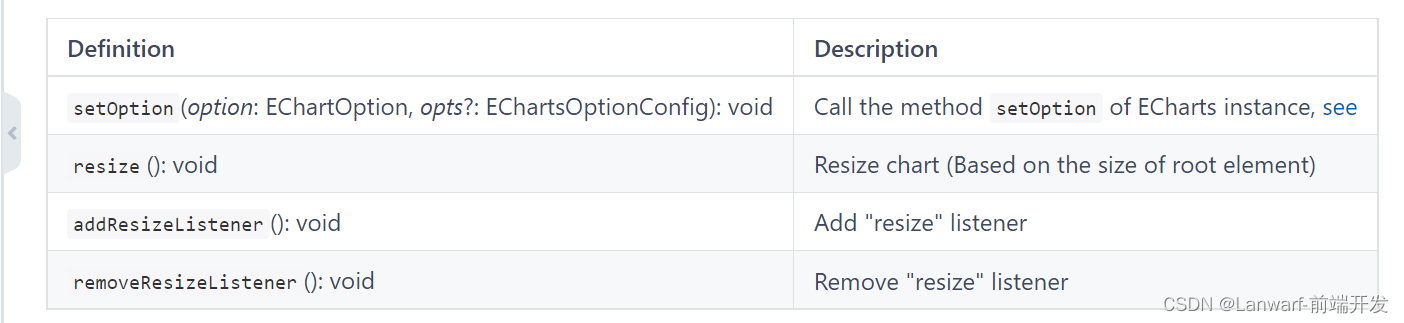
- 注意: echarts y轴可能会过滤数值0,导致点击有问题


 1571
1571


 被折叠的 条评论
为什么被折叠?
被折叠的 条评论
为什么被折叠?
 到【灌水乐园】发言


