


目录
groupby分组
例如:grouped=df.groupby(by="columns_name") #df中的数据按照"columns_name"这列进行分组
- grouped是一个DataFrameGroupBy对象,是可迭代的
- grouped中的每一个元素是一个元组,元组里面包含的是(索引(分组的值),分组之后的DataFrame
#coding=utf-8
import pandas as pd
file_path="./directory.csv"
df=pd.read_csv(file_path)
#print(df.head(1))
#print(df.info())
grouped=df.groupby(by="Country") #按国家进行分组
print(grouped)
print(type(grouped))


运行结果:
<pandas.core.groupby.generic.DataFrameGroupBy object at 0x0000021FE373E148>
<class 'pandas.core.groupby.generic.DataFrameGroupBy'>注意:只对数据集进行分组操作,将不会显示结果,只会生成一个分组的对象,只有分组后进行聚合运算才有实际结果
聚合运算
DataFrameGroupBy对象有很多经过优化的方法

#调用聚合方法

# 单个条件分组,再按照某列进行统计
 country_count=df.groupby(by="Country")["Brand"].count()


#数据按照多个条件进行分组,在对"Brand"标签这列进行统计
 grouped=df["Brand"].groupby(by=[df["Country"],df["State/Province"]]).count()
 print(grouped)
 print(type(grouped))
 print("-"*100)

#数据按照多个条件进行分组,返回DataFrame(有3种写法)
 grouped1=df[["Brand"]].groupby(by=[df["Country"],df["State/Province"]]).count()
 grouped2=df.groupby(by=[df["Country"],df["State/Province"]])[["Brand"]].count()
 grouped3=df.groupby(by=[df["Country"],df["State/Province"]]).count()[["Brand"]]
 print(grouped1,type(grouped1))
 print("*"*100)
 print(grouped2,type(grouped2))
 print("+"*100)
 print(grouped3,type(grouped3))


#前者grouped的数据类型是<class 'pandas.core.series.Series'>
#而grouped1,grouped2,grouped3都是<class 'pandas.core.frame.DataFrame'>
索引和复合索引
简单的索引操作:
•
获取
index
:
df.index
•
指定
index
:
df.index
=
['
x','y
']
•
重新设置
index
:
df.reindex
(list("
abcedf
"))
•
指定某一
列的内容作为
index
:
df.set_index
("
Country",drop=False) #
drop
为假表示保留之前列充当索引的列,默认情况下充当索引的列"Country"删除
•
返回
index
的唯一值:
df.set_index
("Country").
index.unique
() #unique()可以对index去除重复值
例题:
假设a为一个DataFrame,那么当a.set_index(["c","d"])即设置两个索引的时候是什么样子的结果呢?另外Series和DataFrame类型复合索引取值有什么区别呢?
a = pd.DataFrame({'a': range(7),'b': range(7, 0, -1),'c': ['one','one','one','two','two','two', 'two'],'d': list("hjklmno")})
In [1]: import pandas as pd

In [2]: a = pd.DataFrame({'a': range(7),'b': range(7, 0, -1),'c': ['one','one','one','two','two','two', 'two'],'d': lis
   ...: t("hjklmno")})

In [3]: a
Out[3]:
   a  b    c  d
0  0  7  one  h
1  1  6  one  j
2  2  5  one  k
3  3  4  two  l
4  4  3  two  m
5  5  2  two  n
6  6  1  two  o

In [5]: b= a.set_index(["c","d"])

In [6]: b
Out[6]:
       a  b
c   d
one h  0  7
    j  1  6
    k  2  5
two l  3  4
    m  4  3
    n  5  2
    o  6  1
In [7]: c=b["a"]

In [8]: c
Out[8]:
c    d
one  h    0
     j    1
     k    2
two  l    3
     m    4
     n    5
     o    6
Name: a, dtype: int64

In [9]: type(c)
Out[9]: pandas.core.series.Series


#对Series类型取索引,直接在中括号里写索引标签就可以了
In [10]: c["one"]["j"]
Out[10]: 1

In [11]:  c["one"]
Out[11]:
d
h    0
j    1
k    2
Name: a, dtype: int64


#对DataFrame类型取索引,需要使用loc通过标签索引行数据
In [15]: type(b)
Out[15]: pandas.core.frame.DataFrame

In [16]: b
Out[16]:
       a  b
c   d
one h  0  7
    j  1  6
    k  2  5
two l  3  4
    m  4  3
    n  5  2
    o  6  1

In [17]: b.loc["one"]
Out[17]:
   a  b
d
h  0  7
j  1  6
k  2  5

In [18]: b.loc["one"].loc["h"]
Out[18]:
a    0
b    7
Name: h, dtype: int64


#对于复合索引,如果想单独获取内层索引的值,就需要用到swaplevel()交换内外层索引,再通过loc来获取索引标签下的值
In [19]: b.swaplevel()
Out[19]:
       a  b
d c
h one  0  7
j one  1  6
k one  2  5
l two  3  4
m two  4  3
n two  5  2
o two  6  1

In [20]: b.swaplevel().loc["h"]
Out[20]:
     a  b
c
one  0  7
练习:
1.
使用
matplotlib
呈现出店铺总数排名前
10
的国家
#coding=utf-8
import pandas as pd
from matplotlib import  pyplot as plt
file_path="./directory.csv"
df=pd.read_csv(file_path)
# print(df.head(1))
# print(df.info())
#准备数据,按国家进行分组,并统计各个国家星巴克的数量;再排序,以降序排列,选取前10名
data1=df.groupby(by="Country")["Brand"].count().sort_values(ascending=False)[:10]

_x=data1.index
_y=data1.values

#画图
plt.figure(figsize=(20,8),dpi=80)
plt.bar(range(len(_x)),_y)
#设置x轴坐标
plt.xticks(range(len(_x)),_x)
plt.show()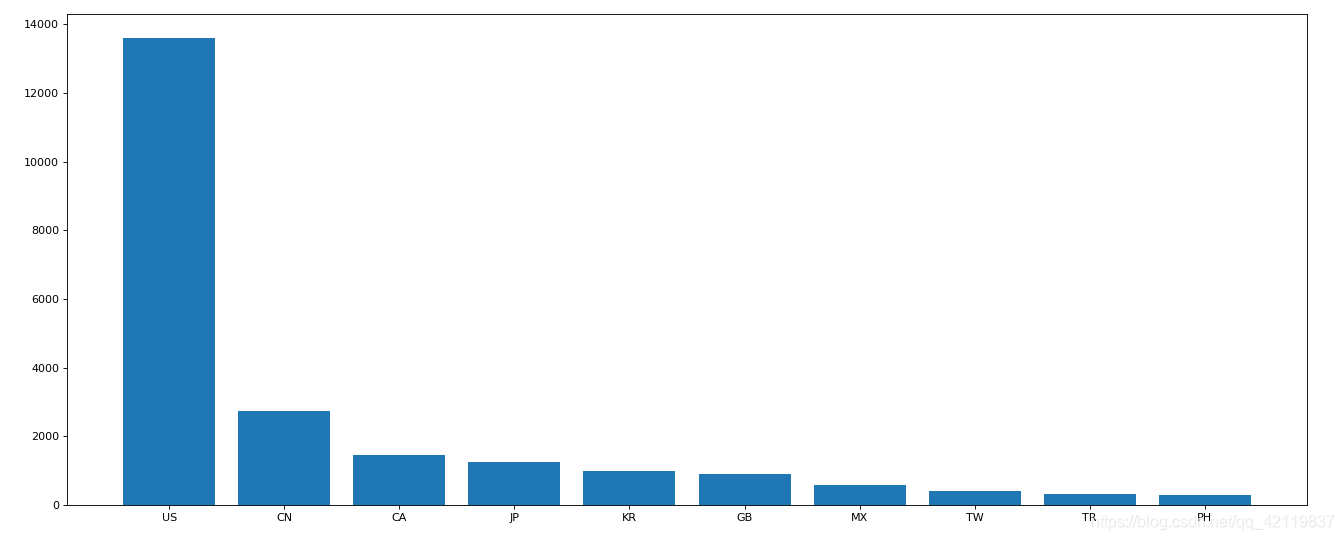
2.
使用
matplotlib
呈现出中国每个城市的店铺数量
#使用matplotlib呈现出中国每个城市的店铺数量
#coding=utf-8
import pandas as pd
from matplotlib import  pyplot as plt
from matplotlib import font_manager

#设置中文字体
my_font = font_manager.FontProperties(fname=r"D:\anaconda\Lib\site-packages\matplotlib\mpl-data\fonts\ttf\msyh.ttc")

file_path="./directory.csv"
df=pd.read_csv(file_path)
# print(df.head(1))
# print(df.info())
#准备数据,先通过布尔索引选定中国的数据,再按城市进行分组统计;再排序,以降序排列,选取前20名
data1=df[df["Country"]=="CN"].groupby(by="City")["Brand"].count().sort_values(ascending=False)[:20]
print(data1)
_x=data1.index
_y=data1.values

#画图
plt.figure(figsize=(20,8),dpi=80)
plt.bar(range(len(_x)),_y,width=0.3,color="orange")
#设置x轴坐标
plt.xticks(range(len(_x)),_x,fontproperties=my_font)
plt.show()
3.现在我们有全球排名靠前的10000本书的数据,那么请统计一下下面几个问题:
1.
不同年份书的数量
2.
不同年份书的平均评分情况
#coding=utf-8
import pandas as pd
from matplotlib import  pyplot as plt
from matplotlib import font_manager
file_path="./books.csv"
df=pd.read_csv(file_path)

#print(df.info())
#统计不同年份书的数量
data1=df[pd.notnull(df["original_publication_year"])]  #去除nan的行
# grouped=data1.groupby(by="original_publication_year").count()["title"]

#统计不同年份书的平均评分情况
grouped1=data1.groupby(by="original_publication_year")["average_rating"].mean()
# print(grouped1)
_x=grouped1.index
_y=grouped1.values

#画图
plt.figure(figsize=(20,8),dpi=80)
plt.plot(range(len(_x)),_y)
print(len(_x),len(_y))
 #设置x轴刻度
plt.xticks(list(range(len(_x)))[::10],_x[::10].astype(int),rotation=45)

plt.show()


 734
734


 被折叠的 条评论
为什么被折叠?
被折叠的 条评论
为什么被折叠?
 到【灌水乐园】发言


