


创建ID3Tree.py,使用ID3算法生成决策树,决策树以字典形式存储
import numpy as np
import pandas as pd

def calEnt(dataSet):
    n = dataSet.shape[0] #获取行数
    labelCountSet = dataSet.iloc[:,-1].value_counts() #统计每个类别的个数,yes两个,no三个
    p = labelCountSet / n #每一类标签所占的比例
    ent = (-p*np.log2(p)).sum() #计算所有类别的熵
    return ent

def bestSplit(dataSet):
    baseEnt = calEnt(dataSet) #计算目前数据集中所有类别的信息熵
    bestGain = 0 #最佳信息增益(取最大值)
    axis = -1 #最佳分割属性所在下标
    #取出每一列(标签列除外)计算信息增益
    for i in range(dataSet.shape[1]-1):
        levels = dataSet.iloc[:,i].value_counts().index #先统计第i列每个元素的个数,然后再返回这几个元素的值
        ents = 0
        for j in levels:
            childSet = dataSet[dataSet.iloc[:,i] == j] #产生一个子dataFrame,例如:先把第i列获取出来,然后判断第i列那些元素等于j,这样就能形成true和false的掩码,然后再把为true的行获取出来
            ent = calEnt(childSet) #计算第i个属性中,值为j的信息熵
            ents += (childSet.shape[0]/dataSet.shape[0])*ent
        infoGain = baseEnt - ents #计算出第i列(第i个属性的信息增益)
        if(infoGain > bestGain):
            bestGain = infoGain
            axis = i #最大信息增益所在的列下标
    return axis

def mySplit(dataSet,axis,value):
    col = dataSet.columns[axis] #获取第axis列的属性名称
    reDataSet = dataSet.loc[dataSet[col] == value,:] #获取col列元素等于value的行
    reDataSet  = reDataSet.drop(col,axis=1) #纵向删除col列
    return reDataSet

def createTree(dataSet):
    featlist = list(dataSet.columns) #获取列的属性名称 ['no surfacing', 'flippers', 'fish']
    classlist = dataSet.iloc[:,-1].value_counts() #获取每一类标签所对应的数量 no 3 yes 2 降序排序
    #递归出口条件,条件一:所有类别都一样,条件二:只剩下一个属性列
    if classlist[0] == dataSet.shape[0] or dataSet.shape[1] == 1 :
        return classlist.index[0] #标签名称
    axis = bestSplit(dataSet) #获取最佳分割属性所在下标
    bestfeat = featlist[axis] #获取最佳分割属性名称
    myTree = {bestfeat:{}} #采用字典形式存储树信息
    del featlist[axis] #删除当前属性
    valuelist = set(dataSet.iloc[:,axis]) #获取最佳分割列所有属性取值
    for value in valuelist :
        myTree[bestfeat][value] = createTree(mySplit(dataSet,axis,value))
    return myTree

#函数功能:对单个测试用例进行分类
#labels 属性和标签列名称 testVec单个测试用例
def classify(inputTree,labels,testVec):
    firstStr = next(iter(inputTree)) #获取决策树第一个节点
    secondDict = inputTree[firstStr] #在字典中获取第一个节点所对应的value
    featIndex = labels.index(firstStr) #第一个节点所在列的下标
    for key in secondDict.keys():
        if testVec[featIndex] == key:
            if type(secondDict[key]) == dict :
                classLabel = classify(secondDict[key],labels,testVec)
            else:
                classLabel = secondDict[key]
    return classLabel

def acc_classify(train,test):
    inputTree = createTree(train)
    labels = list(train.columns)
    result = []
    for i in range(test.shape[0]):
        testVec = test.iloc[i,:-1] #取第i个测试用例,同时排除标签列
        classLabel = classify(inputTree,labels,testVec)
        result.append(classLabel)
    test['predict'] = result #给test新添加一列,用来存储预测结果
    acc = (test.iloc[:,-1] == test.iloc[:,-2]).mean() #计算准确率
    print(f'模型准确率为{acc}')
    return result
创建paintingTree.py,使用matplotlib将以字典形式存储的决策树绘制出来
import matplotlib.pylab as plt
import matplotlib
import numpy as np
import pandas as pd
import ID3Tree as id3Tree #注意这个地方的引入
# 能够显示中文
matplotlib.rcParams['font.sans-serif'] = ['SimHei']
matplotlib.rcParams['font.serif'] = ['SimHei']
def plotNode(nodeTxt, centerPt, parentPt, nodeType):
"""
绘制一个节点
:param nodeTxt: 描述该节点的文本信息
:param centerPt: 文本的坐标
:param parentPt: 点的坐标,这里也是指父节点的坐标
:param nodeType: 节点类型,分为叶子节点和决策节点
:return:
"""
# 箭头样式
arrow_args = dict(arrowstyle="<-")
createPlot.ax1.annotate(nodeTxt, xy=parentPt, xycoords='axes fraction',
xytext=centerPt, textcoords='axes fraction',
va="center", ha="center", bbox=nodeType, arrowprops=arrow_args)
def getNumLeafs(myTree):
"""
获取叶节点的数目
:param myTree:
:return:
"""
# 统计叶子节点的总数
numLeafs = 0
# 得到当前第一个key,也就是根节点
firstStr = next(iter(myTree))
# 得到第一个key对应的内容
secondDict = myTree[firstStr]
# 递归遍历叶子节点
for key in secondDict.keys():
# 如果key对应的是一个字典,就递归调用
if type(secondDict[key]) == dict:
numLeafs += getNumLeafs(secondDict[key])
# 不是的话,说明此时是一个叶子节点
else:
numLeafs += 1
return numLeafs
def getTreeDepth(myTree):
"""
得到树的深度层数
:param myTree:
:return:
"""
# 用来保存最大层数
maxDepth = 0
# 得到根节点
firstStr = next(iter(myTree))
# 得到key对应的内容
secondDic = myTree[firstStr]
# 遍历所有子节点
for key in secondDic.keys():
# 如果该节点是字典,就递归调用
if type(secondDic[key]) == dict:
# 子节点的深度加1
thisDepth = 1 + getTreeDepth(secondDic[key])
# 说明此时是叶子节点
else:
thisDepth = 1
# 替换最大层数
if thisDepth > maxDepth:
maxDepth = thisDepth
return maxDepth
def plotMidText(cntrPt, parentPt, txtString):
"""
计算出父节点和子节点的中间位置,填充信息
:param cntrPt: 子节点坐标
:param parentPt: 父节点坐标
:param txtString: 填充的文本信息
:return:
"""
# 计算x轴的中间位置
xMid = (parentPt[0] - cntrPt[0]) / 2.0 + cntrPt[0]
# 计算y轴的中间位置
yMid = (parentPt[1] - cntrPt[1]) / 2.0 + cntrPt[1]
# 进行绘制
createPlot.ax1.text(xMid, yMid, txtString, va="center", ha="center", rotation=30)
def plotTree(myTree, parentPt, nodeTxt):
"""
绘制出树的所有节点,递归绘制
:param myTree: 树
:param parentPt: 父节点的坐标
:param nodeTxt: 节点的文本信息
:return:
"""
# 分叉节点,也就是决策节点 创建字典
decisionNode = dict(boxstyle="sawtooth", fc="0.8")
# 叶子节点
leafNode = dict(boxstyle="round4", fc="0.8")
# 计算叶子节点数
numLeafs = getNumLeafs(myTree)
# 计算树的深度
depth = getTreeDepth(myTree)
# 得到根节点的信息内容
firstStr = next(iter(myTree))
# 计算出当前根节点在所有子节点的中间坐标,也就是当前x轴的偏移量加上计算出来的根节点的中心位置作为x轴(比如说第一次:初始的x偏移量为:-1/2W,计算出来的根节点中心位置为:(1+W)/2W,相加得到:1/2),当前y轴偏移量作为y轴
cntrPt = (plotTree.xOff + (1.0 + float(numLeafs)) / 2.0 / plotTree.totalW, plotTree.yOff)
# 绘制该节点与父节点的联系
plotMidText(cntrPt, parentPt, nodeTxt)
# 绘制该节点
plotNode(firstStr, cntrPt, parentPt, decisionNode)
# 得到当前根节点对应的子树
secondDict = myTree[firstStr]
# 计算出新的y轴偏移量,向下移动1/D,也就是下一层的绘制y轴
plotTree.yOff = plotTree.yOff - 1.0 / plotTree.totalD
# 循环遍历所有的key
for key in secondDict.keys():
# 如果当前的key是字典的话,代表还有子树,则递归遍历
if type(secondDict[key]) == dict:
plotTree(secondDict[key], cntrPt, str(key))
else:
# 计算新的x轴偏移量,也就是下个叶子绘制的x轴坐标向右移动了1/W
plotTree.xOff = plotTree.xOff + 1.0 / plotTree.totalW
# 打开注释可以观察叶子节点的坐标变化
# print((plotTree.xOff, plotTree.yOff), secondDict[key])
# 绘制叶子节点
plotNode(secondDict[key], (plotTree.xOff, plotTree.yOff), cntrPt, leafNode)
# 绘制叶子节点和父节点的中间连线内容
plotMidText((plotTree.xOff, plotTree.yOff), cntrPt, str(key))
# 返回递归之前,需要将y轴的偏移量增加,向上移动1/D,也就是返回去绘制上一层的y轴
plotTree.yOff = plotTree.yOff + 1.0 / plotTree.totalD
def createPlot(inTree):
"""
需要绘制的决策树
:param inTree: 决策树字典
:return:
"""
# 创建一个图像
fig = plt.figure(1, facecolor='white')
fig.clf()
axprops = dict(xticks=[], yticks=[])
createPlot.ax1 = plt.subplot(111, frameon=False, **axprops)
# 计算出决策树的总宽度
plotTree.totalW = float(getNumLeafs(inTree))
# 计算出决策树的总深度
plotTree.totalD = float(getTreeDepth(inTree))
# 初始的x轴偏移量,也就是-1/2W,每次向右移动1/W,也就是第一个叶子节点绘制的x坐标为:1/2W,第二个:3/2W,第三个:5/2W,最后一个:(W-1)/2W
plotTree.xOff = -0.5 / plotTree.totalW
# 初始的y轴偏移量,每次向下或者向上移动1/D
plotTree.yOff = 1.0
# 调用函数进行绘制节点图像
plotTree(inTree, (0.5, 1.0), '')
# 绘制
plt.show()
if __name__ == '__main__':
# testTree = {'no surfacing': {0: 'no', 1: {'flippers': {0: 'no', 1: 'yes'}}, 3: 'maybe'}}
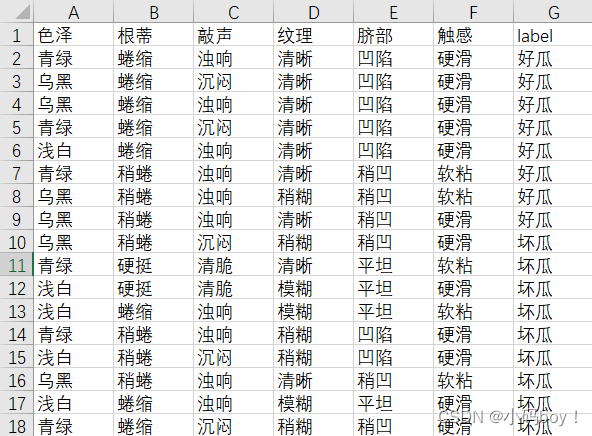
dataSet = pd.read_csv(r'C:\Users\dell\Desktop\watermelon.csv')
myTree = id3Tree.createTree(dataSet)
createPlot(myTree)运行结果
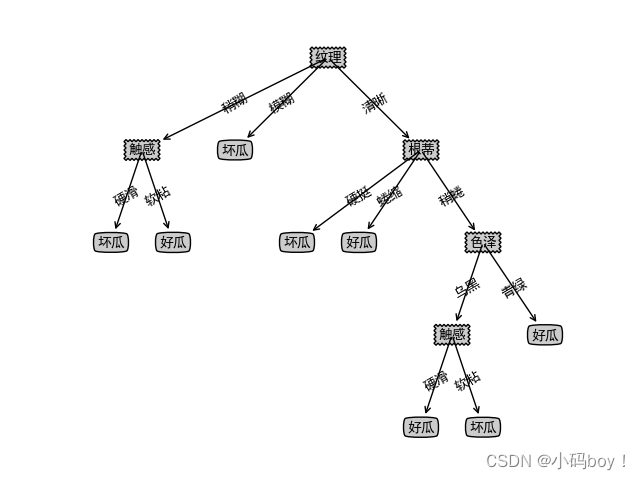
数据集:西瓜数据集


 3712
3712


 被折叠的 条评论
为什么被折叠?
被折叠的 条评论
为什么被折叠?
 到【灌水乐园】发言


