


连续系统的分岔、时间序列、相图和李雅普诺夫指数是研究动力系统时常用的工具,它们有助于揭示系统的非线性行为和复杂性。
分岔是指当系统的参数或初始条件变化时,系统行为发生突变或转变的现象。通过分岔分析,我们可以观察到系统从一个稳定状态到另一个稳定状态之间的转变,或出现周期性振荡、混沌行为等。分岔图能够直观地展现系统随着参数变化而产生的分支结构。时间序列是记录系统输出随时间变化的观测值。通过对时间序列的分析,我们可以揭示系统的动态特征、周期性行为、演化趋势以及可能存在的非线性关系。时间序列分析方法包括傅里叶变换、自相关函数和功率谱密度等。
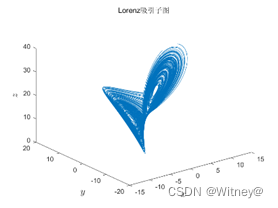
相图是将系统在状态空间中的轨迹可视化的方法。在相图中,每个点代表系统在不同时间点的状态,而轨迹则展示了系统在状态空间中的演化过程。相图能够揭示系统的相空间结构、稳定点、极限环等性质,并提供直观的视觉描述。
李雅普诺夫指数是衡量系统对初始条件的敏感性和确定其混沌行为的重要指标。它表示相空间中相邻轨迹的指数增长或衰减速率。正的李雅普诺夫指数表明系统具有混沌行为,即对初始条件极其敏感,而负的李雅普诺夫指数则表示系统的演化趋向于稳定。
因此分岔、时间序列、相图和李雅普诺夫指数是研究连续系统中非线性动力学行为的重要工具。它们帮助我们揭示系统的复杂性、稳定性和混沌行为,并为理解和预测系统的行为提供了基础。
我们给出了洛伦兹系统的四个程序,希望能有帮助。
function f=chaos_SimpleLorenz(t,y)
global c
f=zeros(3,1);
f(1)=10*(y(2)-y(1));
f(2)=(24-4*c)*y(1)+c*y(2)-y(1)*y(3);
f(3)=y(1)*y(2)-8/3*y(3);

%分岔
clc
clear
global c
C=-2:0.025:8;
L=length(C);
for i=1:L
    c=C(i);
    [T,Y]=ode45(@chaos_SimpleLorenz,0:0.01:200,[1, 2, 3]);
    data=Y(10000:end,3);
    for j=2:(length(data)-1)
        if data(j)>data(j-1)&&data(j)>data(j+1)
            plot(c,data(j),'r.','markersize',1);
            hold on;
            if j==20
                break;
            end
        end
    end
end
xlabel('$c$','interpreter','Latex',"FontName","Times New Roman","FontSize",14)
ylabel('$Zmax$','interpreter','Latex',"FontName","Times New Roman","FontSize",14)
set(gca,'FontWeight','bold','FontSize',12)
set(get(gca,'YLabel'),'FontWeight','bold','Fontsize',12)
set(get(gca,'XLabel'),'FontWeight','bold','Fontsize',12)


%相图与时间序列
clc
clear
global c
c=2;
[T,Y]=ode45(@chao_SimpleLorenz,0:0.01:500,[1 2 3]);
figure(1)
plot3(Y(30000:end,1),Y(30000:end,2),Y(30000:end,3))
xlim([-15 15])
xlabel('$x$','interpreter','Latex',"FontName","Times New Roman","FontSize",14)
ylabel('$y$','interpreter','Latex',"FontName","Times New Roman","FontSize",14)
zlabel('$z$','interpreter','Latex',"FontName","Times New Roman","FontSize",14)
title('Lorenz吸引子图');
figure(2);
plot(Y(end-10000:end,1));
xlabel('$t$','interpreter','Latex',"FontName","Times New Roman","FontSize",14)
ylabel('$x(t)$','interpreter','Latex',"FontName","Times New Roman","FontSize",14)
title('Lorenz X相时间序列');
figure(3)
plot(Y(end-10000:end,2));
xlabel('$t$','interpreter','Latex',"FontName","Times New Roman","FontSize",14)
ylabel('$y(t)$','interpreter','Latex',"FontName","Times New Roman","FontSize",14)
title('Lorenz Y相时间序列');
figure(4)
plot(Y(end-10000:end,3));
xlabel('$t$','interpreter','Latex',"FontName","Times New Roman","FontSize",14)
ylabel('$z(t)$','interpreter','Latex',"FontName","Times New Roman","FontSize",14)
title('Lorenz Z相时间序列');


%最大李雅普诺夫指数图
function Ly=MaxLypunov(cc)
global c;
c=cc;
[T,Y]=ode45(@chaos_SimpleLorenz,200:0.01:202,[0.1 0.1 0.1]);
lyap=0;
tao=2;
x0=Y(end,:);
y0=[x0(1)-3e-2,x0(2)-4e-2,x0(3)-5e-2];
d0=sqrt((y0(1)-x0(1))^2+(y0(2)-x0(2))^2+(y0(3)-x0(3))^2);
N=1000;
d=zeros(1,N);
for i=1:N
    [T,Y]=ode45(@chaos_SimpleLorenz,0:0.01:tao,x0);
    x0=Y(end,:);
    [T,Y]=ode45(@chaos_SimpleLorenz,0:0.01:tao,y0);
    y1=Y(end,:);
    d(i)=sqrt((y1(1)-x0(1))^2+(y1(2)-x0(2))^2+(y1(3)-x0(3))^2);
    z=d0/d(i);
    y0=x0+(y1-x0)*z;
    if mod(i,40)==0
        lyapl=lyap;
        lyap=0;
        for j=1:i
            lyap=lyap+log(d(i)/d0);
        end
        lyap=lyap/(j*tao);
        if abs(lyap-lyapl)<0.001
            break;
        end
    end
end
Ly=0;
for j=1:i
    Ly=Ly+log(d(i)/d0);
end
Ly=Ly/(j*tao);


clc
clear
global c
C=-2:0.05:8;
L=length(C);
for i=1:L
    c=C(i);
   Ly(i)=MaxLypunov(c);
end
   plot(C,Ly);
   xlabel('$C$','interpreter','Latex',"FontName","Times New Roman","FontSize",14)
ylabel('$MLE$','interpreter','Latex',"FontName","Times New Roman","FontSize",14)
最后得到的相图:


 239
239

 被折叠的 条评论
为什么被折叠?
被折叠的 条评论
为什么被折叠?
 到【灌水乐园】发言


