


查看Pandas版本
import pandas as pd
import numpy as np

print(pd.__version__)
一 文件读取与写入
(a)csv格式
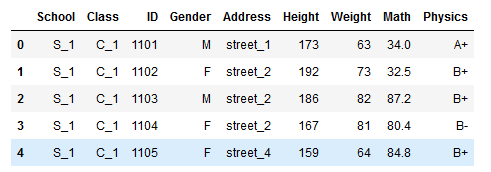
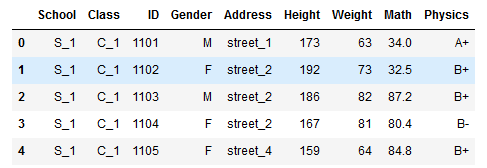
df = pd.read_csv('data/table.csv')
df.head()

(b) txt格式
# 可设置sep分隔符参数
df_txt = pd.read_table('data/table.txt')
print(df_txt)
© xls或xlsx格式
# 需要安装xlrd包
df_excel = pd.read_excel('data/table.xlsx')
print(df_excel.head())
2 写入
(a) csv格式
df.to_csv('data/new_table.csv')
# 保存时除去行索引
df.to_csv('data/new_table.csv',index=False)
(b) xls或xlsx格式
# 需要安装openpyxl
df.to_excel('data/new_table2.xlsx',sheet_name='Sheet1')
二 基本数据结构
1 Series
(a) 创建一个Series
对于一个Series,其中最常用的属性为值(values),索引(index),名字(name),类型(dtype)
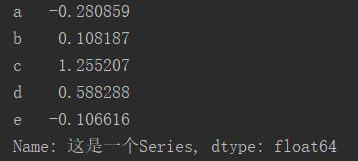
s = pd.Series(np.random.randn(5),index=['a','b','c','d','e'],name='这是一个Series',dtype='float64')
print(s)
(b) 访问Series属性
print(s.values)
print(s.index)
print(s.name)
print(s.dtype)

© 取出某一个元素
print(s['a'])

(d) 调用方法
print(s.mean())

Series其他可以调用的方法:
['T', 'a', 'abs', 'add', 'add_prefix', 'add_suffix', 'agg', 'aggregate', 'align', 'all', 'any', 'append', 'apply', 'argmax', 'argmin', 'argsort', 'array', 'asfreq', 'asof', 'astype', 'at', 'at_time', 'attrs', 'autocorr', 'axes', 'b', 'between', 'between_time', 'bfill', 'bool', 'c', 'clip', 'combine', 'combine_first', 'convert_dtypes', 'copy', 'corr', 'count', 'cov', 'cummax', 'cummin', 'cumprod', 'cumsum', 'd', 'describe', 'diff', 'div', 'divide', 'divmod', 'dot', 'drop', 'drop_duplicates', 'droplevel', 'dropna', 'dtype', 'dtypes', 'duplicated', 'e', 'empty', 'eq', 'equals', 'ewm', 'expanding', 'explode', 'factorize', 'ffill', 'fillna', 'filter', 'first', 'first_valid_index', 'floordiv', 'ge', 'get', 'groupby', 'gt', 'hasnans', 'head', 'hist', 'iat', 'idxmax', 'idxmin', 'iloc', 'index', 'infer_objects', 'interpolate', 'is_monotonic', 'is_monotonic_decreasing', 'is_monotonic_increasing', 'is_unique', 'isin', 'isna', 'isnull', 'item', 'items', 'iteritems', 'keys', 'kurt', 'kurtosis', 'last', 'last_valid_index', 'le', 'loc', 'lt', 'mad', 'map', 'mask', 'max', 'mean', 'median', 'memory_usage', 'min', 'mod', 'mode', 'mul', 'multiply', 'name', 'nbytes', 'ndim', 'ne', 'nlargest', 'notna', 'notnull', 'nsmallest', 'nunique', 'pct_change', 'pipe', 'plot', 'pop', 'pow', 'prod', 'product', 'quantile', 'radd', 'rank', 'ravel', 'rdiv', 'rdivmod', 'reindex', 'reindex_like', 'rename', 'rename_axis', 'reorder_levels', 'repeat', 'replace', 'resample', 'reset_index', 'rfloordiv', 'rmod', 'rmul', 'rolling', 'round', 'rpow', 'rsub', 'rtruediv', 'sample', 'searchsorted', 'sem', 'set_axis', 'shape', 'shift', 'size', 'skew', 'slice_shift', 'sort_index', 'sort_values', 'squeeze', 'std', 'sub', 'subtract', 'sum', 'swapaxes', 'swaplevel', 'tail', 'take', 'to_clipboard', 'to_csv', 'to_dict', 'to_excel', 'to_frame', 'to_hdf', 'to_json', 'to_latex', 'to_list', 'to_markdown', 'to_numpy', 'to_period', 'to_pickle', 'to_sql', 'to_string', 'to_timestamp', 'to_xarray', 'transform', 'transpose', 'truediv', 'truncate', 'tshift', 'tz_convert', 'tz_localize', 'unique', 'unstack', 'update', 'value_counts', 'values', 'var', 'view', 'where', 'xs']
2 DataFrame
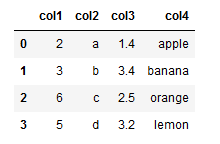
(a) 利用字典创建一个DataFrame
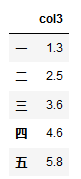
df = pd.DataFrame({
    'col1':list('abcde'),
    'col2':range(5,10),
    'col3':[1.3,2.5,4.5,5.6,6.8]
},index=list('一二三四五'))
print(df)

(b) 从DataFrame取出一列为Series
print(df['col1'])
print(type(df))
print(type(df['col1']))

© 修改行或列名
df.rename(index={'一':'one'},columns={'col1':'new_col1'})

(d) 调用属性和方法
df.index
Index([‘一’, ‘二’, ‘三’, ‘四’, ‘五’], dtype=‘object’)
df.columns
Index([‘col1’, ‘col2’, ‘col3’], dtype=‘object’)
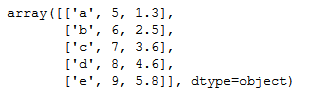
df.values
df.shape
(5, 3)
df.mean() #本质上是一种Aggregation操作
col2 7.00
col3 3.56
dtype: float64
(e) 索引对齐特性(这是Pandas中非常强大的特性,不理解这一特性有时就会造成一些麻烦)
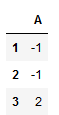
df1 = pd.DataFrame({'A':[1,2,3]},index=[1,2,3])
df2 = pd.DataFrame({'A':[1,2,3]},index=[3,1,2])
df1-df2 #由于索引对齐,因此结果不是0
(f) 列的删除与添加
对于删除而言,可以使用drop函数或del或pop
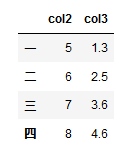
df.drop(index='五',columns='col1') #设置inplace=True后会直接在原DataFrame中改动
df['col1']=[1,2,3,4,5]
del df['col1']
pop方法直接在原来的DataFrame上操作,且返回被删除的列,与python中的pop函数类似
df['col1']=[1,2,3,4,5]
df.pop('col1')

print(df)
可以直接增加新的列,也可以使用assign方法
df1['B']=list('abc')
print(df1)

df1.assign(C=pd.Series(list('def')))

assign方法不会对原DataFrame做修改
print(df1)

(g) 根据类型选择列
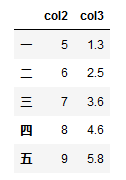
df.select_dtypes(include=['number']).head()

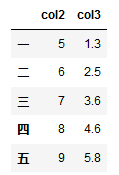
df.select_dtypes(include=['float']).head()
(h) 将Series转换为DataFrame
s = df.mean()
s.name='to_DataFrame'
print(s)

s.to_frame()

使用T符号可以转置
s.to_frame().T

三 常用基本函数
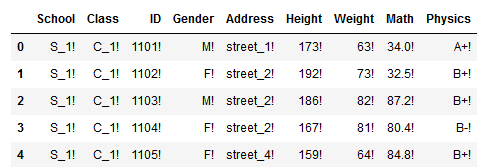
df = pd.read_csv('data/table.csv')
1 head()和tail()
df.head()
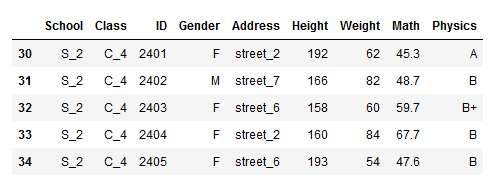
df.tail()
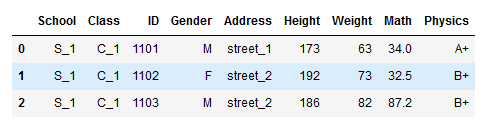
指定n参数显示多少行
df.head(3)
2 unique和nunique
nunique显示有多少个唯一值
df['Physics'].nunique()
7
unique显示所有的唯一值
df['Physics'].unique()
array([‘A+’, ‘B+’, ‘B-’, ‘A-’, ‘B’, ‘A’, ‘C’], dtype=object)
3 count和value_counts
count返回非缺失值元素个数
df['Physics'].count()
35
value_counts返回每个元素有多少个
df['Physics'].value_counts()
B+ 9
B 8
B- 6
A 4
A+ 3
A- 3
C 2
Name: Physics, dtype: int64
4 describe和info
info函数返回有哪些列、有多少非缺失值、每列的类型
df.info()

describe默认统计数值型数据的各个统计量
df.describe()

可以自行选择分位数
df.describe(percentiles=[.05, .25, .75, .95])

对于非数值型也可以用describe函数
df['Physics'].describe()
count 35
unique 7
top B+
freq 9
Name: Physics, dtype: object
5 idxmax和nlargest
idxmax函数返回最大值,在某些情况下特别适用,idxmin功能类似
df['Math'].idxmax()
5
nlargest函数返回前几个大的元素值,nsmallest功能类似
df['Math'].nlargest(3)
5 97.0
28 95.5
11 87.7
Name: Math, dtype: float64
6 clip和replace
clip和replace是两类替换函数
clip是对超过或者低于某些值的数进行截断
df['Math'].head()
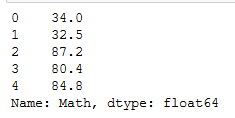
df['Math'].clip(33,80).head()

df['Math'].mad()
16.924244897959188
replace是对某些值进行替换
df['Address'].head()
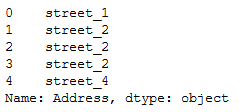
df['Address'].replace(['street_1','street_2'],['one','two']).head()

通过字典,可以直接在表中修改
df.replace({'Address':{'street_1':'one','street_2':'two'}}).head()

7 apply函数
apply是一个自由度很高的函数,在第3章我们还要提到
对于Series,它可以迭代每一列的值操作:
df['Math'].apply(lambda x:str(x)+'!').head() #可以使用lambda表达式,也可以使用函数

对于DataFrame,它可以迭代每一个列操作:
df.apply(lambda x:x.apply(lambda x:str(x)+'!')).head() #这是一个稍显复杂的例子,有利于理解apply的功能
四 排序
1 索引排序
df.set_index('Math').head() #set_index函数可以设置索引,将在下一章详细介绍

df.set_index('Math').sort_index().head() #可以设置ascending参数,默认为升序,True

2 值排序
df.sort_values(by='Class').head()

多个值排序,即先对第一层排,在第一层相同的情况下对第二层排序
df.sort_values(by=['Address','Height']).head()

五 问题与练习
1 问题
【问题一】 Series和DataFrame有哪些常见属性和方法?
Series常用属性有values,index,name,dtype
DataFrame常用属性有
【问题二】 value_counts会统计缺失值吗?
【问题三】 与idxmax和nlargest功能相反的是哪两组函数?
【问题四】 在常用函数一节中,由于一些函数的功能比较简单,因此没有列入,现在将它们列在下面,请分别说明它们的用途并尝试使用。
sum/mean/median/mad/min/max/abs/std/var/quantile/cummax/cumsum/cumprod
【问题五】 df.mean(axis=1)是什么意思?它与df.mean()的结果一样吗?第一问提到的函数也有axis参数吗?怎么使用?


 663
663


 被折叠的 条评论
为什么被折叠?
被折叠的 条评论
为什么被折叠?
 到【灌水乐园】发言


