


点击上方“小白学视觉”,选择加"星标"或“置顶”
重磅干货,第一时间送达作者丨绿竹巷人
来源丨古月居
python实现简单的车道线检测,本文章将介绍两种简单的方法
1.颜色阈值+区域掩模
2.canny边缘检测+霍夫变换
这两种方法都能实现简单的车道线检测demo,注意仅仅是demo
下面的图片是用到的测试图片

1.颜色阈值+ 区域掩模
我们可以仅仅通过设置一些RGB通道阈值,来提取车道线。
以下的代码设置了RGB通道阈值为220,大于220的像素将设置为黑色,这样可以将测试图片中的车道线提取出来
效果如下

我们发现符合阈值的像素既包括了车道线,也包含了其他非车道线部分。
显然,一个成熟的自动驾驶感知算法,是不可能使用这种方法的。仅仅依靠颜色,既不科学也不鲁棒。
有一种改进思路是利用图像掩模的方法
假设拍摄图像的前置摄像头安装在汽车上的固定位置,这样车道线将始终出现在图像的相同区域中。我们将设置了一个区域,认为车道线处于该区域内。
我们设置了一个三角形的区域,原则上你可以使用其他形状

python代码如下
import matplotlib.pyplot as plt
import matplotlib.image as mpimg
import numpy as np


# Read in the image
image = mpimg.imread('test.jpg')


# Grab the x and y sizes and make two copies of the image
# With one copy we'll extract only the pixels that meet our selection,
# then we'll paint those pixels red in the original image to see our selection
# overlaid on the original.
ysize = image.shape[0]
xsize = image.shape[1]
color_select= np.copy(image)
line_image = np.copy(image)


# Define our color criteria
red_threshold = 220
green_threshold = 220
blue_threshold = 220
rgb_threshold = [red_threshold, green_threshold, blue_threshold]


# Define a triangle region of interest (Note: if you run this code,
left_bottom = [0, ysize-1]
right_bottom = [xsize-1, ysize-1]
apex = [650, 400]


fit_left = np.polyfit((left_bottom[0], apex[0]), (left_bottom[1], apex[1]), 1)
fit_right = np.polyfit((right_bottom[0], apex[0]), (right_bottom[1], apex[1]), 1)
fit_bottom = np.polyfit((left_bottom[0], right_bottom[0]), (left_bottom[1], right_bottom[1]), 1)


# Mask pixels below the threshold
color_thresholds = (image[:,:,0] < rgb_threshold[0]) | \
                    (image[:,:,1] < rgb_threshold[1]) | \
                    (image[:,:,2] < rgb_threshold[2])


# Find the region inside the lines
XX, YY = np.meshgrid(np.arange(0, xsize), np.arange(0, ysize))
region_thresholds = (YY > (XX*fit_left[0] + fit_left[1])) & \
                    (YY > (XX*fit_right[0] + fit_right[1])) & \
                    (YY < (XX*fit_bottom[0] + fit_bottom[1]))
# Mask color selection
color_select[color_thresholds] = [0,0,0]
# Find where image is both colored right and in the region
line_image[~color_thresholds & region_thresholds] = [255,0,0]


# Display our two output images
plt.imshow(color_select)
plt.imshow(line_image)


# uncomment if plot does not display
plt.show()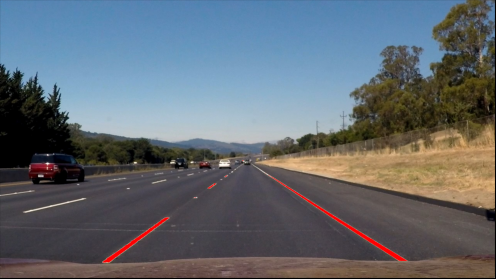
2.Canny边缘检测+霍夫变换
颜色阈值+图像掩模的方法虽然简单,但是只能应对一些固定颜色车道线的场景。图像像素受光照影响将是一个极其常见的问题。
canny边缘检测+霍夫变换是另外一种简单提取车道线的方法。首先依靠canny提取到原图像的边缘信息,再依靠霍夫变换提取满足要求的直线
import matplotlib.pyplot as plt
import matplotlib.image as mpimg
import numpy as np
import cv2


# Read in and grayscale the image
image = mpimg.imread('test.jpg')
gray = cv2.cvtColor(image,cv2.COLOR_RGB2GRAY)


# Define a kernel size and apply Gaussian smoothing
kernel_size = 5
blur_gray = cv2.GaussianBlur(gray,(kernel_size, kernel_size),0)


# Define our parameters for Canny and apply
low_threshold = 50
high_threshold = 150
edges = cv2.Canny(blur_gray, low_threshold, high_threshold)


# Next we'll create a masked edges image using cv2.fillPoly()
mask = np.zeros_like(edges)
ignore_mask_color = 255


# This time we are defining a four sided polygon to mask
imshape = image.shape
vertices = np.array([[(0,imshape[0]),(0, 0), (imshape[1], 0), (imshape[1],imshape[0])]], dtype=np.int32)  # all image
# vertices = np.array([[(0,imshape[0]),(554, 460), (700, 446), (imshape[1],imshape[0])]], dtype=np.int32)  # defining a quadrilateral region
cv2.fillPoly(mask, vertices, ignore_mask_color)
masked_edges = cv2.bitwise_and(edges, mask)


# Define the Hough transform parameters
# Make a blank the same size as our image to draw on
rho = 1 # distance resolution in pixels of the Hough grid
theta = np.pi/180 # angular resolution in radians of the Hough grid
threshold = 1     # minimum number of votes (intersections in Hough grid cell)
min_line_length = 5 #minimum number of pixels making up a line
max_line_gap = 1    # maximum gap in pixels between connectable line segments
line_image = np.copy(image)*0 # creating a blank to draw lines on


# Run Hough on edge detected image
# Output "lines" is an array containing endpoints of detected line segments
lines = cv2.HoughLinesP(masked_edges, rho, theta, threshold, np.array([]),
                            min_line_length, max_line_gap)


# Iterate over the output "lines" and draw lines on a blank image
for line in lines:
    for x1,y1,x2,y2 in line:
        cv2.line(line_image,(x1,y1),(x2,y2),(255,0,0),10)


# Create a "color" binary image to combine with line image
color_edges = np.dstack((edges, edges, edges))


# Draw the lines on the edge image
lines_edges = cv2.addWeighted(color_edges, 0.8, line_image, 1, 0)
plt.imshow(lines_edges)
plt.show()
canny边缘后,进行霍夫直线检测的结果

在此基础上,增加一个四边形的图像掩模的结果
四边形的设定,写在了代码中,只是进行了注释

总结:
以上两种方法只适合简单的demo,显然并不能识别具备一定曲率的车道线,也无法适应光照不同的情况。
之后会介绍更多的识别车道线方法。
下载1:OpenCV-Contrib扩展模块中文版教程

在「小白学视觉」公众号后台回复:扩展模块中文教程,即可下载全网第一份OpenCV扩展模块教程中文版,涵盖扩展模块安装、SFM算法、立体视觉、目标跟踪、生物视觉、超分辨率处理等二十多章内容。


下载2:Python视觉实战项目52讲
在「小白学视觉」公众号后台回复:Python视觉实战项目,即可下载包括图像分割、口罩检测、车道线检测、车辆计数、添加眼线、车牌识别、字符识别、情绪检测、文本内容提取、面部识别等31个视觉实战项目,助力快速学校计算机视觉。


下载3:OpenCV实战项目20讲
在「小白学视觉」公众号后台回复:OpenCV实战项目20讲,即可下载含有20个基于OpenCV实现20个实战项目,实现OpenCV学习进阶。


交流群

欢迎加入公众号读者群一起和同行交流,目前有SLAM、三维视觉、传感器、自动驾驶、计算摄影、检测、分割、识别、医学影像、GAN、算法竞赛等微信群(以后会逐渐细分),请扫描下面微信号加群,备注:”昵称+学校/公司+研究方向“,例如:”张三 + 上海交大 + 视觉SLAM“。请按照格式备注,否则不予通过。添加成功后会根据研究方向邀请进入相关微信群。请勿在群内发送广告,否则会请出群,谢谢理解~


 573
573


 被折叠的 条评论
为什么被折叠?
被折叠的 条评论
为什么被折叠?
 到【灌水乐园】发言


