


企业在制定战略规划时,需要对未来财务状况进行预测,并分析不同情景对财务指标的影响。请运用 Python 开发一个动态财务预测与情景分析系统。
背景数据:企业过去 5 年的资产负债表、利润表、现金流量表数据,以及对未来宏观经济形势、行业发展趋势的多种预测情景假设,包括乐观、中性、悲观情景下的销售额增长率、成本变动率、利率变化等数据。
具体要求
基于历史财务数据,使用时间序列分析或机器学习算法,对关键财务指标(如销售额、净利润、资产负债率等)进行预测。
根据不同情景假设,调整预测模型的参数,模拟不同情景下企业未来 3 - 5 年的财务状况。
通过回测,评估模型预测的准确性,并对模型进行优化。
将不同情景下的财务预测结果进行对比分析,以直观的方式呈现给决策者,辅助企业制定战略决策。
import numpy as np
import pandas as pd
from sklearn.linear_model import LinearRegression
import matplotlib.pyplot as plt
import tkinter as tk
from tkinter import messagebox
from matplotlib.backends.backend_tkagg import FigureCanvasTkAgg
# 设置 matplotlib 支持中文
plt.rcParams['font.sans-serif'] = ['SimHei']
plt.rcParams['axes.unicode_minus'] = False
# 假设的历史财务数据(过去 5 年)
historical_data = {
'year': [2020, 2021, 2022, 2023, 2024],
'sales': [1000, 1100, 1200, 1300, 1400],
'net_profit': [100, 110, 120, 130, 140],
'debt_ratio': [0.4, 0.42, 0.45, 0.43, 0.41]
}
df = pd.DataFrame(historical_data)
# 情景假设
scenarios = {
'optimistic': {
'sales_growth_rate': 0.2,
'cost_change_rate': -0.1,
'interest_rate_change': -0.01
},
'neutral': {
'sales_growth_rate': 0.1,
'cost_change_rate': 0,
'interest_rate_change': 0
},
'pessimistic': {
'sales_growth_rate': 0.05,
'cost_change_rate': 0.1,
'interest_rate_change': 0.02
}
}
# 使用线性回归进行预测
def predict_financial_metrics(data, target_column, future_years=3):
X = data[['year']]
y = data[target_column]
model = LinearRegression()
model.fit(X, y)
future_years = np.array([[year] for year in range(
data['year'].max() + 1, data['year'].max() + 1 + future_years)])
predictions = model.predict(future_years)
return predictions
# 根据情景假设调整预测结果
def adjust_predictions(predictions, scenario):
sales_growth_rate = scenario['sales_growth_rate']
cost_change_rate = scenario['cost_change_rate']
interest_rate_change = scenario['interest_rate_change']
# 这里简单假设销售额按增长率调整,净利润受成本和利率影响
adjusted_sales = predictions * (1 + sales_growth_rate)
adjusted_net_profit = adjusted_sales * \
(1 - cost_change_rate) * (1 - interest_rate_change)
return adjusted_sales, adjusted_net_profit
# 回测函数(简单示例,使用最后一年数据作为测试集)
def backtest(data, target_column):
train_X = data[['year']][:-1]
train_y = data[target_column][:-1]
test_X = data[['year']][-1:]
test_y = data[target_column][-1:]
model = LinearRegression()
model.fit(train_X, train_y)
prediction = model.predict(test_X)
error = np.abs(prediction - test_y)
# 将 error 转换为 numpy.ndarray 类型
error = error.values
return error
def run_analysis():
selected_scenario = scenario_var.get()
if selected_scenario not in scenarios:
messagebox.showerror("错误", "输入的情景名称无效,请重新选择。")
return
try:
future_years = int(future_years_entry.get())
if future_years < 3 or future_years > 5:
messagebox.showerror("错误", "预测年数应在 3 - 5 年之间,请重新输入。")
return
except ValueError:
messagebox.showerror("错误", "请输入有效的整数作为预测年数。")
return
try:
scenarios[selected_scenario]['sales_growth_rate'] = float(
sales_growth_entry.get())
scenarios[selected_scenario]['cost_change_rate'] = float(
cost_change_entry.get())
scenarios[selected_scenario]['interest_rate_change'] = float(
interest_rate_entry.get())
except ValueError:
messagebox.showerror("错误", "请输入有效的数字作为参数值。")
return
scenario = scenarios[selected_scenario]
# 预测关键财务指标
sales_predictions = predict_financial_metrics(
df, 'sales', future_years)
net_profit_predictions = predict_financial_metrics(
df, 'net_profit', future_years)
# 调整预测结果
adjusted_sales, adjusted_net_profit = adjust_predictions(
sales_predictions, scenario)
# 回测
sales_error = backtest(df, 'sales')
net_profit_error = backtest(df, 'net_profit')
result_text.delete(1.0, tk.END)
result_text.insert(tk.END, f"{selected_scenario} 情景下:\n")
result_text.insert(
tk.END, f"销售额预测误差: {sales_error[0]:.2f}\n")
result_text.insert(
tk.END, f"净利润预测误差: {net_profit_error[0]:.2f}\n")
# 可视化结果
future_year_range = range(
df['year'].max() + 1, df['year'].max() + 1 + future_years)
fig = plt.figure(figsize=(6, 4))
plt.plot(future_year_range,
adjusted_sales, label=f"{selected_scenario} 销售额")
plt.plot(future_year_range,
adjusted_net_profit, label=f"{selected_scenario} 净利润")
plt.xlabel('年份')
plt.ylabel('金额')
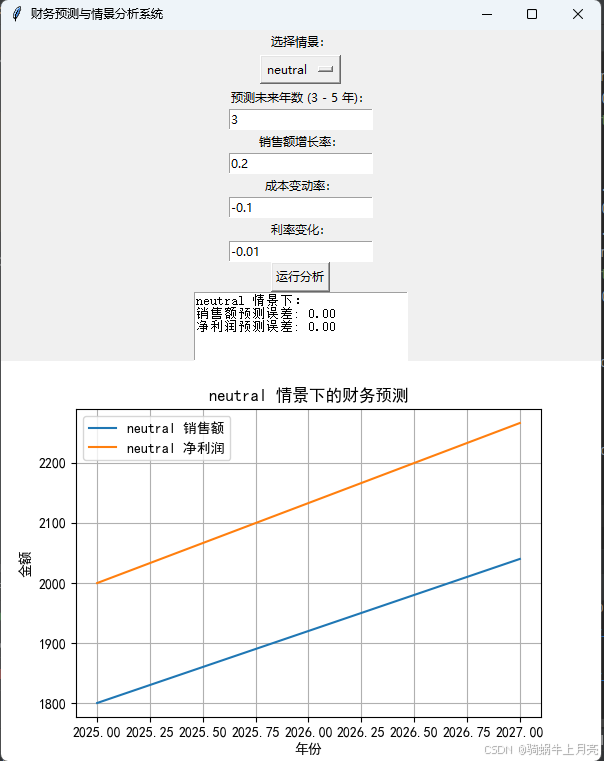
plt.title(f'{selected_scenario} 情景下的财务预测')
plt.legend()
plt.grid(True)
if hasattr(root, 'canvas'):
root.canvas.get_tk_widget().destroy()
root.canvas = FigureCanvasTkAgg(fig, master=root)
root.canvas.draw()
root.canvas.get_tk_widget().pack()
# 创建主窗口
root = tk.Tk()
root.title("财务预测与情景分析系统")
# 情景选择
scenario_label = tk.Label(root, text="选择情景:")
scenario_label.pack()
scenario_var = tk.StringVar(root)
scenario_var.set('optimistic')
scenario_options = ['optimistic', 'neutral', 'pessimistic']
scenario_menu = tk.OptionMenu(root, scenario_var, *scenario_options)
scenario_menu.pack()
# 未来年数输入
future_years_label = tk.Label(root, text="预测未来年数 (3 - 5 年):")
future_years_label.pack()
future_years_entry = tk.Entry(root)
future_years_entry.insert(0, "3")
future_years_entry.pack()
# 参数输入
sales_growth_label = tk.Label(
root, text="销售额增长率:")
sales_growth_label.pack()
sales_growth_entry = tk.Entry(root)
sales_growth_entry.insert(
0, str(scenarios['optimistic']['sales_growth_rate']))
sales_growth_entry.pack()
cost_change_label = tk.Label(root, text="成本变动率:")
cost_change_label.pack()
cost_change_entry = tk.Entry(root)
cost_change_entry.insert(
0, str(scenarios['optimistic']['cost_change_rate']))
cost_change_entry.pack()
interest_rate_label = tk.Label(root, text="利率变化:")
interest_rate_label.pack()
interest_rate_entry = tk.Entry(root)
interest_rate_entry.insert(
0, str(scenarios['optimistic']['interest_rate_change']))
interest_rate_entry.pack()
# 运行按钮
run_button = tk.Button(root, text="运行分析", command=run_analysis)
run_button.pack()
# 结果显示
result_text = tk.Text(root, height=5, width=30)
result_text.pack()
root.mainloop()


 被折叠的 条评论
为什么被折叠?
被折叠的 条评论
为什么被折叠?
 到【灌水乐园】发言


